# Oodle
> Oodle is a fully managed, AI-native observability platform — a drop-in replacement for Prometheus and ELK stack at scale. Logs, metrics, traces, and Kubernetes monitoring at 1/5th the cost with zero management.
This file contains all documentation content in a single document following the llmstxt.org standard.
## Datasets & Experiments
Datasets let you organize test cases for systematic
evaluation of your LLM application. Each dataset
contains input/expected-output pairs that you can run
through an LLM with attached evaluators to measure
quality at scale.
Navigate to **Agent Observability → Datasets**
in the sidebar ().
## Creating a Dataset
1. Click **+ New Dataset**
2. Enter a name (e.g. `sms-dataset-v1`)
3. Optionally upload a CSV file to import items
4. Click **Create**
:::note
Creating and managing datasets requires the
**Editor** or **Admin** role.
:::
### CSV Import
You can bulk-import items from a CSV file (up to
50 MB). The CSV must include an `input` column
(exact case). Optional columns:
| Column | Description |
|--------|-------------|
| `input` | The user query or prompt (required) |
| `expected_output` | The ideal response |
| `metadata` | Additional context as JSON |
A preview of the first few rows is shown before
import. Partial imports are supported: if some
rows fail, the successful rows are still added and
a summary toast shows the error count.
## Adding Items
From a dataset's detail page, click **+ New Item**
to add entries manually or via CSV.
### Manual Entry
Add one or more rows with **Input** (required),
**Expected Output**, and **Metadata** fields. Click
**+ Add another row** to add multiple items at once.
### From a Trace
On any trace detail page, click **Add to Dataset**.
Oodle splits the conversation into input and
expected output and adds it to the dataset you
select. This is useful for capturing real
production examples as test cases.
## Running Experiments
Experiments run your dataset items through a target and
optionally score the outputs with evaluators. The target is
either an **LLM connection** (a model, with an optional prompt)
or a **webhook**: an endpoint you host that runs your own
agent or workflow. See
[Testing your own agent through a webhook](#testing-your-own-agent-through-a-webhook).
1. Open a dataset and click **Run Experiment**
2. Under **What to run**, pick **A model with a prompt** or
**Your own agent**
3. Configure the experiment:
| Field | Description |
|-------|-------------|
| **LLM Connection** | Which provider credentials to use ([configure here](/agent-observability/llm-connections)) |
| **Agent** | For **Your own agent**: the endpoint that receives each item. Create, test, or manage agents under **Agent Observability → Settings → Bring Your Own Agent** |
| **Evaluator LLM connection** | For **Your own agent**: the connection that LLM judges use when no selected evaluator specifies its own |
| **Model** | The model to run items against |
| **Evaluators** | One or more active evaluator rules to score outputs |
| **Output comparers** | Evaluators that score the model's output against each item's expected output |
| **Prompt** | Optional. A prompt template (by label or version) whose `{{variables}}` each item's input fills |
3. Click **Run Experiment**
### Evaluators vs. output comparers
The two pickers hold different kinds of evaluator, and an
evaluator appears in exactly one of them.
An ordinary **evaluator** scores a generation on its own:
is it helpful, is it toxic, is it grounded in the context it
was given. It needs nothing but the request and the response,
so it also runs against live production traffic.
An **output comparer** scores the generation against the
dataset item's **expected output**: does the model's answer
mean the same thing as the answer you recorded. That makes it
a regression test rather than a quality score, and it only
works where ground truth exists. Live traffic has none, so a
comparer runs in experiments only.
Two managed comparers ship with Oodle:
| Comparer | What it scores |
|----------|----------------|
| **Output Match** | Whether the actual output is equivalent in meaning to the expected output |
| **Output Completeness** | What fraction of the expected content the actual output covers |
You can also write your own: pick **Output Comparer** when
creating an evaluator template. An experiment fills exactly
three variables for it:
| Variable | Filled with |
|----------|-------------|
| `{{input}}` | the dataset item's input |
| `{{expected_output}}` | the dataset item's expected output |
| `{{output}}` | what the model produced |
Any other `{{variable}}` is left in the prompt as written, so
the judge is handed the placeholder text rather than a value.
An output comparer has no filters, sampling rate, hourly cap or
variable mapping, and no Active/Paused state. Those all describe
running against live traffic, which a comparer never does: it
runs when an experiment names it, and Oodle supplies the three
variables above from the dataset item.
:::note
An item with no expected output is **skipped** by every output
comparer, not scored zero. The run reports how many
comparisons it skipped, so a dataset that was never given
ground truth does not read as a failing model.
:::
### How the item input reaches the model
The **Prompt** field decides how each item's `input` becomes
the request.
#### With a prompt
The item's `input` supplies the template's `{{variables}}`:
| Item `input` | What it fills |
|--------------|---------------|
| An object, `{"question": "Where is my order?", "tone": "brief"}` | Each key fills the variable of the same name: `{{question}}`, `{{tone}}` |
| A plain string, `"Where is my order?"` | Fills `{{input}}` |
| A message array, `[{"role": "user", ...}]` | Supplies no variables. Run conversation datasets without a prompt |
So the template `Answer in {{tone}}: {{question}}` with the
object input above sends
`Answer in brief: Where is my order?`.
A dataset of plain strings works the same way through the one
`{{input}}` variable: the template `Answer briefly: {{input}}`
sends `Answer briefly: Where is my order?`. Use an object input
when a template needs more than one value.
Matching is on the exact key, and a variable name is word
characters only: `{{question}}` is a variable, `{{user.name}}`
is literal text. A variable with no matching value stays in
the prompt exactly as written, so `{{user_name}}` reaches the
model as those characters and the reply usually talks about
the placeholder rather than the item.
The Run Experiment form lists the selected prompt version's
variables and marks the ones no item in the dataset supplies,
so a mismatch is visible before you spend a run. Renaming a
dataset key or a template variable so the two agree is what
fixes it.
#### With no prompt
The item's `input` **is** the request: a message array is
sent as chat messages, any other value as its JSON text.
That is the shape for a dataset that already holds full
prompts or captured conversations.
`expected_output` is never sent to the model either way. It
reaches evaluators only, as the ground truth they compare the
output against.
The experiment runs asynchronously. Results appear
in the **Runs** tab.
:::tip
If you don't have an LLM connection configured yet,
the form links to **Agent Observability → Settings → LLM Connections**
where you can add one.
:::
## Testing your own agent through a webhook
An LLM connection tests one model call. A webhook tests the
whole workflow: Oodle posts each dataset item to an endpoint
you host, your agent does whatever it does with it, and the
reply is scored the same way a model's would be. Every request
carries a W3C `traceparent` header, so each result row opens
the trace your agent emitted for that item.
Pick **Your own agent** on the Run Experiment form and
choose a webhook, or create one inline. A run against a webhook
has no generation connection, so the LLM judges and output
comparers you pick need one of their own: an evaluator that
names its own connection uses it, and the **Evaluator LLM
connection** field covers any that do not.
The evaluators can read the trace as well as the answer: a
judge prompt takes `{{trajectory}}`, and a code evaluator gets
`ctx.trace.spans`, so a rule can assert on the tools the agent
called and not only on what it said.
See [Bring Your Own Agent](/agent-observability/experiment-webhooks)
for every parameter, the request template placeholders, the
trace check, trajectory evaluation, and the CLI, Terraform and
MCP equivalents.
## Alerting on experiment scores
Every run pushes what its scorers said to your instance as
metrics, tagged with the dataset, so a monitor can watch an
output comparer or an evaluator without anyone opening the
Runs tab. They are delta counters: each run adds its own sum
and count per score.
| Metric | Labels | Meaning |
|--------|--------|---------|
| `oodle_genai_experiment_score_sum` | `dataset_id`, `dataset_name`, `score_name`, `scorer`, `target`, `data_type` | Sum of the score values a run wrote. A boolean counts as 0 or 1 |
| `oodle_genai_experiment_score_count` | same, plus `category` for a categorical score | How many scores were written |
| `oodle_genai_experiment_score_min`, `_max` | same as the sum | Gauges: the lowest and highest value one item scored in the run |
| `oodle_genai_experiment_score_failures_total` | `dataset_id`, `dataset_name`, `score_name`, `scorer`, `target` | Scorers that raised and wrote no score |
| `oodle_genai_experiment_items_total` | `dataset_id`, `dataset_name`, `target`, `status` | Items that `completed` or `failed` |
`scorer` is `output_comparer` or `evaluator`; `target` is
`llm` or `webhook`; `score_name` is the evaluator's name.
The mean score over the runs of the last day, per dataset and
scorer:
```promql
sum by (dataset_name, score_name) (
increase(oodle_genai_experiment_score_sum[1d])
)
/
sum by (dataset_name, score_name) (
increase(oodle_genai_experiment_score_count[1d])
)
```
A monitor on that expression with a threshold such as `< 0.9`
for `scorer="output_comparer"` fires when the comparer's pass
rate on a dataset drops. Set the window to cover at least one
scheduled run, or the expression has nothing to read between
runs. The share of a categorical verdict is the same ratio
with `category=""` on the numerator.
A mean hides the one item that scored zero. To fire on any
single item, read the run's low instead:
```promql
min_over_time(
oodle_genai_experiment_score_min{dataset_name="support-faq"}[1d]
) < 0.5
```
## Running on a Schedule
A dataset can run its experiment on its own, so a prompt or
model change is caught by the next scheduled run rather than
the next time someone remembers to press the button.
1. Open a dataset and go to the **Schedule** tab
2. Under **When it runs**, pick one of the two shapes:
**At set times**, for a run that has to land at a time of day
you care about (before standup, after a nightly data load):
| Field | Description |
|-------|-------------|
| **Days of week** | Which days fire. Leave all unselected to run every day |
| **Start times** | One or more `HH:MM` times. Each one is a separate run over the whole dataset |
| **Days of month** | Optional. With days of week also set, a day has to match both |
| **Timezone** | The zone the start times are read in |
**On a period**, for a run whose cadence matters but whose
wall-clock time does not: every *N* minutes, hours or days. The
shortest period is 5 minutes, and the first run happens one
period after you save. No timezone applies, because a duration
is the same length everywhere.
3. Under **What each run does**, configure the same connection,
model, evaluators, output comparers and prompt the Run
Experiment form takes
4. Click **Create schedule**
Each firing creates its own run under the **Runs** tab,
numbered like a manual run. The tab shows the next and last
run times, and if a scheduled run could not start (a deleted
LLM connection, say) it shows why.
A run starts shortly after its scheduled time rather than
exactly on the minute.
:::note
The next run time is set when a run is **queued**, not when it
finishes, so a long or failed run never delays or stops the
schedule.
If a schedule misses several runs (an outage, or the dataset's
workers were down), it does **not** replay them. One catch-up
run happens and the schedule then resumes its normal cadence.
:::
:::note
Times are read in the schedule's timezone, so a `09:00`
schedule stays at nine o'clock local across daylight saving
changes rather than drifting by an hour.
:::
Turn the **Enabled** switch off to stop a schedule firing
while keeping its definition.
### Comparing judges on a labeled dataset
When a dataset carries expected outputs, a run also reports how
each evaluator **agreed** with them, what it **cost**, and how
long it took, so one run over one dataset compares the models
behind your evaluators.
Each rule you select judges on its **own** LLM connection and
model, and each is its own column: a Jev rule, a Haiku rule and
an Opus rule that share one template sit in one run as three
columns.
**A judge is compared only with a label that names it.** Write
the item's expected output as a JSON object, keyed by the
**template** name, with one label per evaluator:
```json
{"positive": true, "toxic": false}
```
Every evaluator built from the `positive` template — a Jev one,
a Haiku one, an Opus one — reads the `positive` label, which is
what puts them in one comparison.
A **plain** expected output (`"no"`, `4`, `true`) is *not* read
as a label for any judge. It is the answer the model under test
was supposed to give, which is what an
[output comparer](/evaluators/llm-as-judge) reads. A judge
answers a different question about that answer, so comparing
the two scores a correct judge as wrong: an item expecting
`"no"` whose model answered `"no"` makes a correctness judge
score 1.0, and against `"no"` that reads as a disagreement.
Such a run reports no agreement rather than a wrong one.
Once the label names the judge, agreement follows the score's
shape:
| Score | Label | Agrees when |
|-------|-------|-------------|
| any score that names its own verdict | a word | the words match, ignoring case |
| numeric or boolean | `true`/`false`, `yes`/`no`, `pass`/`fail` | the score is at or above 0.5 exactly when the label is true |
| numeric | a number | the score is within 0.5 of it |
The first row matters for a decision model: Jev answers on its
own **Threshold**, so a `P(yes)` of 0.4 is a "yes" at a
threshold of 0.3. The verdict it decided on is compared, not a
verdict re-derived from the number at a half.
A score with nothing comparable to read is left out of the
agreement count rather than counted as wrong. An output
comparer reports no agreement at all: its score already is the
comparison with the expected output.
The run's score chips show the agreement next to the average;
the tooltip adds cost (from the model each score names) and
p50/p95 latency.
### Running evaluators as a chain
An evaluator can [depend on another](/evaluators/dependencies).
On live traffic a dependent evaluator scores only the spans its
parents flagged. In an experiment every selected evaluator
scores every item, unless you tick **Run as a chain**: then a
child scores an item only where every parent it depends on
found something, and the run's score counts show how many items
the expensive judge never had to see.
The option appears when a selected evaluator depends on
another selected one, and it is off by default, so runs and
schedules created before it existed keep scoring every item.
With the option on, every parent must be in the run. The run is
refused when a selected evaluator depends on one you did not
select, or when evaluators depend on each other in a cycle.
Without its parent, the child would score items the parent was
set to exclude. Add the parent to the run, or clear the option.
## Viewing Results
The **Runs** tab shows all experiment runs with
their status, LLM connection, evaluator, prompt
reference, and creation time.
Click any run to open a detail drawer showing:
- **Run metadata**: status, connection, model,
evaluators, prompt, and any errors
- **Per-item results**: a table with Input,
Metadata, Expected Output, Actual Output, and
score badges from each evaluator
While an experiment is running, the drawer polls
for new results every few seconds and shows a
progress indicator.
### Run Statuses
| Status | Meaning |
|--------|---------|
| Pending | Queued, not yet started |
| Running | Processing dataset items |
| Completed | All items processed |
| Failed | An error stopped the run |
---
## Bring Your Own Agent
An [LLM connection](/agent-observability/llm-connections)
tests one model call. Bring Your Own Agent tests your whole
agent through a webhook. Oodle posts each item of a
[dataset](/agent-observability/datasets) to an endpoint you host.
Your agent processes the item. Oodle scores the reply with the
same evaluators and output comparers used for model outputs.
Each result row links to the trace your agent emitted for that
item. Evaluators can also read the trace.
Navigate to **Agent Observability → Settings → Bring Your Own
Agent** (),
or pick **Create one** on the Run Experiment form.
:::note
Only **Admin** users can create and manage agents. Any user
who can run an experiment can pick one. Header values are never
shown again after they are saved: the editor shows them masked
and keeps them unless you type a new one.
:::
## How a run works
1. Oodle reads the dataset and, for each item, renders the
webhook's **request body** from the item.
2. It sends one `POST` per item to the **URL**, with the
webhook's headers plus `Content-Type`, `traceparent` and
`X-Oodle-Experiment`. Items run in parallel.
3. Any 2xx reply is accepted. The **output path** picks the
output out of the reply, and the **output regex**, if set,
keeps only part of it; that text is stored on the run item.
4. If an evaluator will read it, Oodle waits for the agent's
trace to arrive (up to 30 seconds) and turns it into a
trajectory.
5. The evaluators and output comparers score the output, and
each score is written to the run item and to the instance
as a [metric](/agent-observability/datasets#alerting-on-experiment-scores).
## Parameters
| Parameter | API field | Required | Description |
|-----------|-----------|----------|-------------|
| **Name** | `name` | yes | Unique per instance. The Run Experiment form selects an agent by name |
| **Description** | `description` | no | What the endpoint runs |
| **URL** | `url` | yes | Where each item is posted. Absolute `http(s)`, reachable from the internet; loopback, private and cluster-local hosts are refused. For a local agent, expose it with a tunnel such as ngrok |
| **Authentication** | part of `headers` | no | None, a bearer token (`Authorization: Bearer …`) or basic auth. A view of the `Authorization` header |
| **Headers** | `headers` | no | Any other headers your endpoint needs, as a name to value map. Stored encrypted; the API returns only the names, and a write that sends `********` for a name keeps its stored value |
| **Timeout** | `timeoutSeconds` | no | How long one item may take, 1 to 600 seconds. Default 60. A test from the form is capped at 120 |
| **Request body** | `requestTemplate` | no | JSON text with `{{path}}` placeholders. Default `{{input}}`: the item's input is the whole body |
| **Output path** | `outputPath` | no | Where the output is in the reply. Empty stores the whole reply |
| **Regex** | `outputRegex` | no | Applied to what the output path picked. The first capture group, or the whole match, is the output. Empty keeps the output whole |
The headers `traceparent`, `tracestate`, `X-Oodle-Experiment`,
`Host` and `Content-Length` are Oodle's and cannot be set.
### Request body
A placeholder is replaced by the JSON of the value it names,
so quoting and escaping are handled for you. In the form, type
`{{` to see the placeholders; the list includes the fields of
the sample item's input.
| Placeholder | Reads |
|-------------|-------|
| `{{input}}` | The item's whole input |
| `{{input.}}` | One field of an object input, such as `{{input.question}}`. Nest with dots and `[n]`: `{{input.messages[0].content}}` |
| `{{metadata}}`, `{{metadata.}}` | The item's metadata |
| `{{id}}` | The dataset item id |
| `{{run.id}}`, `{{run.name}}` | The run's id and name (a number). `test` on a Send test |
| `{{dataset.id}}`, `{{dataset.name}}` | The dataset the run reads |
For an endpoint that takes `{"query": "...", "user": "eval"}`:
```json
{"query": {{input.question}}, "user": "eval"}
```
A placeholder whose path finds nothing renders as `null`. The
expected output is never available to the template: it is
ground truth for the evaluators only.
### Output path
A dot path over the reply, with `[n]` for an array index:
`answer`, `result.text`, `choices[0].message.content`. A
string value is stored as is; anything else is stored as its
JSON. A reply with nothing at the path fails the item.
### Regex
When the answer is only part of a text value, add a regex after
the path (**+ Regex** beside the output path). The output is
the first capture group of the first match, or the whole match
when the regex has no group. `.` also matches a new line, so a
group can hold an answer of several lines.
For a reply `{"answer": "Thinking... Final answer: 42"}`, the
output path `answer` and the regex `Final answer: (.*)` store
`42`.
The syntax is [RE2](https://github.com/google/re2/wiki/Syntax).
Lookahead, lookbehind and backreferences are not available. Put
flags at the start of the regex, for example `(?i)` to ignore
case. A reply that does not match the regex fails the item.
### What counts as a failure
A non-2xx status, a timeout, a reply larger than 4 MB, a
reply with nothing at the output path, or an output that does
not match the regex fails that item, and the
reason is shown on the item's row. A 429, 502, 503 or 504 is
retried once, with a fresh trace id. A timeout is not retried.
## Testing a webhook
The editor shows the body it will send for a sample item as
you type. Opened from a dataset's Run Experiment form, the
sample is one of that dataset's items; otherwise it is any
input you type. **Send test** posts that body and shows three
things: the reply, the output the path and regex picked out,
and whether a trace with the request's trace id has arrived in
Oodle. Change the output path or the regex after a test and the
output updates from the same reply, so you do not need to send
the test again.
The trace check keeps looking for a minute after the reply.
Spans usually arrive a few seconds behind it, so "no trace yet"
beside a reply is not a failure until the minute is up.
## Linking your agent's trace to each result
Every request carries a W3C `traceparent` header holding a
fresh trace id. A service with OpenTelemetry HTTP
instrumentation continues that trace, so every span your agent
emits while handling the item lands in Oodle under the same id
and the result row opens it: the LLM calls, the tool calls,
and what each one did.
Nothing else is needed. If your framework is already sending
traces to Oodle (see the
[Agent Observability integrations](/integrations/agent-observability)),
the server instrumentation that reads the incoming header is
usually part of the same setup.
### Telling experiment traffic apart
Every request also carries `X-Oodle-Experiment: `, so
your agent can tell an experiment from production traffic. Two
uses:
- **Tag the traces.** Capture the header as a span attribute
and the traces page can filter on it. With OpenTelemetry's
server instrumentation that is one setting, no code:
```bash
# Python (FastAPI, Flask, Django, ASGI/WSGI)
OTEL_INSTRUMENTATION_HTTP_CAPTURE_HEADERS_SERVER_REQUEST=x-oodle-experiment
# Java agent
-Dotel.instrumentation.http.server.capture-request-headers=x-oodle-experiment
```
The attribute is `http.request.header.x_oodle_experiment` on
the server span.
- **Keep experiments out of production numbers.** Read the
header and set `deployment.environment` (or whatever your
agent uses for its environment) to something like
`experiment` on the trace, so dashboards, insights and live
evaluators filtered to production do not count it.
## Evaluating the trajectory, not only the answer
An output comparer or LLM judge sees the item's input, the
expected output and the output. On a webhook run it can also
see how the agent got there: the steps of the trace, in order,
with each tool call's name, arguments and result, each model
call, its duration and whether it failed.
- In a judge or comparer prompt, use `{{trajectory}}`. It is
filled with numbered lines such as:
```text
1. [agent] invoke_agent 2000ms
2. [tool] lookup_order 300ms ERROR: timeout
in: {"id": 42}
3. [llm] ChatOpenAI.chat (gpt-4o) 1500ms
```
- In a code evaluator, `ctx.trace.spans` is the same list as
dicts (`kind`, `name`, `tool_name`, `model`, `input`,
`output`, `duration_ms`, `error`, `error_message`), and
`ctx.trace.tools_called()` lists the tool names in order:
```python
def evaluate(ctx):
called = ctx.trace.tools_called()
return EvaluationResult(scores=[
Score(name="looked_up_order", value=1.0 if "lookup_order" in called else 0.0),
Score(name="steps", value=len(ctx.trace.spans)),
])
```
Oodle waits up to 30 seconds after the reply for the trace to
finish arriving, and only when an evaluator will read it. Long
arguments and results are cut at 2,000 characters; the whole
trace is on the run item's row. On an LLM connection run, and
on a webhook run whose trace never arrived, the trajectory is
empty.
## Running an experiment against a webhook
On the Run Experiment form, choose **Your own agent** and pick
the webhook. No prompt or model is asked for: the endpoint owns
both.
A run against a webhook has no generation connection, so the
LLM judges and output comparers you pick need one of their
own. An evaluator that names its own connection uses it; the
**Evaluator LLM connection** field covers any that do not.
Code evaluators run no model and need none.
Results read the same as any other run. Each row shows the
output, its scores, and the trace, with the span count, latency,
tokens and cost the trace carried.
## API
Under `/v1/api/instance/{instance}/langfuse/api/public/`:
| Method and path | Purpose |
|-----------------|---------|
| `GET webhooks` | List webhooks (header names only) |
| `POST webhooks` | Create one. Body: the parameters above, `headers` as a map |
| `GET webhooks/{id}` | One webhook |
| `PUT webhooks/{id}` | Update. Omitted fields keep their value; omitted `headers` keeps the stored ones, and a header sent as `********` keeps that one's stored value |
| `DELETE webhooks/{id}` | Delete |
| `POST webhook-tests` | Send one request the way a run would. Body: `webhookId` or the parameters inline, plus `input` or `datasetItemId`. Returns the request sent (credentials masked), the reply, the extracted output and the trace id |
| `POST jobs` with `type: "llm-experiment"` and `config.webhookId` | Queue a run. `config.evalConnectionId` for the judges |
## CLI
The [Oodle CLI](https://github.com/oodle-ai/oodle-cli) manages
webhooks under `oodle genai webhooks` and runs experiments
against one with `--webhook-id`:
```bash
oodle genai webhooks create --name "Support agent" \
--url https://agent.example.com/run \
--header "Authorization=Bearer $AGENT_TOKEN" \
--request-template '{"query": {{input.question}}, "run": {{run.name}}}' \
--output-path answer --timeout 120
oodle genai webhooks test "$WH" --input '{"question": "Is checkout slow?"}'
oodle genai experiments run --dataset-id "$DS" --webhook-id "$WH" \
--output-comparer-id oodle-managed-output-match-v1 \
--eval-connection-id "$CONN"
```
`list`, `get`, `update -f ` and `delete` complete the
set. Header values are encrypted at rest and never returned;
`get` shows their names.
## Terraform
The [Oodle Terraform provider](https://registry.terraform.io/providers/oodle-ai/oodle/latest/docs)
has an `oodle_genai_webhook` resource, so a webhook can live
beside the service it points at:
```hcl
resource "oodle_genai_webhook" "support_agent" {
name = "support-agent-staging"
url = "https://agent-staging.example.com/run"
headers = {
Authorization = "Bearer ${var.agent_token}"
}
request_template = "{\"query\": {{input.question}}}"
output_path = "answer"
timeout_seconds = 120
}
```
Header values are stored encrypted and the API returns only
their names, so keep them in a variable or a secret store.
## MCP
Through the [Oodle MCP server](/integrations/mcp), an AI
assistant can manage webhooks with `manage_genai_webhooks`
(`list`, `get`, `create`, `update`, `delete`; header values are
never returned, and an update that sends `********` for a
header keeps its stored value) and queue a run against one with
`manage_genai_experiments`:
```json
{"action": "run", "datasetId": "", "webhookId": "",
"outputComparerIds": ["oodle-managed-output-match-v1"],
"evalConnectionId": ""}
```
A credential still has to be typed somewhere to be stored, so
an assistant should create the webhook without one and point
you at the editor to add it, rather than ask for it in the
conversation.
---
## Agent Observability
Oodle's Agent Observability helps engineering teams
track how large language models are used across their
applications - including prompts, responses, token
consumption, and estimated costs.
New to Oodle? [Sign up for free](https://us1.oodle.ai/signup), then
pick your SDK or framework on the
[Agent Observability integrations](/integrations/agent-observability)
page: each one is a paste-ready OpenTelemetry snippet.
## How It Works
Oodle ingests traces and logs that follow the
[OpenTelemetry Gen AI semantic conventions](https://opentelemetry.io/docs/specs/semconv/gen-ai/).
When your application instruments LLM calls with these
conventions, Oodle automatically:
- Detects the **model** from `gen_ai.request.model`
and `gen_ai.response.model` span attributes
- Extracts **input and output token counts** from
`gen_ai.usage.input_tokens` and
`gen_ai.usage.output_tokens`
- Displays **prompt and response content** from
`gen_ai.input.messages`, `gen_ai.output.messages`,
and `gen_ai.system_instructions` span attributes
- Calculates **estimated costs** based on your
configured [model pricing](./model-definitions)
All of this is surfaced in the Agent Observability hub
at **Agent Observability → Overview**
().
## Exploring Traces
The Agent Observability hub has several tabs for
different views of your GenAI data.
### Overview
The default tab shows an embedded Grafana dashboard
with key metrics: token usage, cost trends, trace
counts, and model breakdowns over time.
### Traces
The main trace list with columns for timestamp, name,
input, output, model, sentiment, turns, latency, and
cost.
Search traces by **Name**, **Input**, **Output**, or
**Input/Output** combined using the field dropdown
next to the search box.
Click any trace to open the detail view (see
[Trace Detail](#trace-detail) below).
### Agent Graph
An interactive topology graph showing how agents,
tools, and LLM calls connect in your application.
Each node displays request count, error rate, and
average latency. Click a node to see:
- **Decision Paths** — outgoing connections split
into sub-agents and tool calls with probability,
error rate, and latency
- **Traces** — filtered trace list for that agent
- **Insights** — AI-generated recommendations
specific to that agent (if available)
The Agent Graph has its own sidebar with environment
and service filters, plus a node search and
visibility toggle.
### Observations
A span-level table showing individual LLM calls
rather than full traces. Columns include start time,
span type, name, input, output, model, sentiment,
log level, latency, and cost.
### Sessions
Groups traces by `session.id` into multi-turn
conversations. Each row shows the session ID, trace
count, turns, sentiment, total cost, duration, and
last activity time. Click a session to open a detail
drawer with stats and a cross-trace transcript.
:::tip
To enable sessions, set `session.id` as a span
attribute in your instrumentation. Traces sharing
the same session ID are grouped together
automatically.
:::
### Users
Aggregates usage by `user.id` — showing total events,
turns, sentiment, token count, and cost per user.
Click a user to filter the Traces tab to that user's
activity.
:::tip
Set `user.id` as a span attribute to enable
per-user tracking.
:::
### Insights
Appears when Oodle has generated AI-powered
recommendations for your GenAI application. Insights
are categorized by type (Quality, Efficiency,
Resource, Performance) and severity (High, Medium,
Low). Use this tab to identify optimization
opportunities and quality issues.
## Sidebar Filters
The sidebar on the left lets you filter data across
most tabs:
| Filter | Description |
|--------|-------------|
| **Time Range** | Controls the query window |
| **Has Error** | Show only traces with errors |
| **Environment** | Filter by `resource::env` |
| **Service** | Filter by `resource::service.name` |
| **Model** | Filter by `gen_ai.request.model` |
| **Agent Name** | Filter by `gen_ai.agent.name` |
| **Operation Name** | Filter by `gen_ai.operation.name` |
| **User ID** | Filter by `user.id` |
| **Sentiment** | Range slider from −1 to 1 |
| **Score** | Range slider from 0 to 1 |
| **Score Name** | Filter by evaluator score name |
You can also add arbitrary label filters using the
filter bar above the tab content.
## Trace Detail
Clicking on a trace opens the detail view with tabs
for **Transcript**, **Trace**, **Logs**, **Scores**,
and **Costs**.
### Transcript
Displays the full conversation — system instructions,
user prompts, and assistant responses — alongside the
model name and token count.
Use the search bar to find text across all messages.
Matches are highlighted and the view scrolls to
each result.
For traces with multiple agents (identified by
`gen_ai.agent.name`), a **By Agent** toggle groups
the conversation by agent.
### Trace
Shows the span waterfall with the full request
lifecycle, including nested agent invocations and LLM
calls.
By default, non-GenAI infrastructure spans are hidden.
Toggle **Show all spans** to reveal them. GenAI-related
spans (GENERATION, AGENT, TOOL) are expanded
automatically while infrastructure spans start
collapsed.
Each span has sub-tabs for **Overview**, **Gen AI**
(model/token/cost summary), **Transcript**, and
**Errors**.
### Scores
Shows all evaluator scores attached to the trace.
Each row displays the score name, value, source
(EVAL, ANNOTATION, or API), data type, model used,
and comment.
### Costs
Summarizes total cost, tokens, and LLM calls broken
down by model. Shows separate breakdowns for model
costs and evaluator costs.
### Trace Actions
The trace detail toolbar includes several actions:
| Action | Description |
|--------|-------------|
| **Analyze with AI** | Opens the AI sidebar assistant with the trace as context |
| **Open in Playground** | Loads the trace conversation into the [Playground](./playground) for iteration |
| **Add to Dataset** | Adds the trace as a test case to a [dataset](./datasets) |
| **Open Trace** | Opens the trace in the standard trace lookup view |
## Getting Started
### 1. Choose how data reaches Oodle
There are two supported paths. Both send the same
OpenTelemetry data, so pick the one that matches your
environment.
**Via an OpenTelemetry Collector.** Your application
exports to a collector you run, and the collector forwards
to Oodle. Redaction, sampling and batching live in the
collector, and every service uses one export path. Use
this if you already run a collector.
**Direct to Oodle.** Your application exports to Oodle
with no collector in between. There is nothing extra to
operate, but the application holds the Oodle API key and
there is no collector hop to redact content. Use the
SDK's own options to limit what is captured.
Oodle's OTLP endpoint serves the standard OTLP signal
paths (`/v1/traces`, `/v1/logs`, `/v1/metrics`) and
requires the `X-API-KEY` and `X-OODLE-INSTANCE` headers.
Requests without them are rejected with `401`.
### 2. Install instrumentation
Install the instrumentation for your LLM provider. Google
Gemini, Pydantic AI and LiteLLM are Python only: there is
no OpenTelemetry instrumentation for the `@google/genai`
JavaScript SDK, Pydantic AI has no JavaScript port, and
LiteLLM carries its OTel callback in the Python SDK only.
```bash
pip install langfuse openai \
opentelemetry-exporter-otlp-proto-http \
opentelemetry-sdk
```
```bash
npm install @langfuse/tracing @langfuse/openai \
@opentelemetry/exporter-trace-otlp-proto \
@opentelemetry/sdk-trace-base @opentelemetry/sdk-trace-node \
@opentelemetry/resources @opentelemetry/semantic-conventions openai
```
```bash
pip install openlit
```
```bash
npm install openlit
```
```bash
pip install opentelemetry-instrumentation-openai-v2 \
opentelemetry-exporter-otlp-proto-http \
opentelemetry-sdk \
httpx \
openai
```
:::note
`httpx` must be installed explicitly. `openai` 3.x depends
on `httpx2`, while
`opentelemetry-instrumentation-openai-v2` imports `httpx`
without declaring it as a dependency. Without `httpx` the
instrumentor raises `ModuleNotFoundError` on import.
:::
```bash
npm install @opentelemetry/instrumentation-openai \
@opentelemetry/instrumentation \
@opentelemetry/exporter-trace-otlp-proto \
@opentelemetry/resources \
@opentelemetry/sdk-trace-base \
@opentelemetry/sdk-trace-node \
@opentelemetry/semantic-conventions \
"openai@^6"
```
:::caution
`@opentelemetry/instrumentation-openai` supports
`openai >=4.19.0 <7`. On `openai` 7 it patches nothing and
emits no spans, without an error. Keep the version pin.
:::
```bash
pip install pydantic-ai \
opentelemetry-exporter-otlp-proto-http \
opentelemetry-sdk
```
```bash
pip install opentelemetry-instrumentation-google-genai \
opentelemetry-exporter-otlp-proto-http \
opentelemetry-sdk \
google-genai
```
```bash
pip install litellm \
opentelemetry-exporter-otlp-proto-http \
opentelemetry-sdk
```
LiteLLM depends on neither OpenTelemetry package. Without
them the callback fails to start, LiteLLM logs one
non-blocking error, and the application serves traffic and
sends nothing.
```bash
pip install langchain langchain-openai langgraph \
opentelemetry-instrumentation-langchain \
opentelemetry-exporter-otlp-proto-http \
opentelemetry-sdk
```
```bash
npm install @traceloop/instrumentation-langchain \
@opentelemetry/instrumentation \
@opentelemetry/exporter-trace-otlp-proto \
@opentelemetry/resources \
@opentelemetry/sdk-trace-base \
@opentelemetry/sdk-trace-node \
@opentelemetry/semantic-conventions \
langchain @langchain/openai @langchain/core
```
```bash
pip install traceloop-sdk google-genai
```
```bash
npm install @traceloop/node-server-sdk openai
```
See the [OpenTelemetry GenAI instrumentation registry](https://opentelemetry.io/ecosystem/registry/?language=python&component=instrumentation&search=gen+ai)
for a full list of supported providers (Anthropic,
AWS Bedrock, and more).
### 3. Instrument your application
The examples below export to a collector at
`http://otel-collector:4318`. For the direct path, replace
that endpoint with your Oodle OTLP endpoint and add the
authentication headers, as shown in step 4.
:::caution JavaScript: initialization order matters
OpenTelemetry auto-instrumentation patches modules as they
load. The SDK initialization must run **before** the LLM
client is required. If you require the client first, the
application works but emits no spans.
:::
The [Langfuse](https://langfuse.com) SDK is built on
OpenTelemetry, so its spans can be sent to Oodle like any
other instrumentation. Oodle resolves the `langfuse.*`
attributes to the standard `gen_ai.*` attributes when it
ingests them.
```python
from opentelemetry.exporter.otlp.proto.http.trace_exporter import OTLPSpanExporter
from opentelemetry.sdk.resources import Resource
from opentelemetry.sdk.trace import TracerProvider
from opentelemetry.sdk.trace.export import BatchSpanProcessor
from opentelemetry.trace import set_tracer_provider
from langfuse import Langfuse, get_client, observe
def setup_opentelemetry():
resource = Resource.create({"service.name": "my-llm-app"})
tracer_provider = TracerProvider(resource=resource)
tracer_provider.add_span_processor(
BatchSpanProcessor(OTLPSpanExporter())
)
set_tracer_provider(tracer_provider)
return tracer_provider
# Langfuse writes into the application tracer provider.
Langfuse(tracer_provider=setup_opentelemetry())
# The Langfuse OpenAI drop-in traces every call it makes.
from langfuse.openai import openai
@observe()
def chat(message: str) -> str:
response = openai.chat.completions.create(
model="gpt-4o-mini",
messages=[{"role": "user", "content": message}],
)
return response.choices[0].message.content
chat("Hello!")
# Short-lived processes must flush before they exit.
get_client().flush()
```
```typescript
// instrumentation.ts
export const provider = new NodeTracerProvider({
resource: resourceFromAttributes({ [ATTR_SERVICE_NAME]: 'my-llm-app' }),
spanProcessors: [new BatchSpanProcessor(new OTLPTraceExporter())],
});
provider.register();
// Langfuse writes into this provider.
setLangfuseTracerProvider(provider);
```
```typescript
// index.ts - import the instrumentation first.
const openai = observeOpenAI(new OpenAI());
const chat = observe(
async (message: string) => {
const response = await openai.chat.completions.create({
model: 'gpt-4o-mini',
messages: [{ role: 'user', content: message }],
});
return response.choices[0].message.content;
},
{ name: 'chat' },
);
async function main() {
await chat('Hello!');
// Short-lived processes must flush before they exit.
await provider.forceFlush();
}
main();
```
:::caution
Attach Langfuse to the application tracer provider, as
shown. If you register `LangfuseSpanProcessor` **and** an
OTLP span processor in the same provider, every Langfuse
span is exported twice, which double counts tokens and
cost. See the Langfuse guide on
[using an existing OpenTelemetry setup](https://langfuse.com/faq/all/existing-otel-setup).
:::
:::note
`LANGFUSE_PUBLIC_KEY` and `LANGFUSE_SECRET_KEY` must be
set even when the OTLP exporter owns transport. Without
them the Langfuse client disables itself and emits
nothing. Any value works in that case.
:::
[OpenLIT](https://github.com/openlit/openlit) auto-instruments
supported LLM providers, vector databases, MCP tools, and GPUs
with a single `init()` call.
```python
openlit.init(
service_name="my-llm-app",
otlp_endpoint="http://otel-collector:4318",
capture_message_content=True,
)
# Import your LLM SDK after openlit.init so it gets patched.
```
```javascript
const Openlit = require('openlit').default;
Openlit.init({
applicationName: 'my-llm-app',
otlpEndpoint: 'http://otel-collector:4318',
captureMessageContent: true,
});
// Require your LLM SDK after Openlit.init.
const OpenAI = require('openai');
```
Set `capture_message_content` to capture prompt and
response content in span attributes. Review your
organization's data policies before you enable it in
production.
```python
from opentelemetry import _logs as otel_logs
from opentelemetry import trace as otel_trace
from opentelemetry.exporter.otlp.proto.http._log_exporter import OTLPLogExporter
from opentelemetry.exporter.otlp.proto.http.trace_exporter import OTLPSpanExporter
from opentelemetry.instrumentation.openai_v2 import OpenAIInstrumentor
from opentelemetry.sdk._logs import LoggerProvider
from opentelemetry.sdk._logs.export import BatchLogRecordProcessor
from opentelemetry.sdk.resources import Resource
from opentelemetry.sdk.trace import TracerProvider
from opentelemetry.sdk.trace.export import BatchSpanProcessor
def setup_opentelemetry():
resource = Resource.create({"service.name": "my-llm-app"})
tracer_provider = TracerProvider(resource=resource)
tracer_provider.add_span_processor(BatchSpanProcessor(OTLPSpanExporter()))
otel_trace.set_tracer_provider(tracer_provider)
logger_provider = LoggerProvider(resource=resource)
logger_provider.add_log_record_processor(
BatchLogRecordProcessor(OTLPLogExporter())
)
otel_logs.set_logger_provider(logger_provider)
setup_opentelemetry()
OpenAIInstrumentor().instrument()
```
Put the setup in `instrumentation.js` and load it before
the application with `node --require ./instrumentation.js app.js`:
```javascript
// instrumentation.js
const { OpenAIInstrumentation } = require('@opentelemetry/instrumentation-openai');
const { registerInstrumentations } = require('@opentelemetry/instrumentation');
const { OTLPTraceExporter } = require('@opentelemetry/exporter-trace-otlp-proto');
const { resourceFromAttributes } = require('@opentelemetry/resources');
const { BatchSpanProcessor } = require('@opentelemetry/sdk-trace-base');
const { NodeTracerProvider } = require('@opentelemetry/sdk-trace-node');
const { ATTR_SERVICE_NAME } = require('@opentelemetry/semantic-conventions');
const provider = new NodeTracerProvider({
resource: resourceFromAttributes({ [ATTR_SERVICE_NAME]: 'my-llm-app' }),
spanProcessors: [new BatchSpanProcessor(new OTLPTraceExporter())],
});
provider.register();
registerInstrumentations({ instrumentations: [new OpenAIInstrumentation()] });
process.on('beforeExit', () => provider.shutdown());
```
:::note
`NodeTracerProvider` does not read `OTEL_SERVICE_NAME`.
Name the service in the `resource` as shown, or every
trace arrives as `unknown_service:node`.
:::
```python
from opentelemetry.exporter.otlp.proto.http.trace_exporter import OTLPSpanExporter
from opentelemetry.sdk.resources import Resource
from opentelemetry.sdk.trace import TracerProvider
from opentelemetry.sdk.trace.export import BatchSpanProcessor
from opentelemetry.trace import set_tracer_provider
from pydantic_ai import Agent, InstrumentationSettings
def setup_opentelemetry():
resource = Resource.create({"service.name": "my-llm-app"})
tracer_provider = TracerProvider(resource=resource)
tracer_provider.add_span_processor(
BatchSpanProcessor(OTLPSpanExporter())
)
set_tracer_provider(tracer_provider)
setup_opentelemetry()
# use_aggregated_usage_attribute_names=False emits the standard
# gen_ai.* usage attributes instead of aggregated ones.
Agent.instrument_all(InstrumentationSettings(
use_aggregated_usage_attribute_names=False,
))
```
Pydantic AI captures prompt and response content by
default. Pass `include_content=False` to
`InstrumentationSettings` to disable it.
```python
from opentelemetry import _logs as otel_logs
from opentelemetry import trace as otel_trace
from opentelemetry.exporter.otlp.proto.http._log_exporter import OTLPLogExporter
from opentelemetry.exporter.otlp.proto.http.trace_exporter import OTLPSpanExporter
from opentelemetry.instrumentation.google_genai import GoogleGenAiSdkInstrumentor
from opentelemetry.sdk._logs import LoggerProvider
from opentelemetry.sdk._logs.export import BatchLogRecordProcessor
from opentelemetry.sdk.resources import Resource
from opentelemetry.sdk.trace import TracerProvider
from opentelemetry.sdk.trace.export import BatchSpanProcessor
def setup_opentelemetry():
resource = Resource.create({"service.name": "my-llm-app"})
tracer_provider = TracerProvider(resource=resource)
tracer_provider.add_span_processor(BatchSpanProcessor(OTLPSpanExporter()))
otel_trace.set_tracer_provider(tracer_provider)
logger_provider = LoggerProvider(resource=resource)
logger_provider.add_log_record_processor(
BatchLogRecordProcessor(OTLPLogExporter())
)
otel_logs.set_logger_provider(logger_provider)
setup_opentelemetry()
GoogleGenAiSdkInstrumentor().instrument()
```
After this, all calls to the Google Gemini SDK are traced
automatically.
```python
# LiteLLM builds its own tracer provider from the
# OTEL_EXPORTER_OTLP_* variables, so there is no SDK setup
# to write here.
litellm.callbacks = ["otel"]
response = litellm.completion(
model="gpt-4o-mini",
messages=[{"role": "user", "content": "Hello!"}],
)
```
Every call LiteLLM routes is traced, whichever provider
serves it. LiteLLM Proxy takes the same callback in
`config.yaml`:
```yaml
litellm_settings:
callbacks: ["otel"]
```
LiteLLM captures prompt and response content by default.
Set
`OTEL_INSTRUMENTATION_GENAI_CAPTURE_MESSAGE_CONTENT=NO_CONTENT`
to disable it.
```python
from langchain.agents import create_agent
from langchain_openai import ChatOpenAI
from opentelemetry.exporter.otlp.proto.http.trace_exporter import OTLPSpanExporter
from opentelemetry.instrumentation.langchain import LangchainInstrumentor
from opentelemetry.sdk.resources import Resource
from opentelemetry.sdk.trace import TracerProvider
from opentelemetry.sdk.trace.export import BatchSpanProcessor
from opentelemetry.trace import set_tracer_provider
def setup_opentelemetry():
resource = Resource.create({"service.name": "my-llm-app"})
tracer_provider = TracerProvider(resource=resource)
tracer_provider.add_span_processor(
BatchSpanProcessor(OTLPSpanExporter())
)
set_tracer_provider(tracer_provider)
setup_opentelemetry()
# Auto-instruments LangChain chains, LLM calls, tools,
# and retrievers. No manual spans required.
LangchainInstrumentor().instrument()
agent = create_agent(ChatOpenAI(model="gpt-4o-mini"), tools=[])
```
:::note
Build agents with `from langchain.agents import create_agent`.
`langgraph.prebuilt.create_react_agent` is deprecated in
LangGraph v1.
:::
```javascript
// instrumentation.js
const { LangChainInstrumentation } = require('@traceloop/instrumentation-langchain');
const { registerInstrumentations } = require('@opentelemetry/instrumentation');
const { OTLPTraceExporter } = require('@opentelemetry/exporter-trace-otlp-proto');
const { resourceFromAttributes } = require('@opentelemetry/resources');
const { BatchSpanProcessor } = require('@opentelemetry/sdk-trace-base');
const { NodeTracerProvider } = require('@opentelemetry/sdk-trace-node');
const { ATTR_SERVICE_NAME } = require('@opentelemetry/semantic-conventions');
const provider = new NodeTracerProvider({
resource: resourceFromAttributes({ [ATTR_SERVICE_NAME]: 'my-llm-app' }),
spanProcessors: [new BatchSpanProcessor(new OTLPTraceExporter())],
});
provider.register();
registerInstrumentations({ instrumentations: [new LangChainInstrumentation()] });
process.on('beforeExit', () => provider.shutdown());
```
[Traceloop's OpenLLMetry](https://github.com/traceloop/openllmetry)
SDK auto-instruments supported LLM SDKs with a single
init call.
```python
from google import genai
from traceloop.sdk import Traceloop
from traceloop.sdk.decorators import workflow
# Auto-instruments Gemini, OpenAI, Anthropic, LangChain, and more.
Traceloop.init(app_name="my-llm-app")
client = genai.Client()
# Optional: group related LLM calls under a named workflow span.
@workflow(name="chat")
def chat(message: str) -> str:
response = client.models.generate_content(
model="gemini-flash-latest",
contents=message,
)
return response.text
```
```javascript
const traceloop = require('@traceloop/node-server-sdk');
traceloop.initialize({
appName: 'my-llm-app',
baseUrl: process.env.TRACELOOP_BASE_URL,
});
// Require your LLM SDK after initialize.
const OpenAI = require('openai');
```
:::note
Traceloop uses its own environment variables instead of
the `OTEL_*` ones. Point the SDK at your collector with
`TRACELOOP_BASE_URL=http://otel-collector:4318`; the SDK
appends `/v1/traces`. Content capture is on by default;
disable it with `TRACELOOP_TRACE_CONTENT=false`.
:::
### 4. Set environment variables
```bash
export OTEL_EXPORTER_OTLP_ENDPOINT=http://otel-collector:4318
export OTEL_SEMCONV_STABILITY_OPT_IN=gen_ai_latest_experimental
export OTEL_INSTRUMENTATION_GENAI_CAPTURE_MESSAGE_CONTENT=span_and_event
```
The collector holds the Oodle credentials, so the
application does not need them.
```bash
export OTEL_EXPORTER_OTLP_ENDPOINT=https://-otlp.collector.oodle.ai
export OTEL_EXPORTER_OTLP_HEADERS="X-API-KEY=,X-OODLE-INSTANCE="
export OTEL_SEMCONV_STABILITY_OPT_IN=gen_ai_latest_experimental
export OTEL_INSTRUMENTATION_GENAI_CAPTURE_MESSAGE_CONTENT=span_and_event
```
In JavaScript, set
`OTEL_INSTRUMENTATION_GENAI_CAPTURE_MESSAGE_CONTENT=true`
instead. That instrumentation parses the setting as a
boolean, warns on any other value, and captures nothing.
Traceloop uses `TRACELOOP_BASE_URL` and
`TRACELOOP_HEADERS` instead.
LiteLLM also reads `OTEL_SERVICE_NAME`. It has no code
hook for the resource, so without that variable every
trace lands under the service name `litellm`.
Langfuse uses the same OTLP endpoint and headers as every
other provider. Oodle does serve a Langfuse-compatible
ingest API, but that path is for prompt management, not
for tracing: sending spans through it leaves the Langfuse
SDK owning the only tracer provider, which drops every
non-Langfuse span your application produces.
| Variable | Description |
|----------|-------------|
| `OTEL_EXPORTER_OTLP_ENDPOINT` | OTLP endpoint: your collector, or the Oodle OTLP endpoint for the direct path |
| `OTEL_EXPORTER_OTLP_HEADERS` | Oodle authentication, direct path only |
| `OTEL_SEMCONV_STABILITY_OPT_IN` | Set to `gen_ai_latest_experimental` to enable GenAI semantic conventions (not needed for Pydantic AI). Required for LiteLLM: without it the span carries no `gen_ai.operation.name`, and the Agent Observability traces list, which filters on that attribute, shows nothing |
| `OTEL_INSTRUMENTATION_GENAI_CAPTURE_MESSAGE_CONTENT` | Captures prompt/response content. Python reads a mode name, so use `span_and_event`; the JavaScript instrumentation parses a boolean, so use `true` there. Not needed for Pydantic AI, which captures content by default |
:::caution
`OTEL_INSTRUMENTATION_GENAI_CAPTURE_MESSAGE_CONTENT` captures full prompt and response text. This may include sensitive data. Review your organization's data policies before you enable it in production. On the direct path there is no collector to redact it.
:::
### 5. Configure the OpenTelemetry Collector
Skip this step if you send data directly to Oodle.
Route traces and logs from your application to Oodle
through an OpenTelemetry Collector. The collector exports
to Oodle's OTLP endpoint, which serves the standard OTLP
paths (`/v1/traces`, `/v1/logs`):
```yaml
receivers:
otlp:
protocols:
http:
endpoint: "0.0.0.0:4318"
processors:
batch:
timeout: 5s
send_batch_size: 512
exporters:
otlphttp/oodle:
endpoint: "https://-otlp.collector.oodle.ai"
headers:
"X-OODLE-INSTANCE": ""
"X-API-KEY": ""
service:
pipelines:
traces:
receivers: [otlp]
processors: [batch]
exporters: [otlphttp/oodle]
logs:
receivers: [otlp]
processors: [batch]
exporters: [otlphttp/oodle]
```
Replace `` and `` with your
credentials from **Settings → API Keys** in the Oodle UI
().
See the [OpenTelemetry integration guide](/integrations/traces/otel)
for full collector and SDK configuration options.
### 6. Verify in Oodle
Navigate to **GenAI > Traces** (). Click on
a trace to see the Transcript, Trace waterfall, and Costs
breakdown.
If no spans arrive:
- **JavaScript, no spans at all**: confirm the SDK
initialization runs before the LLM client is required,
and that `openai` is below version 7.
- **Python with OpenAI, `ModuleNotFoundError`**: install
`httpx`.
- **Langfuse, no spans**: confirm `LANGFUSE_PUBLIC_KEY`
and `LANGFUSE_SECRET_KEY` are set.
- **Langfuse spans counted twice**: the application must
not add its own OTLP span processor as well as
`LangfuseSpanProcessor`.
- **`401` responses**: check `X-API-KEY` and
`X-OODLE-INSTANCE`.
## Demo Applications
The [oodle-onboarding](https://github.com/oodle-ai/oodle-onboarding)
repository includes ready-to-run demos:
- [**llmops-otel-demo**](https://github.com/oodle-ai/oodle-onboarding/tree/main/llmops-otel-demo) — Google Gemini with OTel instrumentation
- [**pydantic-ai-demo**](https://github.com/oodle-ai/oodle-onboarding/tree/main/pydantic-ai-demo) — Pydantic AI multi-agent example with tool use and structured outputs
- [**traceloop-demo**](https://github.com/oodle-ai/oodle-onboarding/tree/main/traceloop-demo) — Traceloop (OpenLLMetry) SDK auto-instrumenting Google Gemini
- [**openlit-demo**](https://github.com/oodle-ai/oodle-onboarding/tree/main/openlit-demo) — OpenLIT with agents (LangGraph), guardrails, VectorDB (ChromaDB RAG), and MCP tool tracing
```bash
git clone https://github.com/oodle-ai/oodle-onboarding.git
cd oodle-onboarding/llmops-otel-demo
cp .env.example .env
# Edit .env with your OODLE_INSTANCE, OODLE_API_KEY, and GEMINI_API_KEY
make up
make test-chat
```
Each demo includes an OTel Collector and Docker Compose
configuration — everything needed to see LLM traces in
Oodle in minutes.
## Cost Tracking
Once [model definitions](./model-definitions) are
configured, Oodle shows cost data on every LLM trace.
The cost is calculated as:
```
cost = (input_tokens / 1,000,000) × input_price
+ (output_tokens / 1,000,000) × output_price
```
For parent spans (agent invocations), Oodle aggregates
token counts from child LLM spans and shows the total
estimated cost. See the [Model Definitions](./model-definitions)
page for pricing configuration.
---
## LLM Connections
LLM Connections store your provider API credentials
so Oodle can call LLMs on your behalf. They are
required for the
[Playground](/agent-observability/playground),
[LLM-as-Judge evaluators](/evaluators/llm-as-judge),
and [dataset experiments](/agent-observability/datasets).
Navigate to **Agent Observability → Settings → LLM
Connections** ().
:::note
Only **Admin** users can create and manage LLM
connections.
:::
## Supported Providers
| Provider | Default Base URL |
|----------|------------------|
| **Google** | `https://generativelanguage.googleapis.com` |
| **Anthropic** | `https://api.anthropic.com` |
| **OpenAI** | `https://api.openai.com/v1` |
| **TypeSafe (Jev)** | `https://api.typesafe.ai/v1/systemone` |
### TypeSafe (Jev)
Jev is a decision model, not a chat model. It answers
a typed question (yes/no, one of a set of options, or a
level on a scale) with a calibrated probability, and it
cannot generate text. Use a TypeSafe connection in two
places:
- As an [evaluator](/evaluators/llm-as-judge)'s
connection: the evaluator prompt is the question.
- As an [experiment](/agent-observability/datasets)'s
model, when the prompt template asks one question
about the item's variables. The **Decision** field
on the run form gives the answer's shape, one of
Jev's three question types:
| Decision | Criteria | Output |
|----------|----------|--------|
| Yes / no | none; **Threshold** is the P(yes) at or above which the answer is `yes` (0.5 unless set) | `yes` or `no` |
| One of a set of options | one option per line, `option: description` | the chosen option |
| A level on an ordered scale | 2 to 10 levels, one per line, lowest first | the nearest level |
The output is a word, so an output comparer reads it
like any model's, and you can compare Jev with chat
models on the same decision task, for example "which
team owns this ticket?".
The Playground does not list it.
To reach Jev through OpenRouter instead, set the
**Base URL** to
`https://openrouter.ai/api/alpha/decisions` and add
`~typesafe/jev-latest` as a custom model.
## Creating a Connection
1. Click **+ New Connection**
2. Fill in the required fields:
| Field | Required | Description |
|-------|----------|-------------|
| **Name** | Yes | Display name for the connection |
| **Provider** | Yes | Google, Anthropic, OpenAI, or TypeSafe |
| **API Key** | Yes | Your provider API key |
| **Default Model** | No | Model used when none is explicitly selected |
| **Base URL** | No | Override the default API endpoint (useful for proxies or custom deployments) |
| **Custom Models** | No | Additional model names not in the built-in list (e.g. `deepseek/deepseek-v4-flash`) |
| **Custom Headers** | No | Extra HTTP headers sent with every request |
3. Optionally toggle **Set as default connection**
to make this the primary connection
4. Optionally toggle **Show default models from
provider** off to hide built-in models and only
show your custom models
5. Click **Create**
## Default Connection
One connection can be marked as the default. The
Playground, evaluator wizard, and experiment form
auto-select the default connection when no other
is specified.
## Custom Models
If your provider supports models not in Oodle's
built-in list, add them as **Custom Models**. These
appear alongside built-in models in every model
selector. You can also type any model name directly
in model dropdowns — select **Use "model-name"** to
use an unlisted model.
## Editing and Deleting
Click the edit icon on any connection to update its
configuration. When editing, leave the API key
blank to keep the existing key.
:::warning
Deleting a connection stops any evaluators and
Playground sessions that use it.
:::
---
## Model Definitions
Model Definitions let you configure pricing
information for each LLM model your applications use.
Navigate to **Agent Observability → Model Definitions**
in the sidebar ().
## How pricing works
Each model definition includes:
| Field | Description |
|-------|-------------|
| **Model Name** | Display name (e.g. `gemini-flash-latest`) |
| **Match Pattern** | Regex matched against the model name in traces |
| **Input Price** | Cost per 1M input tokens (USD) |
| **Output Price** | Cost per 1M output tokens (USD) |
When a trace span includes token usage and a model
name, Oodle walks the model definitions list and
applies the first matching pattern to estimate the
cost.
## Adding a model
1. Go to **Agent Observability → Model Definitions**
()
2. Models detected in your traces that don't match any
existing pattern appear at the top of the table with
a warning - click to add pricing
3. Enter the model name, a regex match pattern, and
input/output prices per 1M tokens
---
## Playground
The Playground is an interactive testing environment
for LLM prompts. Compare outputs across models
side by side, define tools for function calling,
and iterate on prompts before deploying them.
Navigate to **Agent Observability → Playground**
in the sidebar ().
:::info Beta
The Playground is currently in Beta.
:::
## Prerequisites
The Playground requires at least one
[LLM Connection](/agent-observability/llm-connections)
to be configured. If no connections exist, the model
selector shows a link to **Settings → LLM
Connections**.
## Getting Started
1. Select an **LLM Connection** and **Model** from
the dropdowns at the top of the window
2. Add messages using the **+ Message** dropdown
(User, Assistant, System, Developer, or Tool)
3. Type your prompt content in the message editor
4. Click **Submit** or press **⌘ Enter** to run
The output appears at the bottom of the window
with the model's response, including any tool calls
or reasoning output.
## Multi-Window Comparison
Click **New split window** to add up to four
side-by-side windows. Each window has its own
connection, model, messages, and output — useful for
A/B testing prompts across different models or
configurations.
- **Duplicate window** — copies the window
configuration
- **Remove window** — removes a window (available
when more than one is open)
- **Run All** (⌘ Enter) — submits all windows that
have a model selected, in parallel
- **Reset** — replaces all windows with a single
empty window
## Messages
Messages support the following roles:
| Role | Purpose |
|------|---------|
| **System** | System instructions for the model |
| **User** | User input / prompt |
| **Assistant** | Model response (for few-shot examples) |
| **Developer** | Developer instructions |
| **Tool** | Tool result linked to a tool call |
Click the role badge on any message to cycle through
roles. Drag the handle to reorder messages.
### Prompt References
Type `@@@` in a message to link to a saved
[prompt](/prompt-management). Oodle resolves prompt
references before sending the request to the model.
## Template Variables
Use `{{variable_name}}` syntax in message content
to create template variables. The **Variables**
panel (badge shows count) lets you fill in values
for each variable before running.
All variables must have values before submitting —
the Playground warns if any are unfilled.
## Tools (Function Calling)
Click **Tools** to define function tools the model
can call. Each tool has:
- **Name** — e.g. `get_weather`
- **Description** — what the tool does
- **JSON Schema** — parameter schema (visual
builder or raw JSON)
When the model responds with tool calls, they appear
as expandable blocks in the output.
:::caution
Tools and structured output cannot be used at the
same time.
:::
## Structured Output
Click **Schema** to define a JSON schema that
constrains the model's output format. Specify a
name, description, and schema using the visual
builder or raw JSON editor.
## Model Parameters
Click the gear icon to configure optional
parameters:
| Parameter | Range | Default |
|-----------|-------|---------|
| **Temperature** | 0–2 | 1.0 |
| **Max Tokens** | 1–65536 | 2048 |
| **Top P** | 0–1 | 1.0 |
| **Additional options** | Provider-specific JSON | `{}` |
Each parameter has a toggle — enable it to override
the model's default.
## Seeding from Traces
From any trace detail page, click **Open in
Playground** to load the trace's conversation into
the Playground. This seeds:
- All messages (system, user, assistant, tool)
- The model name
- Tool definitions (if present in the trace)
Use this to replay and iterate on real production
conversations.
### Replaying from one message
To start from a single turn instead of the whole
run, hover any message in the **Transcript** tab, or
in the **Gen AI** panel of the trace waterfall, and
click the pencil (**Edit and replay**). The
Playground opens with the conversation up to and
including that message, that message last and ready
to edit. Run it to see what a different prompt would
have produced from the same point.
On a trace with sub-agents, the replay carries that
agent's own run and not the whole trace. A sub-agent
is handed a task rather than the conversation around
it, so its run is what the call actually read.
The Playground opens in a new tab and the
conversation is handed to it once, so the tab's URL
is not a shareable link to that conversation. Use
**Open in Playground** when you want a link to send
to somebody.
## Seeding from Prompts
From any prompt detail page, click **Test in
Playground** to load the prompt content into the
Playground. Chat prompts load as multi-message
conversations; text prompts load as a single system
message.
## Save as Prompt
Click **Save as Prompt** in the toolbar to save the
current messages as a new prompt. This opens the
prompt creation page with the messages pre-filled.
## Streaming
The **Stream** checkbox (enabled by default)
controls whether responses stream token by token or
arrive as a complete response. Streaming shows a
**Stop** button to end generation early.
---
## Signals
A signal is a label on a span saying something happened in a
conversation: the agent hit a rate limit, retried the same tool
five times, refused a request, or the user gave up.
Oodle detects most signals as your traces arrive. That costs
nothing per span and runs on all of them, so a signal has a
real rate you can chart, alert on and compare between releases,
rather than a sampled estimate.
Open **Agent Observability → Evaluators → Signals**
() to see which
signals your traffic carries.
## What a signal carries
Every signal writes these span attributes:
| Attribute | Meaning |
|---|---|
| `oodle.signal.execution` | The leaf type, such as `environment.rate_limited` |
| `oodle.signal.category` | The family: `interaction`, `execution.failure`, `execution.loop`, `environment` or `agent` |
| `oodle.signal.polarity` | `positive`, `negative` or `neutral` |
| `oodle.signal.source` | Where it came from: detected at ingest, evaluated, or reported by the agent |
| `oodle.signal.reason` | The pattern that matched |
The same values are labels on the `oodle_genai_signal_total`
metric, so a trace filter and a metric query give the same
answer.
Polarity is set when the signal is written, not looked up
later. That matters for a signal like user satisfaction, where
the direction comes from the sign of the value and no table
could say it.
## Signals about the people using your agent
Some signals read the conversation instead of the tool calls.
They say what the person on the other side did, which is the
part no error rate reaches: every span is green in all of
them.
| Signal | The user |
|---|---|
| `interaction.misalignment` | Said the reply was not what they asked for, or could not tell what it meant |
| `interaction.stagnation` | Asked the same thing again without getting an answer |
| `interaction.disengagement` | Broke off the conversation |
| `interaction.refusal` | Was declined by the agent |
Oodle reads these from the turns themselves, so they cost
nothing per span and run on all of them. Each one carries
`oodle.signal.category` of `interaction`, so one filter gives
you the whole group.
The daily Insights report lists them under **User
interactions**, apart from the groups about your tools,
because they are answered by a change to the prompt or the
task rather than by fixing a service.
## Signals your agent reports about itself
Some things only the agent knows. A missing credential looks
like an ordinary clarifying question from the outside, and no
external detector can tell the difference.
Your agent reports one by setting a span attribute. There is no
SDK to install: every framework already emits spans, so this is
a convention rather than a dependency.
```python
span.set_attribute("oodle.signal.agent", "missing_context")
span.set_attribute(
"oodle.signal.agent.detail",
"no billing account on file for this customer",
)
```
`oodle.signal.agent` takes one of four categories:
| Category | Use it when |
|---|---|
| `missing_context` | The agent lacks information or a credential it needs |
| `repeatedly_broken_tool` | A tool keeps failing in a way the agent cannot work around |
| `capability_gap` | The agent was asked for something it cannot do |
| `complete_task_failure` | The agent finished without completing the task |
`oodle.signal.agent.detail` is free text explaining the
specific case, kept to 256 characters. It rides along as the
signal's reason.
Your own category names work too. An unrecognised name is kept
and reported under the general `agent.reported` type, with the
name you sent as the reason, so you can start with the four
above and add your own as you learn what your agent runs into.
Give the agent a tool that sets these attributes, and say in
its prompt when to reach for it. The report then arrives on the
same trace as the conversation it describes, next to the tool
calls and the model responses that led to it.
## Signals from thumbs up and down
Feedback you already send through `POST scores` appears
alongside detected signals, marked as instrumented. It needs no
extra work: it is the same score you were already writing, on
the screen where people look for behaviour.
## Writing your own
Describe a behaviour in plain English and Oodle drafts a
classifier for it, shows you what it matched in your own
traces, and turns it into a signal once you are happy. See
**Agent Observability → Evaluators → Signals**.
A new signal counts from the moment you turn it on. To find out
what it would have caught before that, run a backfill from the
**Backfills** tab: it reads past traffic and reports what the
evaluator would have found, keeping those results separate from
your live scores.
---
## Agents
Oodle Agents allow you to securely connect your private infrastructure to
Oodle. An agent runs inside your network (typically as a Kubernetes
deployment) and establishes an outbound WebSocket connection to Oodle.
This tunnel lets Oodle reach resources that are not publicly
accessible, such as internal APIs, databases, and services behind a firewall.
The agent is open source: [github.com/oodle-ai/oodle-agent](https://github.com/oodle-ai/oodle-agent).
## Use Cases
| Use Case | Description |
|----------|-------------|
| **Private endpoint monitoring** | Run [synthetic checks](/synthetic-monitoring) against internal HTTP endpoints, DNS, TCP, Ping, SSL, and Traceroute targets that are not reachable from the public internet |
| **Private database datasources** | Connect Grafana to Postgres databases inside your VPC without exposing them publicly |
## How It Works
1. You create an agent in the Oodle UI and receive a one-time registration
token
2. You deploy the agent into your Kubernetes cluster using Helm
3. On first connection the agent uses the registration token to obtain a
client certificate via mTLS
4. The agent opens a persistent WebSocket connection to Oodle
5. Oodle routes requests (synthetic checks, database queries) through the
tunnel to your private infrastructure
All traffic is encrypted in transit using mutual TLS (mTLS). The agent
authenticates with a client certificate, and Oodle authenticates via its
server certificate pinned to the Amazon CA.
## Creating an Agent
:::note
Creating an agent requires the **Admin** role. Users with the Editor or
Viewer role cannot create or manage agents.
:::
1. Navigate to **Agents** in the sidebar
2. Click **Create Agent**
3. Enter a descriptive name (e.g. `production-cluster`, `staging-vpc`)
4. Click **Create**
After creation, you will see two commands that must be run in order. **Save
the registration token immediately** — it is single-use and expires
in 24 hours.
### Step 1: Create the Kubernetes Secret
The first command creates a namespace and a Kubernetes secret containing the
agent's one-time registration token:
```bash
kubectl get namespace oodle-monitoring 2>/dev/null || \
kubectl create namespace oodle-monitoring
kubectl create secret generic oodle-agent- \
--namespace oodle-monitoring \
--from-literal=registration-token=
```
### Step 2: Install the Agent via Helm
The second command deploys the agent using the official
[Helm chart](https://github.com/oodle-ai/oodle-agent):
```bash
helm repo add oodle-ai https://oodle-ai.github.io/helm-charts
helm repo update
helm upgrade --install oodle-agent oodle-ai/oodle-agent \
--namespace oodle-monitoring \
--create-namespace \
--wait \
--set oodle.instance= \
--set oodle.agentId= \
--set oodle.agentName= \
--set existingSecret=oodle-agent- \
--set oodle.gatewayUrls=wss:///ws
```
:::tip
Both commands are pre-filled with the correct values in the UI. You can copy
them directly.
:::
:::info
On its first connection, the agent uses the registration token to submit a
Certificate Signing Request (CSR) and receives a signed client certificate.
All subsequent connections use mutual TLS (mTLS) — the registration
token is automatically consumed and no longer needed.
:::
### Step 3: Restrict Allowed Endpoints (Optional)
By default the agent can reach any endpoint in your network. To restrict which
hosts the agent is allowed to connect to, add the `policy` values to the Helm
install command:
```bash
helm repo add oodle-ai https://oodle-ai.github.io/helm-charts
helm repo update
helm upgrade --install oodle-agent oodle-ai/oodle-agent \
--namespace oodle-monitoring \
# ... same flags as above ...
--set policy.enable_access_restrictions=true \
--set "policy.allowed_endpoints[0]=my-postgres.internal:5432" \
--set "policy.allowed_endpoints[1]=*.prod.internal:443" \
--set "policy.allowed_endpoints[2]=10.0.1.50:8080"
```
Supported endpoint patterns:
| Pattern | Description |
|---------|-------------|
| `host:port` | Exact match (e.g. `my-db.internal:5432`) |
| `host` | Any port on that host |
| `*.example.com:443` | Wildcard subdomain with specific port |
| `*:5432` | Any host on a specific port |
The policy is enforced for **all** protocols: HTTP, Postgres, TCP, Ping,
DNS, SSL, and Traceroute.
You can also restrict which Kubernetes namespaces and resources the agent can
read:
```bash
--set "policy.kubernetes.allowed_namespaces[0]=production" \
--set "policy.kubernetes.allowed_namespaces[1]=monitoring" \
--set "policy.kubernetes.deny_resources[0]=secrets"
```
To update the policy after installation, run `helm upgrade` with the new
values, or edit the `oodle-agent-policy` ConfigMap directly and restart the
agent pod.
## Viewing Agent Status
The Agents list page displays all registered agents with:
- **Name**: The agent name and its unique ID
- **Status**: Current connection status (`ACTIVE` or `DISCONNECTED`)
- **Created**: When the agent was registered
- **Last Heartbeat**: The most recent heartbeat received from the agent
Click on any agent row to open the detail drawer.
## Agent Detail Drawer
### Overview Tab
Shows creation time, last heartbeat, capabilities, and an embedded health
dashboard with real-time metrics for the agent.
### Datasources Tab
Manage Postgres datasources that are routed through this agent. Each
datasource creates a corresponding Grafana Postgres datasource that
tunnels queries through the agent to a private database.
#### Adding a Postgres Datasource
1. Open the agent detail drawer and go to the **Datasources** tab
2. Click **Add Datasource**
3. Fill in the connection details:
- **Datasource Name**: A human-readable name
- **Host**: The private Postgres host and port
(e.g. `my-db.internal:5432`)
- **Database**: The database name
- **User / Password**: Postgres credentials
- **SSL Mode**: `disable`, `require`, `verify-ca`, or `verify-full`
- **TLS Certificates**: (Optional) CA cert, client cert, and client
key for mTLS
4. Click **Create**
Once created, a Grafana Postgres datasource is automatically provisioned.
You can click **Explore** to query the database directly from Grafana, or
use **Save & Test** to verify connectivity.
### Uninstall Tab
Provides step-by-step commands to cleanly remove the agent:
1. **Uninstall the Helm release**:
```bash
helm uninstall oodle-agent \
--namespace oodle-monitoring
```
2. **Delete the Kubernetes secret**:
```bash
kubectl delete secret oodle-agent- \
--namespace oodle-monitoring
```
3. **Delete the agent from Oodle** using the **Delete Agent** button
:::caution
Deleting an agent disconnects all datasources and synthetic monitors
routed through it.
:::
## Best Practices
### Naming Conventions
Use names that identify the environment and cluster, e.g.:
- `prod-us-east-1`
- `staging-eks`
- `dev-local`
### High Availability
The agent maintains multiple connections for redundancy. If one connection
becomes unavailable, traffic is automatically routed through another.
### Network Requirements
The agent only requires **outbound** access on port 443 (WebSocket over
TLS). No inbound firewall rules are needed.
---
## AI Canvas
AI Canvas is a full-page, conversational AI assistant built into Oodle.
It can query your metrics, logs, and traces, create Grafana dashboards
and alerts, navigate the UI on your behalf, and answer questions about
your infrastructure — all through natural language.
## Accessing AI Canvas
There are two ways to interact with the AI assistant:
### Full-Page Canvas
Hover over **Ask Nolly** in the sidebar, then select **AI Canvas** to open
the dedicated full-page experience. You can also navigate directly to
`/ai-canvas`. The full-page canvas includes a chat history sidebar on the
left so you can revisit previous conversations.
### Sidebar Assistant
Click **Ask Nolly** (or press Cmd + I) from any
page to open the sidebar panel. The sidebar overlays the current page,
giving you quick access to the AI while keeping your current context
visible.
## Capabilities
| Capability | Description |
|------------|-------------|
| **Metrics** | Find metrics, query with PromQL, and visualize results inline |
| **Logs** | Search and summarize logs, identify error patterns |
| **Traces** | Query traces and analyze latency or error patterns |
| **Dashboards** | Create and update Grafana dashboards from a prompt |
| **Alerts** | Create, update, and explain alert monitors |
| **Anomalies** | Query detected anomalies across your infrastructure |
| **Navigation** | Navigate to pages, adjust time ranges, and fill forms |
| **Integrations** | Answer setup questions using Oodle documentation |
## Home Page
When you open AI Canvas without an active conversation,
the home page shows contextual information below the chat
input to help you get started:
- **Recent Dashboards** — your most-visited Grafana
dashboards from the past week, sorted by frequency.
If you have fewer than ten personal dashboards, the
list is filled with popular dashboards across your
organization. Click any dashboard to open it directly.
- **Anomalies** — the top anomalies detected across
your infrastructure in the last 24 hours, sorted by
severity and recency. Click any anomaly to jump to
the anomalies page with that item expanded.
Both section headers link to their respective full pages
(Dashboards and Anomalies).
## Using AI Canvas
### Starting a Conversation
Type your question in the input box at the bottom and press
Enter. You can also click one of the suggested
prompts to get started.
Example prompts:
- "Create dashboard for high CPU usage by container"
- "Search error logs for last 15 min"
- "Create an alert for CPU throttling"
- "Summarize logs for last 15 mins"
- "How do I send k8s logs to Oodle?"
### Tool Calls and Inline Results
The AI assistant uses tools to interact with your data. As it works, you
will see expandable tool call cards showing what the assistant is doing —
for example, finding metrics, running PromQL queries, or saving a
dashboard. Query results such as charts and tables are rendered inline in
the conversation.
### Auto-Approve Actions
Some actions (like creating an alert or navigating to a page) require
approval before executing. Enable the **Auto-approve actions** checkbox
at the bottom of the chat to let the assistant execute these actions
without prompting.
### Following Up
After the assistant responds, you can ask follow-up questions in the
same conversation. For example, after creating a dashboard you might ask
the assistant to add more panels or adjust the time range.
## Chat History
AI Canvas persists your conversations. The **Chat History** sidebar on
the left lists all previous sessions with their title, age, and message
count. Click any entry to reload that conversation and continue where you
left off. Click **Start New Chat** to begin a fresh session.
## Example Workflows
### Create a Dashboard
> "Create a health dashboard for the frontend service"
The assistant will:
1. Search for relevant metrics in your environment
2. Run PromQL queries to verify the metrics return data
3. Build a Grafana dashboard with appropriate panels
4. Save the dashboard and provide a link to open it
### Debug an Alert
> "Why is my CPU throttling alert firing?"
The assistant will:
1. Look up the alert definition and current status
2. Query the underlying metrics to identify the source
3. Check logs and traces for correlated errors
4. Summarize findings and suggest next steps
### Search Logs
> "Show me error logs from the payment service in the last hour"
The assistant will:
1. Identify the appropriate log index
2. Run a filtered query for error-level logs
3. Summarize the top patterns and provide representative log entries
---
## Claude
Claude ships with built-in OpenTelemetry support across
all of its coding surfaces: the Claude Code CLI, the
desktop app, and Cowork. Once enabled, Oodle collects
metrics and event logs and turns them into use-case
dashboards covering adoption,
cost and ROI, engineering impact, tool behavior, and
efficiency across your organization.
## Getting Started
### 1. Enable Telemetry
The fastest way is to use the integration tile in the
Oodle UI:
1. Navigate to **Settings → Integrations**
2. Open the **AI Observability** section
3. Click the **Claude Observability** tile
4. Select an API key and follow the steps shown
The tile generates a ready-to-use configuration and lets
you choose how to distribute it: to a single developer,
to everyone working in a repository, or to your whole
organization. Replace ``, ``, and
`` in the snippets below with values from the
integration tile.
#### Individual
For a single developer, export the variables directly in
your shell before running `claude`:
```bash
export CLAUDE_CODE_ENABLE_TELEMETRY=1
export OTEL_METRICS_EXPORTER=otlp
export OTEL_LOGS_EXPORTER=otlp
export OTEL_TRACES_EXPORTER=otlp
export CLAUDE_CODE_ENHANCED_TELEMETRY_BETA=1
export OTEL_EXPORTER_OTLP_PROTOCOL=http/protobuf
export OTEL_EXPORTER_OTLP_ENDPOINT=https://
export OTEL_EXPORTER_OTLP_HEADERS="X-API-KEY=, X-OODLE-INSTANCE="
export OTEL_EXPORTER_OTLP_METRICS_TEMPORALITY_PREFERENCE=delta
export OTEL_LOG_USER_PROMPTS=1
export OTEL_LOG_TOOL_DETAILS=1
# Optional: resource attributes for team/repo breakdowns
export OTEL_RESOURCE_ATTRIBUTES="git.repository.name=my-repo,org.team.name=platform,org.department=engineering,org.cost_center=eng-123"
```
:::tip
For faster feedback during initial setup, lower the
export intervals:
```bash
export OTEL_METRIC_EXPORT_INTERVAL=10000
export OTEL_LOGS_EXPORT_INTERVAL=5000
```
:::
#### Repository
To share telemetry settings with everyone working in a
repository, commit them to `.claude/settings.json` in the
project. Claude Code applies them for anyone who works in
the repo, with no per-developer setup required:
```json
{
"env": {
"CLAUDE_CODE_ENABLE_TELEMETRY": "1",
"OTEL_METRICS_EXPORTER": "otlp",
"OTEL_LOGS_EXPORTER": "otlp",
"OTEL_TRACES_EXPORTER": "otlp",
"CLAUDE_CODE_ENHANCED_TELEMETRY_BETA": "1",
"OTEL_EXPORTER_OTLP_PROTOCOL": "http/protobuf",
"OTEL_EXPORTER_OTLP_ENDPOINT": "https://",
"OTEL_EXPORTER_OTLP_HEADERS": "X-API-KEY=, X-OODLE-INSTANCE=",
"OTEL_EXPORTER_OTLP_METRICS_TEMPORALITY_PREFERENCE": "delta",
"OTEL_LOG_USER_PROMPTS": "1",
"OTEL_LOG_TOOL_DETAILS": "1",
"OTEL_RESOURCE_ATTRIBUTES": "git.repository.name=my-repo,org.team.name=platform,org.department=engineering,org.cost_center=eng-123"
}
}
```
#### Server-managed (organization-wide)
To distribute settings across your whole organization
without device management (MDM), use the
[Claude Code admin console](https://claude.ai/admin-settings/claude-code).
Paste the same `env` configuration into **Admin Settings →
Claude Code → Managed settings**. Clients fetch it when
users authenticate and poll for updates hourly.
- Requires a Claude for Teams or Enterprise plan, and the
Owner or Primary Owner role to edit.
- OpenTelemetry settings take effect after a full Claude
Code restart.
See the
[server-managed settings documentation](https://code.claude.com/docs/en/server-managed-settings)
for delivery, caching, and precedence details.
### 2. Verify Data
Once telemetry starts flowing (metrics export every
60 s, events every 5 s by default), navigate to
**AI Cost Management → Claude** in the Oodle
sidebar.
## Dashboards
The Claude analysis page is organized around the
questions engineering leadership asks of a coding agent.
Each tab embeds a dashboard that leads with headline
numbers, followed by trends and ranked breakdowns.
### Usage and Adoption
Is the team using it?
| Panel | Description |
|-------|-------------|
| **Active Users** | Distinct engineers who ran Claude |
| **Sessions** | Sessions started, plus sessions per active user |
| **Active Time** | CLI processing time vs user interaction time |
| **Surface / Model / Terminal Mix** | Where and how sessions run (CLI, desktop, Cowork; model share; editor terminals) |
| **Version Adoption** | Activity by CLI version, to track upgrade velocity |
| **Top Users** | Engineers ranked by sessions and active time |
### Cost and ROI
What are we paying, and what do we get for it?
| Panel | Description |
|-------|-------------|
| **Total Spend** | Estimated USD spend, the headline budget number |
| **Cost per Active User** | Average spend per engineer, for seat-cost modeling |
| **Cost per Commit / Cost per PR** | Unit economics of shipped output |
| **Sessions Producing Outcomes** | Share of sessions that led to a commit or PR |
| **Top Spenders** | Users and sessions ranked by spend |
| **Spend Breakdown** | Spend by model, query source, agent, and skill |
| **Team and Repository Breakdown** | Spend by `org.team.name` and `git.repository.name` resource attributes |
### Engineering Impact
What did it produce?
| Panel | Description |
|-------|-------------|
| **Lines Added / Removed** | Code throughput from accepted suggestions |
| **Commits and Pull Requests** | Shipped output over time |
| **Edit Accept Rate** | Share of suggested edits engineers accepted, with health thresholds |
| **Avg Lines per Session** | Output volume per session |
| **Output Leaderboards** | Top users by lines added, commits, and PRs |
### Tools and Automation
Is the agent working well?
| Panel | Description |
|-------|-------------|
| **Tool Calls** | Invocation volume, distinct tools, and per-tool trends |
| **Tool Duration** | Average execution time by tool |
| **Result Size** | Bytes returned per tool, the main driver of context growth and cost |
| **Bash CLI Breakdown** | Specific commands run through Bash, by count and output size |
| **MCP Servers and Tools** | External integration usage and latency |
| **Skills** | Invocations of codified team workflows |
### Efficiency
Is spend being used well?
| Panel | Description |
|-------|-------------|
| **Cache Hit Rate** | Share of context served from cache, with health thresholds |
| **Token Split** | Input vs cache read vs cache creation volume |
| **Ghost Cost Leaderboard** | Sessions ranked by cache re-priming relative to new input |
| **Cost per Line of Code** | Output per dollar, overall and by model |
| **Prompt Length Analysis** | Prompt size distribution and cost per prompt |
## Sessions
The Sessions tab shows individual Claude sessions:
| Column | Description |
|--------|-------------|
| **Start Time** | When the session began |
| **User** | Email of the developer |
| **Model** | Primary model used |
| **Prompts** | Number of user prompts |
| **Duration** | Wall-clock duration |
| **Cost** | Total estimated cost |
| **Tools** | Number of tool calls |
| **Tokens** | Total tokens (input + output) |
| **Errors** | Count of errors |
Click any row to open a **Session Detail** drawer
showing a turn-by-turn timeline of every event.
### Session Detail Drawer
The drawer displays:
- **Session metadata**: user, model, app version,
terminal type
- **Aggregated stats**: total cost, tokens, tool
calls, errors, duration
- **Turn-by-turn timeline**: each turn is collapsible
and shows the user prompt followed by individual
events (API requests, tool calls, decisions). Every
event row is expandable to reveal the full raw JSON
payload.
## What Gets Collected
### Metrics
Claude exports the following as OpenTelemetry
metrics (delta temporality):
| Metric | Key Labels | Description |
|--------|------------|-------------|
| `claude_code_token_usage` | `type`, `model`, `user_email` | Token count by type (input, output, cacheRead, cacheCreation) |
| `claude_code_cost_usage` | `model`, `user_email` | Estimated cost in USD |
| `claude_code_session_count` | `user_email` | Sessions started |
| `claude_code_active_time_total` | `type` | User and CLI active time in seconds |
| `claude_code_lines_of_code_count` | `type` | Lines added / removed |
| `claude_code_commit_count` | `user_email` | Commits created |
| `claude_code_pull_request_count` | `user_email` | Pull requests created |
| `claude_code_code_edit_tool_decision` | `decision` | Edit accept / reject decisions |
All metrics also carry `session_id`, `service_version`,
`terminal_type`, and `job` (the surface: CLI, desktop app,
or Cowork). Tool call counts, durations, and result sizes
are derived from the `claude_code.tool_result` events
below and power the Tools and Automation dashboard.
### Events (Logs)
Events are exported via the OpenTelemetry logs
protocol. Each event has a `log.attributes.event_type`
field:
| Event Type | Key Attributes |
|------------|----------------|
| `claude_code.user_prompt` | Prompt text (opt-in), character count |
| `claude_code.api_request` | Model, cost, input/output tokens, cache tokens, duration |
| `claude_code.tool_result` | Tool name, success, duration |
| `claude_code.tool_use_decision` | Decision (accept/reject), source |
Events are grouped by `session_id` to reconstruct the
turn-by-turn timeline on the Sessions tab.
## Multi-team Organization Support
Organizations with multiple teams or departments can add custom
[resource attributes](https://code.claude.com/docs/en/monitoring-usage#multi-team-organization-support)
to segment telemetry by repository, team, department, or cost center.
### Recommended Attributes
| Attribute | Purpose | Example |
|-----------|---------|---------|
| `git.repository.name` | Per-repository breakdowns | `my-service` |
| `org.team.name` | Team-level filtering | `platform` |
| `org.department` | Department or business unit | `engineering` |
| `org.cost_center` | Charge-back / cost allocation | `eng-123` |
### Configuration
Set `OTEL_RESOURCE_ATTRIBUTES` as a comma-separated list of
key=value pairs:
```bash
export OTEL_RESOURCE_ATTRIBUTES="git.repository.name=my-repo,org.team.name=platform,org.department=engineering,org.cost_center=eng-123"
```
Or add it to your managed settings file (`.claude/settings.json`):
```json
{
"env": {
"OTEL_RESOURCE_ATTRIBUTES": "git.repository.name=my-repo,org.team.name=platform,org.department=engineering,org.cost_center=eng-123"
}
}
```
:::warning Formatting requirements
Values must **not** contain spaces. Use underscores, camelCase,
or percent-encoding for special characters. See the
[Claude Code docs](https://code.claude.com/docs/en/monitoring-usage#multi-team-organization-support)
for the full specification.
:::
Once set, these attributes appear on all metrics and events,
allowing you to:
- Filter dashboards by team or department
- Track costs per cost center
- Create per-repository usage reports
- Set up team-specific alerts
## Further Reading
- [Claude Code Monitoring Documentation](https://code.claude.com/docs/en/monitoring-usage)
- [OpenTelemetry Integration](/integrations/logs/otel)
- [Claude Code MCP Integration](/integrations/mcp/claude)
---
## OpenAI Codex
OpenAI Codex has native OpenTelemetry support. Once
enabled, Oodle collects metrics and event logs and
turns them into use-case dashboards covering adoption,
token consumption, tool behavior, and performance and
reliability across your organization.
## Getting Started
### 1. Enable Telemetry
The fastest way is to use the integration tile in the
Oodle UI:
1. Navigate to **Settings → Integrations**
2. Open the **AI Observability** section
3. Click the **Codex Observability** tile
4. Select an API key and follow the steps shown
Alternatively, add the following to your Codex
configuration file (`~/.codex/config.toml`):
```toml
#:schema https://developers.openai.com/codex/config-schema.json
[otel]
environment = "production"
log_user_prompt = true
exporter = { otlp-http = {
endpoint = "https:///ingest/otel/v1/logs",
protocol = "binary",
headers = {
"X-API-KEY" = "",
"X-OODLE-INSTANCE" = "",
},
}}
metrics_exporter = { otlp-http = {
endpoint = "https:///v2/otlp/metrics/",
protocol = "binary",
headers = {
"X-API-KEY" = "",
"X-OODLE-INSTANCE" = "",
},
}}
```
Replace ``, ``, and
`` with values from the integration tile.
:::tip
The integration tile in the Oodle UI generates a
ready-to-copy `config.toml` with the correct
endpoints and API key pre-filled.
:::
#### Alternative: Environment Variables
For quick testing you can export the standard
OpenTelemetry variables directly in your shell:
```bash
export OTEL_EXPORTER_OTLP_PROTOCOL=http/protobuf
export OTEL_EXPORTER_OTLP_METRICS_ENDPOINT=https:///v2/otlp/metrics/
export OTEL_EXPORTER_OTLP_LOGS_ENDPOINT=https:///ingest/otel/v1/logs
export OTEL_EXPORTER_OTLP_HEADERS="X-API-KEY=, X-OODLE-INSTANCE="
export OTEL_LOG_USER_PROMPTS=1
export OTEL_METRIC_EXPORT_INTERVAL=10000
export OTEL_LOGS_EXPORT_INTERVAL=5000
```
### 2. Roll Out to Your Team
Commit the `config.toml` above to your dotfiles
repository or place it in each developer's
`~/.codex/` directory via your configuration
management tool.
### 3. Verify Data
Once telemetry starts flowing, navigate to
**AI Cost Management → Codex** in the Oodle sidebar.
## Dashboards
The Codex analysis page is organized around the
questions engineering leadership asks of a coding
agent. Each tab embeds a dashboard that leads with
headline numbers, followed by trends and ranked
breakdowns.
### Usage and Adoption
Is the team using it?
| Panel | Description |
|-------|-------------|
| **Active Users** | Distinct engineers who ran Codex |
| **Conversations** | Distinct Codex conversations, plus conversations per active user |
| **Prompts** | User prompts submitted |
| **Activity Trends** | Active users and conversations over time |
| **Surface / Model / Version Mix** | Where activity runs: the IDE/app backend vs the terminal CLI, model share, and version adoption |
| **Top Users** | Engineers ranked by prompts and tokens |
### Token Consumption
Token volume is the primary driver of Codex spend, so
this tab is the budget view.
| Panel | Description |
|-------|-------------|
| **Total Tokens** | Aggregate token usage, the headline consumption number |
| **Tokens per Active User / per Conversation** | Unit consumption for capacity and seat modeling |
| **Cached Input Rate** | Share of input context served from cache, with health thresholds. Higher is cheaper |
| **Token Breakdown** | Usage by token type (input, output, cached, reasoning), model, surface, and version |
| **Top Users and Sessions** | Highest-consumption engineers and conversations |
| **Prompt Economics** | Average prompt size and total tokens consumed per prompt |
Use the **Token Type** dashboard filter to isolate a
category (input, output, cached_input,
reasoning_output).
### Tools and Automation
Is the agent working well?
| Panel | Description |
|-------|-------------|
| **Tool Calls** | Invocation volume and distinct tools used |
| **Tool Success Rate** | Share of tool calls that succeeded, with health thresholds |
| **Avg Tool Duration** | Mean execution time, overall and per tool |
| **Per-tool Trends and Leaderboards** | Calls, failures, and latency ranked by tool |
| **MCP Servers** | External integration usage grouped by MCP server |
### Performance and Reliability
Codex exports rich latency telemetry, so this tab
answers how fast and stable the agent feels.
| Panel | Description |
|-------|-------------|
| **Avg Time to First Token** | How long users wait before Codex starts responding, with health thresholds |
| **Avg Turn Duration** | End-to-end latency per turn |
| **WebSocket Success Rate** | API transport health, with health thresholds |
| **Latency Trends** | Time to first token / first message and turn duration over time |
| **Startup Latency** | Prewarm and shell snapshot times from launch to a usable session |
| **Per-model Latency** | Time to first token and turn duration ranked by model |
This tab is built on Codex's native metrics, which
carry model, originator, and version dimensions; use
its dashboard filters to slice by those.
## Sessions
The Sessions tab shows individual Codex sessions:
| Column | Description |
|--------|-------------|
| **Start Time** | When the session began |
| **Session** | Codex conversation ID |
| **User** | Email of the developer |
| **Surface** | Where Codex ran: `app-server` (IDE/extension) or `cli` (terminal) |
| **Duration** | Wall-clock duration |
| **Tokens** | Total tokens (input + output + cached) |
Click any row to open a **Session Detail** drawer
showing a turn-by-turn timeline of every event.
### Session Detail Drawer
The drawer displays:
- **Session metadata**: user, model, app version
- **Aggregated stats**: tokens, tool calls, errors,
duration (only populated fields are shown)
- **Turn-by-turn timeline**: each turn is collapsible
and shows individual events (SSE events, WebSocket
events, tool calls). Every event row is expandable
to reveal the full raw JSON payload.
## What Gets Collected
### Metrics
Codex exports the following as OpenTelemetry metrics
(delta temporality):
| Metric | Extra Labels | Description |
|--------|--------------|-------------|
| `codex_turn_token_usage` | `token_type` | Token count by type (input, output, cached, reasoning, total) |
| `codex_thread_started` | none | Conversations started |
| `codex_turn_tool_call` | none | Tool invocations per turn |
| `codex_websocket_request` | `success` | WebSocket API requests |
| `codex_turn_e2e_duration_ms` | none | End-to-end turn latency |
| `codex_turn_ttft_duration_ms` | none | Time to first token |
| `codex_turn_ttfm_duration_ms` | none | Time to first message |
| `codex_websocket_event_duration_ms` | none | WebSocket event processing time |
| `codex_startup_prewarm_duration_ms` | none | Startup prewarm latency |
| `codex_shell_snapshot_duration_ms` | none | Shell snapshot capture latency |
| `codex_turn_network_proxy` | none | Turns routed through the network proxy |
All native metrics carry `model`, `originator`, and
`app_version`. These power the Performance and
Reliability dashboard.
Oodle also derives session-level metrics from the
event logs below: `oodle_logs_codex_token_usage`
(tokens keyed by conversation, user, model, surface,
version, and token type), `oodle_logs_codex_tool_count`
and `oodle_logs_codex_tool_duration_ms` (per-tool
activity with MCP server and success dimensions), and
`oodle_logs_codex_prompt_length_bytes` (prompt sizes).
These power the Usage and Adoption, Token Consumption,
and Tools and Automation dashboards plus the Sessions
tab, and they honor the sidebar User and Surface
filters.
### Events (Logs)
Events are exported via the OpenTelemetry logs
protocol. Each event has an
`attributes.event.name` field:
| Event Type | Key Attributes |
|------------|----------------|
| `codex.conversation_starts` | Conversation ID, model, user email |
| `codex.sse_event` | Model, event kind, token counts, duration |
| `codex.websocket_event` | Model, event kind, duration, success |
| `codex.websocket_request` | Model, duration, success |
| `codex.websocket_connect` | Model, duration |
| `codex.user_prompt` | Prompt text, prompt length |
| `codex.tool_decision` | Tool name, decision, source |
| `codex.tool_result` | Tool name, success, duration, error |
Events are grouped by `conversation.id` to reconstruct
the turn-by-turn timeline on the Sessions tab.
## Further Reading
- [Codex Observability Documentation](https://developers.openai.com/codex/config-advanced#observability-and-telemetry)
- [OpenTelemetry Integration](/integrations/logs/otel)
---
## Factory Droid
Factory's Droid CLI has native OpenTelemetry support.
Once enabled, Oodle collects metrics so you can track
adoption, engineering impact, tool activity, and the
repositories Droid works in across your organization.
## Getting Started
### 1. Enable Telemetry
The fastest way is to use the integration tile in the
Oodle UI:
1. Navigate to **Settings → Integrations**
2. Open the **AI Observability** section
3. Click the **Factory Droid** tile
4. Select an API key and follow the steps shown
Alternatively, set two environment variables wherever
Droid runs (shell profile, CI environment, or
MDM-managed configuration):
```bash
# Droid appends /v1/metrics to the endpoint
export OTEL_TELEMETRY_ENDPOINT=https://
export OTEL_TELEMETRY_HEADERS="X-API-KEY=,X-OODLE-INSTANCE="
```
Replace ``, ``, and
`` with values from the integration tile.
Metrics export every 60 seconds while sessions are
active, and flow to both Factory and Oodle
simultaneously. A failure to reach Oodle never affects
Droid itself.
### 2. Roll Out to Your Team
Add the two environment variables to your dotfiles
repository, developer machine images, or configuration
management tool.
### 3. Verify Data
Once telemetry starts flowing, navigate to
**AI Cost Management → Factory Droid** in the Oodle
sidebar.
## Analysis Page
The Factory Droid page is organized around the
questions engineering leadership asks, with a tab per
use case.
### Adoption
Is Factory getting adopted, and by whom?
| Panel | Description |
|-------|-------------|
| **Active Users / Sessions** | Distinct users and sessions with Droid activity |
| **Logins and Slash Commands** | Engagement signals over the selected range |
| **Activity by Model** | Which models drive Droid usage |
| **Model Mix / Autonomy Mode / Environment** | How Droid is run: model split, autonomy levels, interactive vs other environments |
| **Version Adoption** | How quickly the team upgrades the Droid CLI |
| **Top Users by Activity** | The power users driving adoption, sorted and paginated |
### Engineering Impact
What is Droid actually producing?
| Panel | Description |
|-------|-------------|
| **Files Modified / Lines Modified** | Code change volume attributable to Droid |
| **Commits and PRs Created** | How much of Droid's work ships |
| **Files Read vs Files Modified** | Exploration vs change balance |
| **By Extension** | Which parts of the stack Droid touches most |
| **Per-User Leaderboards** | Lines, commits, and PRs by developer |
### Tools & Automation
How does Droid work, and where does it struggle?
| Panel | Description |
|-------|-------------|
| **Tool Invocations and Success Rate** | Overall tool call volume and health |
| **Execution Time (p50 / p95)** | Tool latency trends and per-tool p95 |
| **Tool Failures** | Which tools fail most |
| **MCP Tools / Skills / Hooks** | Automation surface usage: MCP calls by server, skill invocations, hook activity |
| **Installed Skills Inventory** | Which skills are installed, and where |
### Repo Insights
Where across your codebase estate does Droid operate,
and how healthy are those repos? Built from the
`droid_repo_metadata` metric that Droid emits for every
session:
| Panel | Description |
|-------|-------------|
| **Repos Touched / Sessions per Repo** | Coverage of your repository estate |
| **Repos with Tests / CI / Linters / Docs** | Guardrail coverage of the repos Droid works in |
| **Primary Language Distribution** | Language mix of touched repos |
| **Repo Profile** | Per-repo size, languages, contributors, and commit velocity |
| **Repo Guardrails** | Test frameworks, CI/CD, linters, security, and observability tooling per repo |
:::note
Repositories are identified by a privacy-preserving
hash of the remote URL, so repository names and URLs
never leave the developer's machine.
:::
### Sessions
The Sessions tab lists individual Droid sessions built
entirely from metrics:
| Column | Description |
|--------|-------------|
| **Start Time** | When the session began |
| **Session** | Droid session ID |
| **User** | Email of the developer |
| **Duration** | Wall-clock duration |
| **# Tools** | Tool invocations in the session |
| **Files Read** | Files Droid read |
| **Commits** | Commits created |
| **# PRs** | Pull requests created |
## What Gets Collected
Droid exports the following OpenTelemetry metrics with
delta temporality. Every data point carries
`user.email`, `user.id`, `session.id`, `model_id`,
`organization.id`, and `service.version`, so all views
can be filtered by user, model, and version.
| Metric | Extra Labels | Description |
|--------|--------------|-------------|
| `droid.tool.invocations` | `tool_name`, `tool_category`, `tool_runtime`, `tool_succeeded`, `environment_type`, `session_autonomy_mode` | Tool invocations |
| `droid.tool.execution_time` | same as invocations | Tool execution time histogram (ms) |
| `droid.code.files_read` | `file_extension` | Files read |
| `droid.code.files_modified` | `file_extension` | Files modified |
| `droid.code.lines_modified` | | Lines of code modified |
| `droid.git.commits` | | Commits created |
| `droid.git.pull_requests` | | Pull requests created |
| `droid.mcp.tool_invocations` | `mcp_server`, `tool_name` | MCP tool invocations |
| `droid.skill.invocations` | `skill_name` | Skill invocations |
| `droid.hook.invocations` | | Hook invocations |
| `droid.slash_command.invocations` | `slash_command_name` | Slash command usage |
| `droid.auth.login_success` | `auth_login_method` | Successful logins |
| `droid.repo.metadata` | `repo_*` profile labels | Per-session repository profile snapshot (language, size, tests, CI, linters, contributors, commit velocity) |
## Further Reading
- [Factory Telemetry Documentation](https://docs.factory.ai/enterprise/telemetry-export)
- [OpenTelemetry Integration](/integrations/logs/otel)
---
## AI Cost Management
Oodle's AI Cost Management gives engineering teams
visibility into how AI coding agents are used across
the organization. Track token usage, costs, session
activity, tool calls, and more, all in one place.
## Why Monitor AI Agents?
AI coding agents are powerful but opaque. Without
observability you cannot answer questions like:
- **How much are we spending** on AI-assisted coding?
- **Which models** are being used, and by whom?
- **How many sessions** run per day or week?
- **Are tool calls succeeding**, or are agents hitting
errors?
- **What prompts** are developers sending to the agent?
Oodle collects telemetry exported by AI agents via
OpenTelemetry and surfaces it through a dedicated
analysis page with pre-built dashboards and a
session-level event timeline.
## Supported Agents
| Agent | Metrics | Events / Logs | Status |
|-------|---------|---------------|--------|
| [**Claude**](./claude-code) | Token usage, cost, sessions, active time, lines of code, commits, PRs | User prompts, API requests, tool results, tool decisions | GA |
| [**OpenAI Codex**](./codex) | Token usage, conversations, tool calls, WebSocket requests, performance timings | SSE events, WebSocket events, conversation starts, tool decisions, tool results | GA |
| [**Factory Droid**](./factory) | Tool invocations, files read/modified, lines of code, commits, PRs, skills, repo profiles | Metrics only | GA |
## Getting Started
1. Navigate to **Settings → Integrations**
2. Open the **AI Observability** section
3. Click the tile for the agent you want to set up
4. Select an API key and follow the steps shown
See the agent-specific pages for detailed setup
instructions:
- [Claude Setup](./claude-code#getting-started)
- [OpenAI Codex Setup](./codex#getting-started)
- [Factory Droid Setup](./factory#getting-started)
## Analysis Page
The AI Agent Analysis page is available in the sidebar
under **AI Cost Management**. It has a set of dashboard
tabs tailored to each agent, plus a **Sessions** tab.
Use the **agent dropdown** at the top of the sidebar to
switch between Claude, Codex, and Factory Droid.
### Dashboard Tabs
Each agent gets pre-built dashboards organized around
the questions leadership asks: adoption, cost and ROI,
engineering impact, and tool activity. For example,
Claude has Usage and Adoption, Cost and ROI,
Engineering Impact, Tools and Automation, and Efficiency
tabs; see each agent's page for its tab set.
### Sessions Tab
Shows a table of individual sessions with key stats.
Click any row to open a **Session Detail** drawer
showing a turn-by-turn timeline of every event.
### Sidebar Filters
A sidebar on the left lets you filter data by:
- **Time Range**: Grafana-style time range picker
- **Event Type**: filter events by type
(sessions tab only)
- **Status**: OK or HasError (sessions tab only)
- **Model**: filter by LLM model
- **User**: filter by developer email
- **App Version**: filter by agent version
- **Terminal**: filter by terminal type
## Best Practices
- **Start with a single user** to verify telemetry is
flowing before rolling out org-wide.
- **Enable prompt logging** to get full prompt text in
the event timeline, which is useful for understanding
usage patterns.
- **Set up alerts** on cost or token metrics to catch
unexpected spending spikes.
- **Use sidebar filters** to drill down by user or
model when investigating specific sessions.
---
## Skills & Runbooks
Skills and runbooks add domain expertise to Oodle's AI assistant. They
capture your team's debugging workflows, investigation playbooks, and
operational procedures so the AI can follow them automatically.
When you ask a question in [AI Canvas](/ai-canvas) or through
[MCP](/integrations/mcp), Oodle detects relevant skills and applies
them to guide its investigation. You can also attach skills directly
to [monitors](/alerts/monitors) so the AI follows a specific runbook
when that alert fires.
{/*
*/}
## Concepts
### Skills
Skills are structured investigation workflows. Each skill has a
**name**, a **description** that tells the AI when to use it, and
a set of **steps** written in natural language - similar to an
`AGENTS.md` file. The AI follows these steps when the skill is
triggered.
### Runbooks
Runbooks are attached to specific monitors and guide the AI when
that alert fires. Unlike skills, runbooks are **created
automatically** - Oodle learns from how your team investigates
incidents and generates a runbook to handle future instances
of the same alert. You can review, edit, or disable
auto-generated runbooks at any time.
## Creating a Skill
1. In the sidebar, go to **Ask Nolly > Settings** and open the **Skills** tab.
2. Click **+ New Skill** in the top-right corner.
3. Fill in the following fields:
| Field | Description |
|-------|-------------|
| **Name** | A short identifier for the skill (up to 100 characters). |
| **Description** | Tells the AI when to use this skill. Be specific - for example, *"Use when the user asks whether an issue affects one customer or multiple customers and wants cross-cluster comparison."* |
| **Steps** | The investigation procedure the AI should follow. Supports Markdown. Use the **Write**, **Preview**, and **Upload file** tabs to author the content. |
4. Click **Save**.
### Writing Effective Steps
Write steps the way you would brief a new on-call engineer. Include:
- What to check first and in what order.
- Which metrics, logs, or traces to query.
- How to interpret the results.
- What output format to produce (verdict, comparison table,
confidence level).
**Example - API query service fan-out investigation:**
> **Name:** `api-query-fanout-investigation`
>
> **Description:** When investigating api-server query errors,
> look for massive fan-out across shards and HTTP 400 error
> responses returning unexpected content.
```markdown
When api-server query errors spike, investigate the
query-worker container logs.
1. Look for 'StatusCode: 0, canceled, context canceled'
warnings - this indicates a massive fan-out across
shards (e.g., data-partition-{0-9}) where queries are
being canceled due to timeouts.
2. Check for 'StatusCode: 400' errors returning HTML/XML
instead of expected JSON. This means an upstream
dependency is returning an error page, causing
deserialization failures in the query path.
3. Verify if the failing queries are missing required
parameters like 'start' or 'end' timestamps. Missing
parameters cause the upstream to reject the request
with a 400.
4. If fan-out is confirmed, check whether the query scope
is too broad (too many shards) and whether adding
tighter label filters would reduce the blast radius.
```
## Attaching Skills to Monitors
You can attach a skill or runbook to a monitor so the AI
references it when investigating that alert:
1. Open the monitor you want to configure.
2. In the monitor settings, select a skill under the
**Runbook** field.
3. Save the monitor.
When this monitor fires and you ask the AI about it, the
attached runbook is loaded automatically.
## Skill Sources
Skills can come from two sources, visible in the **Source**
filter on the Skills & Runbooks page:
| Source | Description |
|--------|-------------|
| **User** | Created manually by your team. |
| **Auto-learned** | Generated by Oodle based on observed patterns and past investigations. You can review, edit, or disable these. |
## Enabling and Disabling Skills
Each skill has an **Enabled** toggle. Disabled skills are not
loaded by the AI during conversations. Use this to temporarily
remove a skill without deleting it.
## Using Skills
### In AI Canvas
Skills are loaded on demand. When you ask a question in
AI Canvas, the AI matches your query against skill
descriptions and applies relevant skills automatically.
You can also reference a skill by name in your prompt.
### Via MCP
Skills are exposed through the Oodle MCP server. Any AI
agent connected to Oodle's MCP - such as
[Claude Code](/integrations/mcp/claude) or
[Cursor](/integrations/mcp/cursor) - can discover and
invoke skills during a conversation.
### With Alerts
When you ask the AI about a firing alert that has an
attached runbook, the AI follows the runbook steps to
investigate and report findings.
## Managing Skills
From the Skills & Runbooks page you can:
- **Search** skills using the search bar.
- **Filter** by type (Skill / Runbook), source
(Auto-learned / User), or status (Enabled).
- **Edit** a skill by clicking on it to open the edit
dialog.
- **Clone** an existing skill to create a variation.
- **Delete** a skill from the edit dialog.
---
## Alerting on Logs and Traces
Oodle [monitors](/alerts/monitors) evaluate PromQL. To alert on logs or
on traces, you make the signal a metric, then you write a monitor on
that metric.
| Signal | Metric | Setup |
|--------|--------|-------|
| Log lines, structured or plain text | `oodle_logs_` from a [LogMetrics](/log-management/log-metrics) rule | Create a rule. |
| Spans of all services | `oodle_trace_metrics` | None. Oodle makes it from every span. |
| GenAI spans (model calls, tools, tokens, cost) | `oodle_genai_*` | None. Oodle makes it from GenAI spans. |
The labels of the metric become the labels of the alert. A label that a
LogMetrics regex takes from a log line, for example a user name, shows
in the alert and in the notification.
## Alert on Logs
1. **Create a LogMetrics rule.** The rule selects the log lines and
emits a metric. It can take labels and numbers from any field, and
from plain-text lines with a regular expression. See
[LogMetrics](/log-management/log-metrics).
2. **Create a monitor on the metric.** Use `increase()` or `rate()` on
counters, and `histogram_quantile()` on histograms. Aggregate with
`sum by (...)` and keep the labels that you want in the alert.
A rule applies to logs that arrive after you save it. The monitor can
fire after the metric has data for the monitor time window.
### Example: Alert When a User Has Too Many Failed Logins
Log lines:
```text
WARN auth Login failed for user alice@example.com: bad password
```
**Step 1: LogMetrics rule.** Save this rule as `login-failures.json` and
run `oodle log-metrics create -f login-failures.json`, or create it in
**Logs** > **LogMetrics**:
```json
{
"name": "login-failures-by-user",
"filter": {
"all": [
{ "field": "message", "operator": "contains", "value": "Login failed for user" }
]
},
"labels": [
{
"name": "user",
"valueExtractor": { "field": "message", "regex": "Login failed for user (\\S+?):" }
}
],
"metricDefinitions": [
{ "name": "login_failures", "type": "log_count" }
]
}
```
The rule emits the counter `oodle_logs_login_failures` with a `user`
label.
**Step 2: Monitor.**
| Field | Value |
|-------|-------|
| Name | `Too many failed logins for {{ $labels.user }}` |
| Query | `sum by (user) (increase(oodle_logs_login_failures[10m]))` |
| Condition | Critical: **Above** `5` |
| Message | `{{ $labels.user }} had {{ $value }} failed logins in 10 minutes.` |
| Grouping | **By Labels**, with `user`, to get one notification for each user |
The same monitor in Terraform:
```hcl
resource "oodle_monitor" "login_failures" {
name = "Too many failed logins for {{ $labels.user }}"
promql_query = "sum by (user) (increase(oodle_logs_login_failures[10m]))"
conditions = {
critical = {
value = 5
operation = ">"
for = "1m"
}
}
}
```
See the
[`oodle_monitor` resource](https://registry.terraform.io/providers/oodle-ai/oodle/latest/docs/resources/monitor)
for all the fields.
### More Log Alert Queries
Each query uses the metric of a LogMetrics rule with the name in the
query. The `slow_tool_calls` and `tool_latency_ms` rules are examples on
the [LogMetrics](/log-management/log-metrics) page.
Error lines for each service, above 50 in 5 minutes:
```promql
sum by (service) (increase(oodle_logs_error_lines[5m])) > 50
```
p95 tool latency from plain-text `in ms` lines, above 5 seconds:
```promql
histogram_quantile(
0.95,
sum by (tool, le) (rate(oodle_logs_tool_latency_ms_bucket[5m]))
) > 5000
```
Tool calls of 10 s or more, from a `log_count` rule with a threshold
regex in its filter:
```promql
sum by (tool) (increase(oodle_logs_slow_tool_calls[15m])) > 0
```
No log lines from a job in the last 30 minutes (the job stopped):
```promql
(sum(increase(oodle_logs_backup_completed[30m])) or vector(0)) < 1
```
When no line matches, the metric has no series and `sum` returns no
value, so the comparison has nothing to compare. `or vector(0)` gives
the value 0 in that case, and the monitor fires.
## Alert on Traces
Oodle makes [span metrics](/traces/span-metrics) from all spans. You
can write monitors on them without setup.
Error ratio of a service above 5%:
```promql
sum by (service_name) (increase(oodle_trace_metrics{service_name="checkout", span_status="Error"}[5m]))
/
sum by (service_name) (increase(oodle_trace_metrics{service_name="checkout"}[5m]))
> 0.05
```
More than 20 requests of 1 s or more in 5 minutes, for each operation:
```promql
sum by (service_name, span_name) (
increase(oodle_trace_metrics{
service_name="checkout",
is_first_span_of_service="true",
duration_ns_bucket=~"1000000000|2000000000|4000000000|8000000000|16000000000|32000000000|64000000000|128000000000"
}[5m])
) > 20
```
`duration_ns_bucket` is the lower edge of a power-of-two bucket in
nanoseconds. See [Duration Buckets](/traces/span-metrics#duration-buckets)
for the edges.
### GenAI Alerts
GenAI tool calls slower than 8 s, for each tool:
```promql
(
sum by (tool_name) (increase(oodle_genai_tool_latency_seconds{le="+Inf"}[15m]))
-
sum by (tool_name) (increase(oodle_genai_tool_latency_seconds{le="8"}[15m]))
) > 0
```
Tool error ratio above 10%:
```promql
sum by (tool_name) (increase(oodle_genai_tool_error_total[15m]))
/
sum by (tool_name) (increase(oodle_genai_tool_call_total[15m]))
> 0.1
```
Model call p95 latency above 30 s:
```promql
histogram_quantile(
0.95,
sum by (model, le) (rate(oodle_genai_llm_call_latency_seconds[10m]))
) > 30
```
LLM cost above 50 US dollars in one hour:
```promql
sum(increase(oodle_genai_generation_cost_dollars[1h])) > 50
```
## Choose the Right Tool
| Question | Use |
|----------|-----|
| Tell me when a log pattern occurs, now and in the future. | LogMetrics rule and a monitor. |
| Tell me when a service has errors or slow requests. | Monitor on `oodle_trace_metrics`. |
| Tell me when agent tools fail or are slow, or when LLM cost grows. | Monitor on `oodle_genai_*`. |
| How many matching log lines were there last week? | Log search aggregation. |
| How many spans matched a filter last week? | TraceQL metrics query. |
| Which traces match this filter? | TraceQL search or the [Trace Explorer](/traces/trace-explorer). |
## Answer Questions About the Past
LogMetrics rules do not backfill. Use log search and TraceQL to answer
questions about data that Oodle already stored, and to test a filter
before you make a rule from it.
### Log Search Aggregations
The [Logs Query API](/integrations/logs/query), the log explorer and the
Oodle MCP server accept OpenSearch Query DSL with these aggregations:
`terms`, `date_histogram`, `range`, `filters`, `avg`, `min`, `max`,
`sum`, `percentiles`, `percentile_ranks` and `cardinality`.
Failed logins for each user in one week, from a structured `user`
field. The time range is in epoch milliseconds:
```json
{"index": ""}
{"size": 0, "query": {"bool": {"filter": [{"match_phrase": {"message": "Login failed"}}, {"range": {"timestamp": {"gte": 1759190400000, "lte": 1759795200000, "format": "epoch_millis"}}}]}}, "aggs": {"by_user": {"terms": {"field": "user.keyword", "size": 20}}}}
```
Error lines in each hour:
```json
{"index": ""}
{"size": 0, "query": {"bool": {"filter": [{"match_phrase": {"level.keyword": "ERROR"}}, {"range": {"timestamp": {"gte": 1759190400000, "lte": 1759795200000, "format": "epoch_millis"}}}]}}, "aggs": {"per_hour": {"date_histogram": {"field": "timestamp", "fixed_interval": "1h"}}}}
```
Aggregations group and compute on log fields. When the value is inside
the text of a message, for example `in 1250 ms`, make it a field first:
- A [log transform](/log-management/log-transforms) extracts the value
into a field when Oodle ingests the log. Aggregations can then use the
field.
- A [LogMetrics](/log-management/log-metrics) rule extracts the value
into a metric with a regex. Use it for alerts and for long-term
trends.
To count past lines that contain a text pattern, filter on the text
with `match_phrase` and count with `date_histogram` or the hit total.
### TraceQL
[TraceQL](/traces/traceql) searches the stored spans and computes
metrics from them, with any span attribute. For example, the number of
GenAI tool calls over 10 s for each tool:
```traceql
{ name =~ "execute_tool.*" && duration > 10s } | count_over_time() by (span.gen_ai.tool.name)
```
Run TraceQL in Grafana Explore, with the HTTP API, with
`oodle traces traceql`, or with the `query_traceql` MCP tool.
---
## Terraform for alerts
Configure all your alerts, notifiers and notification policies through terraform.
## Advantages of managing alerts as code
* They are version-controlled, making changes and rollbacks more transparent and trackable.
* This approach allows you to standardize alert configurations across environments, eliminating manual
errors and drift between staging and production. You can apply the same alert configuration across
all your deployments / environments.
* Terraform's declarative nature also makes it easy to spin up or tear down alerts alongside your
infrastructure, ensuring your monitoring evolves with your stack.
* Integrating alert management into your CI/CD pipeline means faster, more reliable deployments,
as your alerts will always align with the infrastructure they monitor.
## How
:::info
Use oodle's [Terraform Provider](https://registry.terraform.io/providers/oodle-ai/oodle/latest/docs)
:::
### Prerequisites
To setup Oodle Alerts via Terraform files, you'll need the following values:
- `OODLE_INSTANCE`: Your Oodle instance ID. Go to `Settings` icon -> `API Keys` page in your Oodle UI to find out. (Oodle UI links: )
- `OODLE_API_KEY`: Your Oodle API key for authentication. Go to `Settings` icon -> `API Keys` in your Oodle UI to choose an appropriate key. (Oodle UI links: )
### Example usage
```hcl
terraform {
required_providers {
oodle = {
source = "registry.terraform.io/oodle-ai/oodle"
}
}
}
# These can also be set as environment variables:
# export OODLE_DEPLOYMENT=https://us1.oodle.ai/
# export OODLE_INSTANCE="my-instance"
# export OODLE_API_KEY="my-api-key"
provider "oodle" {
deployment_url = "https://us1.oodle.ai/"
instance = "my-instance"
api_key = "my-api-key"
}
# Example usage of notifier, notification policy and monitor.
# Refer to https://registry.terraform.io/providers/oodle-ai/oodle/latest/docs/resources/notifier
# for schema documentation.
resource "oodle_notifier" "notifier_test1" {
name = "terraform_test_notifier"
type = "pagerduty"
pagerduty_config = {
service_key = "foo"
send_resolved = true
}
}
# Refer to https://registry.terraform.io/providers/oodle-ai/oodle/latest/docs/resources/notification_policy
# for schema documentation.
resource "oodle_notification_policy" "test1" {
name = "terraform_test_policy"
notifiers = {
critical = [oodle_notifier.notifier_test1.id]
}
}
# Refer to https://registry.terraform.io/providers/oodle-ai/oodle/latest/docs/resources/monitor
# for schema documentation.
resource "oodle_monitor" "test1" {
name = "terraform_test"
promql_query = "sum(rate(oober_food_delivery_revenue_usd[3m]))"
conditions = {
critical = {
value = 1210000
operation = ">"
for = "3m"
alert_on_no_data = true
}
}
notification_policy_id = oodle_notification_policy.test1.id
}
```
Apply terraform configuration
```bash
terraform init
terraform apply
```
---
## Alerts
export const FilteredDocCardList = () => {
const category = useCurrentSidebarCategory();
const filteredItems = category.items.filter(item => item.label !== 'Alerts');
return ;
};
## Entities
Oodle's alerting system allows you to monitor your metrics and receive notifications
when certain conditions are met. There are three entities that make up the alerting system:
- Monitors
- Notification Policies
- Notifiers
Additionally, you can create composite monitors that combine multiple monitor conditions.
Alerts functionality is available in the Oodle UI under the Bell icon in the sidebar navigation.
## Monitors
Monitors are the core of the alerting system. They define:
- A PromQL query to evaluate
- Conditions for triggering alerts (`Warning` and `Critical` thresholds)
- [Notification policy](#notification-policies) to be used for routing alerts
- Labels allow specifying a set of additional labels to be attached to the alert.
- Annotations specifies a set of informational labels that can be used to store
longer additional information such as alert descriptions or runbook links.
Labels and annotations can be templated in a similar manner as documented
in [Prometheus alertmanager](https://prometheus.io/docs/prometheus/latest/configuration/template_examples/).
Monitors are periodically evaluated and alerts are triggered when threshold
conditions are met.
See the [Monitors documentation](./monitors.mdx) for detailed configuration instructions.
## Notifiers
[Notifiers](./notifiers.mdx) are the endpoints where alerts are sent. Oodle supports several types of notifiers:
- [Slack](./notifiers.mdx#slack)
- [PagerDuty](./notifiers.mdx#pagerduty)
- [Opsgenie](./notifiers.mdx#opsgenie)
- Webhook
- [Google Chat](./notifiers.mdx#google-chat)
- [Microsoft Teams](./notifiers.mdx#microsoft-teams)
See the [Notifiers documentation](./notifiers.mdx) for detailed configuration instructions for each notifier type.
## Notification Policies
Notification policies determine how alerts are routed to different notifiers. Policies allow you to:
- Define separate notifiers for `Warning` and `Critical` alerts
- Create global policies that apply to all monitors in addition to the specific policies attached
to the monitors.
See the [Notification Policies documentation](./notification-policies.mdx) for detailed configuration instructions.
## Composite Monitors
Composite monitors allow you to create monitors based on combinations of multiple monitors. Using the `ALERTS` metric, you can implement complex logic such as:
- Alert only when multiple conditions are met simultaneously (AND logic)
- Alert when any of several conditions are met (OR logic)
- Alert when a threshold number of monitors are firing
For example, you can create a composite monitor that triggers only when both a database monitor and an API service monitor are firing, helping you identify dependent service failures.
See the [Composite Monitors documentation](./composite-monitors.mdx) for detailed configuration instructions and examples.
---
## Composite Monitors
Composite monitors allow you to create monitors based on combinations of other monitors.
This is useful when you need to alert on complex conditions that depend on multiple monitors.
## What are Composite Monitors?
Composite monitors use the `ALERTS` metric, which is automatically generated by Oodle for all active alerts.
By querying this metric, you can create monitors that trigger based on the state of other monitors.
## Creating a Composite Monitor
To create a composite monitor, you'll use the `ALERTS` metric in your PromQL query.
Each alert has several labels that you can filter on:
- `_oodle_monitor_id`: The unique ID of the monitor that generated the alert
- `alertstate`: The current state of the alert (`firing` or `pending`)
- `alertname`: The name of the alert
- `_oodle_severity`: The severity level (`critical`, `warn` or `no_data`)
### Basic Example: AND Logic
To alert when **both** Monitor A and Monitor B are firing:
```promql
(
count(ALERTS{
_oodle_monitor_id="",
alertstate="firing"
})
)
and
(
count(ALERTS{
_oodle_monitor_id="",
alertstate="firing"
})
)
```
This composite monitor will only trigger when both specified monitors are actively firing.
Set the condition to trigger when the result is greater than 0, indicating both alerts are firing.
### OR Logic Example
To alert when **either** Monitor A or Monitor B is firing:
```promql
count(ALERTS{
_oodle_monitor_id=~"|",
alertstate="firing"
})
```
### Severity-Based Composite Monitor
To alert when any critical alert from a specific set of monitors is firing:
```promql
count(ALERTS{
_oodle_monitor_id=~"monitor-id-1|monitor-id-2",
alertstate="firing",
_oodle_severity="critical"
})
```
## Finding Monitor IDs
To create composite monitors, you'll need the monitor IDs of the monitors you want to combine. You can find a monitor's ID:
1. Navigate to the monitor in the Oodle UI
2. The monitor ID is displayed in the URL params
3. You can also use labels to identify monitors instead of IDs
---
## Migrations
Oodle supports importing alerts from various platforms to make your migration
seamless. Choose the platform you're migrating from:
## Alertmanager / Prometheus
Import your Prometheus alert rules and Alertmanager notification routes into
Oodle.
**Methods available:**
- Upload `prometheus.yaml` and `alertmanager.yaml` configuration files directly
- Connect to running Prometheus/Alertmanager instances and scrape alerts
👉 [Import Alertmanager Alerts](/integrations/metrics/prometheus/alertmanager-alerts)
## Grafana
Import your existing Grafana Dashboards, Alerts, and Datasources into Oodle
automatically using a Service Account Token.
**What gets imported:**
- Dashboards with panels, queries, and folder structure
- Alert rules configured in Grafana
- Datasource configurations
👉 [Import from Grafana](/integrations/metrics/grafana)
---
## Monitors
Monitors allow you to define metric queries that trigger alerts based on specific conditions.
The system periodically evaluates these queries and generates alerts when the results violate the defined conditions.
## Key Components of a Monitor
### Alert Name
A descriptive name that identifies the monitor. You can use template variables in
the name using [Prometheus templates](https://prometheus.io/docs/prometheus/latest/configuration/template_reference/) syntax.
### Query
A PromQL query that the system evaluates periodically. You can use any valid PromQL query syntax.
To alert on logs, create a [LogMetrics](/log-management/log-metrics) rule
and use its `oodle_logs_*` metric in the query. To alert on spans, use
the built-in [span metrics](/traces/span-metrics) `oodle_trace_metrics`
and `oodle_genai_*`. See
[Alerting on Logs and Traces](/alerts/alerting-on-logs-and-traces) for
full examples.
### Conditions
Conditions specify the threshold values that trigger alerts. There are two severity levels:
- `Critical`
- `Warning`
You must define at least one condition, and you can set different thresholds for each severity level.
The following operators are available for conditions:
- Equal to
- Not equal to
- Above
- Above or Equal to
- Below
- Below or Equal to
### Message
A customizable message that accompanies alert notifications. You can enhance messages using template variables
with [Prometheus templates](https://prometheus.io/docs/prometheus/latest/configuration/template_reference/) syntax.
For example, with a query like `max by (job) (up)`, you can access the job name in your message using
the template variable `{{ $labels.job }}`.
:::note
Oodle notifications automatically include the following information, so you don't need to add them to your message:
- Alert name
- Severity
- Threshold
- Metric Value (the current value when the alert fires)
- Labels and Annotations
:::
### Notification Policy
Notification policies determine where alert notifications
are sent. You can configure multiple notifiers as
destinations for your alerts.
Each rule specifies which notifiers to trigger and can
optionally be scoped by label conditions and severity.
#### How Routing Rules Work
Notification rules are evaluated **top to bottom** on a
first-match basis. The first rule whose conditions match
the alert fires its notifiers; subsequent rules are
skipped. The last rule without any label conditions acts
as the **fallback** and catches everything that didn't
match an earlier rule.
Rules follow an **If / Else If / Else** pattern:
| Position | Prefix | Description |
|----------|--------|-------------|
| First rule (with conditions) | **If** | Evaluated first |
| Additional rules (with conditions) | **Else If** | Evaluated only when preceding rules don't match |
| Last rule (no conditions) | **Always** / **Else** | Fallback — matches all remaining alerts |
You can drag and drop rules to reorder them.
#### Label-Based Routing
Each rule can include one or more **label conditions** to
match alerts. Conditions within a single rule are combined
with AND logic. Available operators are:
- `is` — exact match
- `is not` — negated match
- `matches regex` — regex match
- `does not match regex` — negated regex match
Label values are auto-suggested from the monitor's query
results, so you can pick from labels that actually appear
in your data.
**Example — Team-based routing:**
Route alerts to the owning team's channel based on a
`team` label:
| Rule | Condition | Notifier |
|------|-----------|----------|
| **If** | `team` is `backend` | Slack `#backend-alerts` |
| **Else If** | `team` is `frontend` | Slack `#frontend-alerts` |
| **Else** | *(none — fallback)* | Slack `#ops-alerts` |
**Example — Environment-based routing:**
Escalate production alerts to your incident management
tool while keeping non-production alerts in Slack:
| Rule | Condition | Notifier |
|------|-----------|----------|
| **If** | `environment` is `production` | OpsGenie |
| **Else** | *(none — fallback)* | Slack `#dev-alerts` |
**Example — Combined conditions:**
Conditions within a rule are AND'd together, so you can
be very specific:
| Rule | Conditions | Notifier |
|------|------------|----------|
| **If** | `team` is `payments` AND `environment` is `production` | PagerDuty |
| **Else If** | `environment` is `production` | OpsGenie |
| **Else** | *(none — fallback)* | Slack `#alerts` |
#### Severity-Based Routing
Within each rule, you can filter by alert severity using
the **for** dropdown. The options are:
| Option | Matches |
|--------|---------|
| **all** | Critical, Warning, and No Data alerts |
| **critical** | Only Critical alerts |
| **warning** | Only Warning alerts |
| **no data** | Only No Data alerts |
When you select a specific severity, you can add
additional severity rows within the same rule to send
different severities to different notifiers. For example,
within a single rule you can send `critical` alerts to
PagerDuty and `warning` alerts to Slack.
#### Notification Policies vs. Direct Notifiers
Each rule supports two action types, selectable via the
dropdown next to the rule:
- **notify on** — Send directly to one or more notifiers
(Slack, OpsGenie, PagerDuty, etc.)
- **trigger policy** — Delegate to a reusable
[Notification Policy](/alerts/notification-policies)
that defines its own routing, grouping, and timing
### Grouping
Grouping controls how notifications are consolidated. You can choose from three options:
- By Monitor: Receive a single notification per monitor (default behavior)
- By Labels: Receive a notification for each unique set of specified labels
- Disabled: Receive a notification for each individual timeseries
For example, consider a monitor with this query that alerts when the `up` metric for any `job` is 0:
```
max by (job, instance) (up{})
```
Here's how different grouping options affect notifications:
- **By Monitor:** You receive one notification that includes all affected jobs and instances
- **By Labels** (with `job` specified): You receive one notification per affected job
- **Disabled:** You receive one notification per affected timeseries (job-instance combination)
### Notification Timings
These parameters control the timing of grouped notifications:
#### Group Wait
Group Wait defines how long to wait before sending the first notification for a new group of alerts.
The default is 30 seconds.
#### Group Interval
Group Interval defines how long to wait before sending a notification for new alerts added to a group that has already sent notifications.
The default is 5 minutes.
#### Repeat Interval
The repeat interval specifies how often notifications are resent for active alerts. For example, if you have an active alert
for the timeseries `up` with `job=foo` and `instance=bar`, setting a repeat interval of 10 minutes means the notification
will be sent every 10 minutes until the alert is resolved.
:::info
For example, with the `up` metric monitor grouped "By Monitor", consider a group wait of 30 seconds and a group interval of 5 minutes:
If two jobs go down within the first 30 seconds, you'll receive one notification covering both jobs. If a third job goes down a minute later,
its notification will be delayed by the 5-minute group interval.
:::
### Labels
Labels add metadata to alerts. You can use [Prometheus templates](https://prometheus.io/docs/prometheus/latest/configuration/template_reference/) syntax
to create dynamic labels.
A common use case is tagging monitors with owner teams to identify responsible teams for each monitor.
### Annotations
Annotations provide additional context for alerts, such as descriptions or runbook links.
Like labels, annotations support [Prometheus templates](https://prometheus.io/docs/prometheus/latest/configuration/template_reference/) syntax.
## Creating a Monitor with AI
The quickest way to create a monitor is to ask the AI Assistant. Open
the sidebar assistant (Cmd + I) or
[AI Canvas](/ai-canvas) and describe the alert you need:
- `Create an alert to notify me when container memory usage is above 90%`
- `Alert me when the error rate on api-server exceeds 5%`
- `Create an alert for container restarts in the last 10 minutes`
The AI will build the PromQL query, set the threshold, and save the
monitor. You can review and adjust it from the alerts page afterwards.
## Creating a Monitor Manually
1. Navigate to **Alerts** (Bell icon in sidebar)
2. Click **New Alert**
3. Configure the following settings:
- **Name:** Enter a descriptive name for your monitor
- **Query:** Specify the PromQL query to evaluate
- **Conditions:** Define the alerting conditions
- **Message:** (Optional) Add a message for alert notifications
- **Notification Policy:** (Optional) Select routing rules for alerts
- **Grouping:** (Optional) Configure how you want to group alerts. Additionally,
you can configure various timing parameters by clicking on the **Clock** icon.
- **Labels:** (Optional) Add metadata labels to the alerts
- **Annotations:** (Optional) Include additional contextual information
4. Click **Save** to create the monitor
---
## Muting
## Overview
You can mute alerts to temporarily silence notifications for specific alerts without deleting or disabling them permanently. This is useful during maintenance windows, known incidents, or when you need to reduce noise.
## When to Use
Mute alerts when:
- Performing scheduled maintenance
- Investigating a known issue
- Testing changes in production
- Dealing with expected high traffic events
- Reducing alert fatigue during incident response
## How to Mute an Alert
1. Go to the Alerts page.
2. Find the alert you want to mute.
3. Click on alert's context menu [•••] and select 'Mute'.
4. Select the duration for muting (options: 1 hour, 6 hours, 12 hours, 1 day, 2 days, infinite, or custom).
5. Optionally add labels for muting.
6. Click 'Add Muting Rule'.
7. To unmute, click on the red trash can.
## How to Unmute an Alert
1. Navigate to the Alerts page.
2. Filter or find muted alerts using the Muted filter in the left sidebar, or sort the 'Muted left' column.
3. Click on a muted alert's Muted indicator in the Muted left column.
4. Click on the red trash can to permanently remove it.
## Muted Alert Behavior
- Muted alerts do not trigger notifications via email, Slack, PagerDuty, or other channels
- Muted alerts still evaluate conditions, and change state to "firing"
- You can view muted alert firing history in the alert timeline
- Muted alerts appear with a 'Muted' badge in the alerts list
- The system automatically unmutes alerts when the mute period expires
## FAQ
### Can I mute multiple alerts at once?
Yes, you can select multiple alerts from the alerts list and mute in-bulk using the bulk actions menu.
### What happens if an alert triggers while muted?
The alert condition is still evaluated, the state of the alert is appropriately updated, but no notifications are sent. You can see these occurrences in the alert history.
### Can I schedule a mute in advance?
Yes, when selecting 'Custom' duration, you can set a future start time for the mute period.
### Are there limits on mute duration?
No, there are no maximum limits on mute duration.
## Related Features
- [Alert Conditions](/alerts/monitors#conditions) - Modify alert thresholds to reduce false positives
- [Notification Policies](/alerts/notification-policies) - Configure which channels receive alert notifications
- [Notifiers](/alerts/notifiers) - Configure notification channels
---
## Notification Policies
Notification policies let you route alerts to different notifiers based on severity levels.
Each policy can be configured with specific notifiers for both `Warning` and `Critical` severity levels.
With notification policies, you can:
- Create team-specific policies to route team alerts to designated notifiers
- Set up deployment-specific policies to route alerts from different deployments (e.g. dev, staging, production) to appropriate notifiers
## Create a Notification Policy
1. Navigate to **Alerts** (Bell icon in sidebar) → click the ellipsis (**...**) → select **Notification Policies**
2. Click the **+** icon.
3. Fill in the following fields:
- Name: A descriptive name for your notification policy
- Critical: (Optional) Select notifiers to receive alerts with `Critical` severity
- Warning: (Optional) Select notifiers to receive alerts with `Warning` severity
- Global: Enable this toggle to apply the policy to all monitors in addition to their individual notification policies.
This is particularly useful when migrating from another system and you want to verify Oodle alerts while maintaining
your existing alert system. By default, this toggle is **OFF**.
4. Click **Save** to create the notification policy
:::note
You can also create notification policies directly from the monitor create/edit page by clicking the **Add Notification** button.
:::
## Use a Notification Policy
After creating a notification policy, you can attach it to any monitor during creation or editing.
Once attached, the monitor's alerts will be automatically routed to the notifiers specified in the policy.
---
## Notifiers
Notifiers are endpoints that receive alert notifications when monitor conditions are triggered.
This guide explains each supported notifier type and provides step-by-step configuration instructions.
## Supported Notifiers
### Slack
To send notifications to Slack, you'll need an incoming webhook URL. There are two methods to create one:
1. Slack Apps
2. Incoming Webhooks (Legacy)
#### Slack Apps
Follow these steps to create an incoming webhook using Slack Apps. For more details, see the
official [Slack documentation on incoming webhooks](https://api.slack.com/messaging/webhooks).
1. Create a Slack App:
- Visit [https://api.slack.com/apps?new_app=1](https://api.slack.com/apps?new_app=1)
- Choose a name for your app
- Select your workspace
- Click **Create App**
2. Enable incoming webhooks:
- Open the [Apps management dashboard](https://api.slack.com/apps)
- Select your app
- Click on Incoming Webhooks
- Toggle **Activate Incoming Webhooks** to ON
3. Create a webhook:
- Click **Add New Webhook to Workspace**
- Select the channel for receiving messages
- Click **Authorize**
You'll receive a webhook URL that looks like this:
```
https://hooks.slack.com/services/T00000000/B00000000/XXXXXXXXXXXXXXXXXXXXXXXX
```
:::note
Webhooks created through Slack Apps can only post to their designated channel. You'll need separate webhooks for different channels.
:::
#### Incoming WebHooks App (Legacy)
The legacy Incoming WebHooks app allows you to create webhooks that can send messages to any channel in your workspace.
1. Install the [Incoming WebHooks](https://slack.com/marketplace/A0F7XDUAZ-incoming-webhooks) app to your workspace
2. Click **Add to Slack**, select a default channel, then click **Add Incoming WebHooks Integration**
:::note
Legacy webhooks can send messages to any channel in your workspace, unlike Slack Apps webhooks which are channel-specific.
:::
#### Configuration
To set up a Slack notifier in Oodle:
1. Navigate to **Alerts** (Bell icon in sidebar) → click the ellipsis (**...**) → select **Notifiers**
2. Click the **+** icon and choose **Slack** from the dropdown
3. Fill in the following:
- Name: A descriptive name for your notifier
- API URL: The URL from Slack
- Channel (optional): Override the default channel. Note: This only works with legacy webhooks
:::note
For Slack Apps webhooks, messages will always go to the channel specified during webhook creation, regardless of the channel setting in Oodle.
:::
4. Click **Save** to create the notifier
### Pagerduty
To send notifications to Pagerduty, you'll need an API Key. Oodle supports following Pagerduty Integrations:
1. Events API V2 (Recommended)
2. Prometheus
##### Events API V2 (Recommended)
[Events API V2](https://developer.pagerduty.com/docs/events-api-v2-overview) is rich Events API in comparison
to Prometheus integration. For example, it allows to set Pagerduty Alert's Severity, attach images etc. which
are not possible in Prometheus integration type.
To get an Events API v2 API Key, follow:
1. Log in to PagerDuty and navigate to **Services** in the top menu bar.
2. Click on the service you are currently using, or create a new service.
3. Click **Integrations** and then **Add another integration**.
4. Select **Events API V2** from the list of integrations.
5. After creating the integration, you will be able to see the API Key for this integration.
##### Prometheus
Prometheus Integration is less richer in comparison to Events API V2 Integration. To get a Prometheus Integration
API Key, follow:
1. Log in to PagerDuty and navigate to **Services** in the top menu bar.
2. Click on the service you are currently using, or create a new service.
3. Click **Integrations** and then **Add another integration**.
4. Select **Prometheus** from the list of integrations.
5. After creating the integration, you will be able to see the API Key for this integration.
#### Configuration
To set up a Pagerduty notifier in Oodle:
1. Navigate to **Alerts** (Bell icon in sidebar) → click the ellipsis (**...**) → select **Notifiers**
2. Click the **+** icon and choose **Pagerduty** from the dropdown
3. Fill in:
- Name: A descriptive name for your notifier
- Integration: Choose `Events API V2` or `Prometheus` based on the Integration you have configured on Pagerduty.
- API Key: Your Pagerduty integration API key
4. Click **Save** to create the notifier
When using `Events API V2`, Oodle sets [Pagerduty Alert's Severity](https://support.pagerduty.com/main/docs/dynamic-notifications#severity-and-urgency-mapping)
based on the Condition Severity defined within the monitor:
- Critical condition in Oodle is mapped to `critical` severity in Pagerduty.
- Warning condition in Oodle is mapped to `warning` severity in Pagerduty.
Follow [Configure Dynamic notifications](https://support.pagerduty.com/main/docs/dynamic-notifications#configure-dynamic-notifications)
in Pagerduty to govern alert notifications based on Severity.
### Opsgenie
To send notifications to Opsgenie, you'll need an API key. Here's how to get one:
1. Log in to Opsgenie and navigate to [Integrations](https://app.opsgenie.com/settings/integration/integration-list)
2. Click **Add Integration** and select **Prometheus**
3. Configure the integration:
- Enter a name
- Select the team to receive alerts
- Click **Continue**
4. Click **Turn on Integration** to activate it
5. [Optional] In `Incoming | Rules for creating and processing alerts` section, Click on `Create Alert` and update
`Message` field from `[Prometheus]: {{message}}` to `{{message}}`.
#### Configuration
To set up an Opsgenie notifier in Oodle:
1. Navigate to **Alerts** (Bell icon in sidebar) → click the ellipsis (**...**) → select **Notifiers**
2. Click the **+** icon and choose **Opsgenie** from the dropdown
3. Fill in:
- Name: A descriptive name for your notifier
- API Key: Your Opsgenie integration API key
4. Click **Save** to create the notifier
Oodle sets [Opsgenie's Priority](https://support.atlassian.com/opsgenie/docs/what-is-the-priority-level-of-integration/)
based on the Condition Severity defined within the monitor:
- Critical condition in Oodle is mapped to `P1` priority in Opsgenie.
- Warning condition in Oodle is mapped to `P2` priority in Opsgenie.
### Rootly
To send notifications to Rootly, you'll need a Bearer Token Secret from a Rootly Alertmanager source.
1. In Rootly, navigate to [Alert Sources > New Alertmanager Source](https://rootly.com/account/alert-sources/new?alerts_source%5Bsourceable_type%5D=Alerts%3A%3AAlertmanagerSource)
2. Give the source a name (e.g. "Oodle Alerts")
3. Under **Urgency**, add a condition: `$.alerts[0].labels._oodle_severity` is `warn` sets urgency to **Medium**, otherwise **High**
4. Save and copy the **Bearer Token Secret**
#### Configuration
To set up a Rootly notifier in Oodle:
1. Navigate to **Alerts** (Bell icon in sidebar) → click the ellipsis (**...**) → select **Notifiers**
2. Click the **+** icon and choose **Rootly** from the dropdown
3. Fill in:
- Name: A descriptive name for your notifier
- Bearer Token: The Bearer Token Secret from Rootly
4. Click **Save** to create the notifier
Oodle delivers alerts in Alertmanager webhook format. Rootly uses the `_oodle_severity` label to map alert urgency based on the conditions you configured above.
A Rootly notifier is a webhook underneath, so it also accepts a
[Custom Payload](#custom-payload), but with a difference. Rootly's alert
source parses the standard Alertmanager body, and the urgency condition above
reads `$.alerts[0].labels._oodle_severity` out of it, so Oodle keeps that body
in place: anything you add is sent *alongside* the standard fields rather than
replacing them. The editor names those fields below the box, and expands to
show the full body that goes out.
Oodle adds the standard fields as it delivers the alert, thus you write only
your own keys, and the API and the Terraform provider behave the same way. A
payload that sets one of the standard keys itself is rejected, because the
value would be lost.
Two of the standard fields cannot be carried on a custom payload: `groupKey` is
dropped, and `version` is sent as the number `4` rather than the string `"4"`.
For more details, see the [Rootly Alertmanager docs](https://docs.rootly.com/integrations/alertmanager).
### Google Chat
To send notifications to Google Chat, you'll need a webhook URL. Get the Webhook URL by following
[Create a webhook for the Google Space](https://developers.google.com/workspace/chat/quickstart/webhooks) for the Google Space you want to send notification to.
When creating the webhook in Google Chat, we recommend:
- **Name**: `Oodle Alerts`
- **Avatar URL**: `https://www.oodle.ai/img/logo_square.png`
This gives alert messages a recognizable name and Oodle logo in Google Chat.
#### Configuration
To set up a Google Chat notifier in Oodle:
1. Navigate to **Alerts** (Bell icon in sidebar) → click the ellipsis (**...**) → select **Notifiers**
2. Click the **+** icon and choose **Google Chat** from the dropdown
3. Fill in:
- Name: A descriptive name for your notifier
- Webhook URL: The Webhook URL you created above.
4. Click **Save** to create the notifier.
### Microsoft Teams
To send notifications to Microsoft Teams, you'll need a webhook URL. Get the Webhook URL by following
[Create an incoming Webhook with Workflows](https://support.microsoft.com/en-gb/office/create-incoming-webhooks-with-workflows-for-microsoft-teams-8ae491c7-0394-4861-ba59-055e33f75498) for the Teams Channel you want to send notifications to.
#### Configuration
To set up a Microsoft Teams notifier in Oodle:
1. Navigate to **Alerts** (Bell icon in sidebar) → click the ellipsis (**...**) → select **Notifiers**
2. Click the **+** icon and choose **Microsoft Teams** from the dropdown
3. Fill in:
- Name: A descriptive name for your notifier
- Webhook URL: The Webhook URL you created above.
4. Click **Save** to create the notifier
### Webhook
A webhook notifier posts each alert to an HTTP endpoint you control. By default
Oodle sends the standard
[Alertmanager webhook payload](https://prometheus.io/docs/alerting/latest/configuration/#webhook_config).
#### Configuration
To set up a webhook notifier in Oodle:
1. Navigate to **Alerts** (Bell icon in sidebar) → click the ellipsis (**...**) → select **Notifiers**
2. Click the **+** icon and choose **Webhook** from the dropdown
3. Fill in:
- Name: A descriptive name for your notifier
- API URL: The endpoint Oodle posts to
- Authorization Credentials (optional): Sent as a `Bearer` token in the
`Authorization` header
- Custom Payload (optional): See below
4. Click **Save** to create the notifier
#### Custom Payload
If your endpoint expects a different request body, set **Custom Payload** to a
JSON object. It replaces the default body entirely. Every string in the object
(keys included, at any nesting depth) is a
[Go template](https://pkg.go.dev/text/template) rendered against the alert
notification data, so you can shape the request to whatever the endpoint needs:
```json
{
"text": "{{ .CommonLabels.alertname }} is {{ .Status }}",
"severity": "{{ .CommonLabels._oodle_severity }}",
"labels": "{{ .CommonLabels | toJson }}",
"sections": [{ "summary": "{{ .CommonAnnotations.summary }}" }]
}
```
A rendered string that itself parses as JSON is inlined as structured data
rather than quoted, which is what makes `toJson` useful: `labels` above arrives
at the endpoint as an object, not as a string containing JSON.
The payload is per notifier: each webhook notifier carries its own, and one
left empty keeps the default body.
The template data is the same
[Alertmanager notification data](https://prometheus.io/docs/alerting/latest/notifications/)
available to the other notifier types. Expand **Available Variables** above the
editor for the full list: `.Status`, `.CommonLabels.alertname`,
`.CommonLabels._oodle_severity`, `.CommonAnnotations._oodle_message`,
`.Alerts.Firing` and the rest.
:::warning
Oodle does not validate that the rendered payload is what your endpoint
expects. If the template is malformed or the endpoint rejects the body, the
notification fails to deliver. Use **Test** on the notifier after saving.
:::
## Use a Notifier
Once you have a notifier created, you can use it in a notification policy to route alerts to the notifier.
See the [Notification Policies documentation](./notification-policies.mdx) for more details.
---
## Anomaly Alerting
Anomaly Alerting lets you configure notification policies for
anomalies detected by Oodle's anomaly detection system.
When anomalies are detected in your logs or metrics, alerts are
sent to the notification channels you configure.
## Getting Started
Navigate to **Anomalies → Anomaly Alerting** in the sidebar. The
page shows the available anomaly detection modules and their
status.
## Detectors Table
The page displays a table of all anomaly detectors:
| Column | Description |
|--------|-------------|
| **Name** | Detector name (underscores are displayed as spaces). |
| **Description** | What the detector monitors. |
| **Data Sets** | The data source the detector operates on (e.g., `logs`, `metrics`), shown as badges. |
| **Status** | Toggle switch to enable or disable the detector. |
Clicking an enabled detector row opens a drawer that shows
the alerts generated by that detector, using the same interface
as the [Alerts](/alerts/) page.
## Notification Policy
At the top of the page, the **Notification Policy** label shows
the currently assigned policy. Click it to open a drawer where
you can create or select an existing notification policy.
Notification policies define which channels (Slack, email,
PagerDuty, etc.) receive anomaly alerts.
### Setting a Notification Policy
1. Click the **Notification Policy** value (or the "-" if none
is set).
2. In the drawer, select an existing policy or create a new one.
3. Click **Save and Add Notification Policy**.
You can remove the current policy by clicking the delete icon
next to the policy name.
## Enabling / Disabling Detectors
Toggle the **Status** switch for each detector:
- **Enabled** (blue) — The detector actively monitors for
anomalies and sends alerts through the configured notification
policy. The row becomes clickable to view related alerts.
- **Disabled** (grey) — The detector is paused and does not
generate alerts. The row is not clickable.
:::note
Toggling a detector requires edit permissions. Users without
edit access will see disabled switches.
:::
## How It Works
1. Oodle continuously analyzes incoming logs and metrics using
machine learning models.
2. When a pattern deviates significantly from the learned
baseline, an anomaly is detected.
3. If the corresponding module is enabled and a notification
policy is configured, an alert is sent.
4. Detected anomalies are also visible in the
[Anomaly Detection](/anomaly-detection/) dashboard.
## Best Practices
- **Enable both modules** for comprehensive coverage across logs
and metrics.
- **Set up a dedicated notification channel** for anomaly alerts
to avoid mixing them with other alert types.
- **Review anomalies regularly** on the Anomaly Detection
dashboard, even if alerts are configured — not all anomalies
may be severe enough to trigger notifications.
- **Tune notification policies** to avoid alert fatigue. Start
broad and narrow down as you learn which anomalies are
actionable.
## Related Pages
- [Anomaly Detection](/anomaly-detection/) — View and
investigate detected anomalies.
- [Alerts](/alerts/) — Configure alert rules and notification
policies.
---
## Anomaly Detection
Oodle automatically identifies unusual patterns in your metrics and logs,
helping you catch issues before they impact your users.
## Overview
Anomaly detection helps you:
- **Detect Issues Early**: Automatically identify unusual patterns before they
become critical problems
- **Reduce Alert Noise**: Focus on genuine anomalies by blocking repetitive or
irrelevant patterns
- **Compare Historical Patterns**: Understand how current behavior differs from
your historical baselines
- **Prioritize Issues**: Anomalies are ranked by severity to help you focus on
what matters most
## How It Works
Oodle continuously monitors your infrastructure and applications, automatically
detecting:
- **Metric Anomalies**: Unusual behavior in your infrastructure and application
metrics
- **Log Anomalies**: New or unusual patterns in your error logs
When anomalies are detected:
- They appear on the Anomalies page for you to review
- You can set up alerts to be notified immediately
- You can block repetitive or expected patterns to reduce noise
## Types of Anomalies
### Metric Anomalies
Oodle detects unusual patterns in your infrastructure and application metrics,
including:
- **CPU Throttle**: Services experiencing CPU throttling
- **High Node CPU**: Nodes with unusually high CPU usage
- **Service Communication Errors**: Communication issues between services
- **API Errors**: High error rates in your APIs
- **Container Restarts**: Containers restarting unexpectedly
- **High Memory**: Services with excessive memory usage
- **Pod Phase Issues**: Pods in problematic states (e.g., CrashLoopBackOff)
### Log Anomalies
Oodle identifies unusual patterns in your logs by detecting:
- **New Patterns**: Error messages that haven't appeared before
- **Spikes**: Sudden increases in existing error patterns
- **High Volume**: Recurring errors with unusually high occurrence rates
Each anomaly shows whether it's a new issue or a recurring problem, helping you
prioritize your response.
## Using the Anomalies Page
The Anomalies page (`/anomalies`) provides three main tabs:
### Anomalies Tab
View all detected anomalies with comprehensive filtering and details:
- **Filters**: Filter by type (metrics/logs), subtype, cluster, namespace, or
service
- **Time Range**: Select the time window to view anomalies
- **Details**: Click on any anomaly to see:
- Trend charts showing the anomaly over time
- Related logs (for log anomalies)
- Metric queries (for metric anomalies)
- Labels and metadata

### Detectors Tab
Control which types of anomalies to detect:
- Toggle individual detector types on/off
- Changes save automatically
- Useful for temporarily disabling noisy or irrelevant detectors
### Spam Tab
Manage blocked anomalies to reduce noise:
- **Search**: Search through blocked anomalies to find specific items
- **View Blocked Items**: See all anomalies you've blocked
- **Unblock**: Remove items from the blocklist to allow them to appear again
When you block an anomaly, it won't trigger alerts or appear in your anomaly
feed, keeping your view focused on what matters.
## FAQ
### How does Oodle detect log anomalies?
Oodle doesn't evaluate individual log lines. Instead it
works at the **pattern** level:
1. **Filter to errors** — only error-level logs are
considered. Non-error logs are never evaluated.
2. **Group by pattern** — error logs are bucketed by
**cluster**, **container**, and **fingerprint** (a
pattern identifier for structurally similar messages).
3. **Compare against 24 hours ago** — the total count
for each group in the last 1-hour window is compared
against the same 1-hour window 24 hours ago.
4. **Apply thresholds** — a group is flagged when:
- It has **more than 4 occurrences** in the current
hour, **and**
- It meets one of these conditions:
- **New Pattern** — the group didn't exist in the
baseline window
- **Spike** — the count has at least doubled
compared to 24 hours ago
- **Volume** — a recurring error with notable
count that hasn't doubled

### How does Oodle detect metric anomalies?
Oodle runs predefined queries against your infrastructure
and application metrics every 5 minutes:
1. **Query current and historical values** — each query
produces a single value for the last 1-hour window
and a comparison value from the same window 24 hours
ago.
2. **Compare values** — an anomaly is flagged when:
- The current value shows a **significant percentage
increase** over the historical value (used for CPU
throttling, node CPU, memory usage, API error
rates, and service communication errors), or
- The current value is **non-zero** (used for
container restarts and pod phase issues, where any
occurrence is notable).

### What time window is used to detect anomalies?
Both log and metric anomaly detection compare two
one-hour windows:
- **Current window**: the last hour
(`now − 1h` to `now`)
- **Baseline window**: the same hour one day ago
(`now − 25h` to `now − 24h`)
Using the same time-of-day accounts for diurnal traffic
patterns. The checks run every 5 minutes, so anomalies
are re-evaluated with fresh data on each cycle.
### How long after a fix before an anomaly disappears?
Anomalies are not stored as persistent records — they are
re-computed from live data every 5 minutes. Once a fix is
deployed:
1. The one-hour sliding window needs to clear of pre-fix
data. In the worst case this takes **up to one hour**
after the fix.
2. On the next 5-minute check after the window clears, no
new data point is emitted for that anomaly.
3. The anomaly's trend chart in the UI drops to zero and
it effectively disappears from the Anomalies page.
This means it can take **up to 1 hour** after a fix
is deployed for the anomaly to fully disappear.

### Can anomaly detection be customized?
Yes — Oodle's anomaly detection is customizable. Reach
out to us to tailor detection rules based on your
specific data patterns and operational needs.
## Best Practices
1. **Review Regularly**: Check the Anomalies page
regularly to catch emerging issues early
2. **Block Noise**: Use the blocking feature to suppress
known non-issues or expected patterns
3. **Create Targeted Alerts**: Set up alerts for specific
anomaly types that are most critical to your operations
4. **Investigate Recurring Anomalies**: Pay attention to
recurring anomalies, as they may indicate persistent
underlying issues
5. **Use Filters**: Filter by cluster, namespace, and
service to focus on specific areas of your
infrastructure
---
## Dashboards
Dashboards are a way to query, visualize, and organize your observability data
to gain deeper insights at a glance. Oodle provides dashboards for both metrics
and logs.
## Metrics Dashboards
Build dashboards using PromQL to visualize your metrics data. Create panels
with time series graphs, gauges, stat panels, and more.
- **Query with PromQL** - Use the query builder or write queries directly
- **Dashboard variables** - Create dynamic, reusable dashboards
- **Infrastructure as code** - Manage dashboards via Terraform
[Explore Metrics Dashboards →](/dashboards/metrics)
## Logs Dashboards
Create dashboards from your log data to monitor application health, track
errors, and analyze patterns. Build visualizations and combine them into
comprehensive monitoring views.
- **Multiple chart types** - Line, bar, area, pie, heat map, and more
- **Aggregations** - Count, sum, average, and unique count metrics
- **Flexible grouping** - Date histograms, terms, filters, and ranges
[Explore Logs Dashboards →](/dashboards/logs/log-dashboards)
## Explore Further
---
## Dashboards(Logs)
Dashboards combine multiple visualizations into a single view, giving you a
comprehensive overview of your log data. Build dashboards to monitor
application health, track errors, and analyze user behavior.
:::tip Try it Live
Explore a working example dashboard in the
[Oodle Playground](https://play.oodle.ai/logs/app/dashboards)
to see a multi-panel dashboard.
:::
## Terminology
| Term | Description |
|------|-------------|
| **Dashboard** | A collection of panels arranged on a canvas that provides a unified view of your data |
| **Panel** | A single visualization displayed on a dashboard (also called a visualization) |
| **Visualization** | A chart, graph, metric, or table that represents your log data visually |
| **Index Pattern** | The data source that defines which logs are available for visualizations |
## Creating a New Dashboard
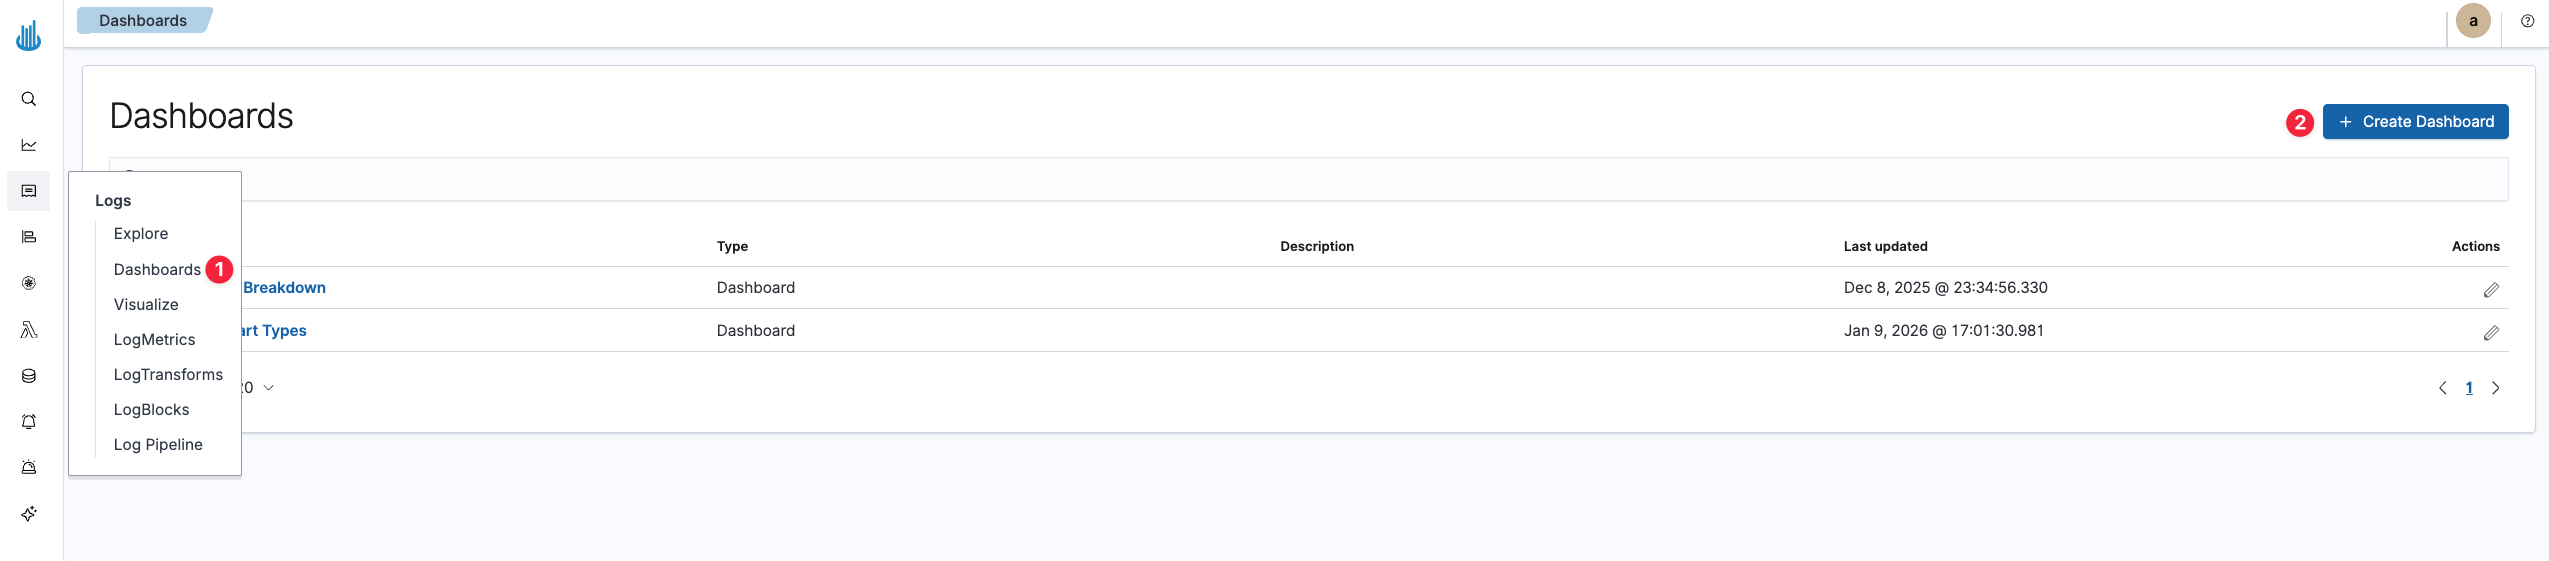
1. Navigate to the **Dashboards** section from the sidebar
2. Click **Create Dashboard**
3. You'll see an empty dashboard canvas ready for panels
## Adding Visualizations
### Add Existing Visualization
1. Click **Add** in the toolbar
2. Select **Add from library**
3. Browse or search for saved visualizations
4. Click on a visualization to add it to the dashboard
### Create New Visualization
1. Click **Add** in the toolbar
2. Select **Create new**
3. Choose a visualization type
4. Configure and save the visualization
5. It will automatically be added to your dashboard
## Dashboard Controls
### Time Filter
The time picker in the top navigation controls the time range for all panels.
You can:
- Select predefined ranges (Last 15 minutes, Last 24 hours, etc.)
- Set custom absolute time ranges
- Use relative time expressions
### Query Bar
Enter a query in the search bar to filter data across all panels:
```
container_name:frontend AND log_level:error
```
### Filters
Click **Add filter** to create field-based filters that apply to all panels.
Filters appear as pills below the query bar and can be:
- Toggled on/off
- Pinned across dashboards
- Inverted (exclude matching documents)
### Refresh
- **Manual refresh**: Click the refresh button
- **Auto-refresh**: Set an interval (e.g., every 30 seconds) for live
monitoring
## Panel Options
Click the gear icon on any panel to access:
| Option | Description |
|--------|-------------|
| **Edit visualization** | Modify the underlying visualization |
| **Clone panel** | Duplicate the panel on this dashboard |
| **Create drilldown** | Link to another dashboard or URL |
| **Full screen** | Expand the panel to full screen |
| **Replace panel** | Swap with a different visualization |
| **Delete from dashboard** | Remove the panel |
## Saving Dashboards
1. Click **Save** in the toolbar
2. Enter a dashboard title
3. Optionally add a description
4. Choose whether to save the current time filter with the dashboard
5. Click **Save**
### Save Options
- **Save as new dashboard**: Creates a copy with a new name
- **Store time with dashboard**: Opens dashboard with the saved time range
instead of the default
## Next Steps
- Learn about [creating visualizations](/dashboards/logs/visualizations) to
build custom panels for your dashboards
- Explore the [logs interface](/logs-visualization) for ad-hoc log analysis
---
## Visualizations
Visualizations are the building blocks of [dashboards](/dashboards/logs/log-dashboards).
They transform your log data into charts, graphs, and other visual formats to
identify trends, track metrics, and analyze patterns.
You can create visualizations directly from the **Visualize** section, or create
them while building a dashboard by selecting **Create new** when adding a panel.
:::tip Try it Live
Explore working examples in the
[Oodle Playground](https://play.oodle.ai/logs/app/visualize)
to see visualizations in action.
:::
## Getting Started
To create a new visualization:
1. Navigate to the **Visualize** section from the sidebar
2. Click **Create visualization**
3. Select a visualization type
4. Choose your index pattern (your log data source)
5. Configure metrics and buckets
6. Save your visualization
## Core Concepts
### Metrics
Metrics determine **what** you're measuring. Common metric types include:
| Metric | Description | Example Use Case |
|--------|-------------|------------------|
| **Count** | Number of documents matching the query | Total logs per minute |
| **Sum** | Total of a numeric field | Total bytes transferred |
| **Average** | Mean value of a numeric field | Average response time |
| **Min/Max** | Minimum or maximum value | Peak memory usage |
| **Unique Count** | Distinct values of a field | Number of unique users |
### Buckets
Buckets determine **how** your data is grouped. Common bucket types include:
| Bucket | Description | Example Use Case |
|--------|-------------|------------------|
| **Date Histogram** | Groups data by time intervals | Logs per hour |
| **Terms** | Groups by field values | Logs per service |
| **Filters** | Groups by custom queries | Error vs Success logs |
| **Range** | Groups numeric values into ranges | Response time buckets |
| **Histogram** | Groups by numeric intervals | Request size distribution |
## Visualization Editor
The visualization editor lets you build charts by configuring filters, time
ranges, and aggregations.
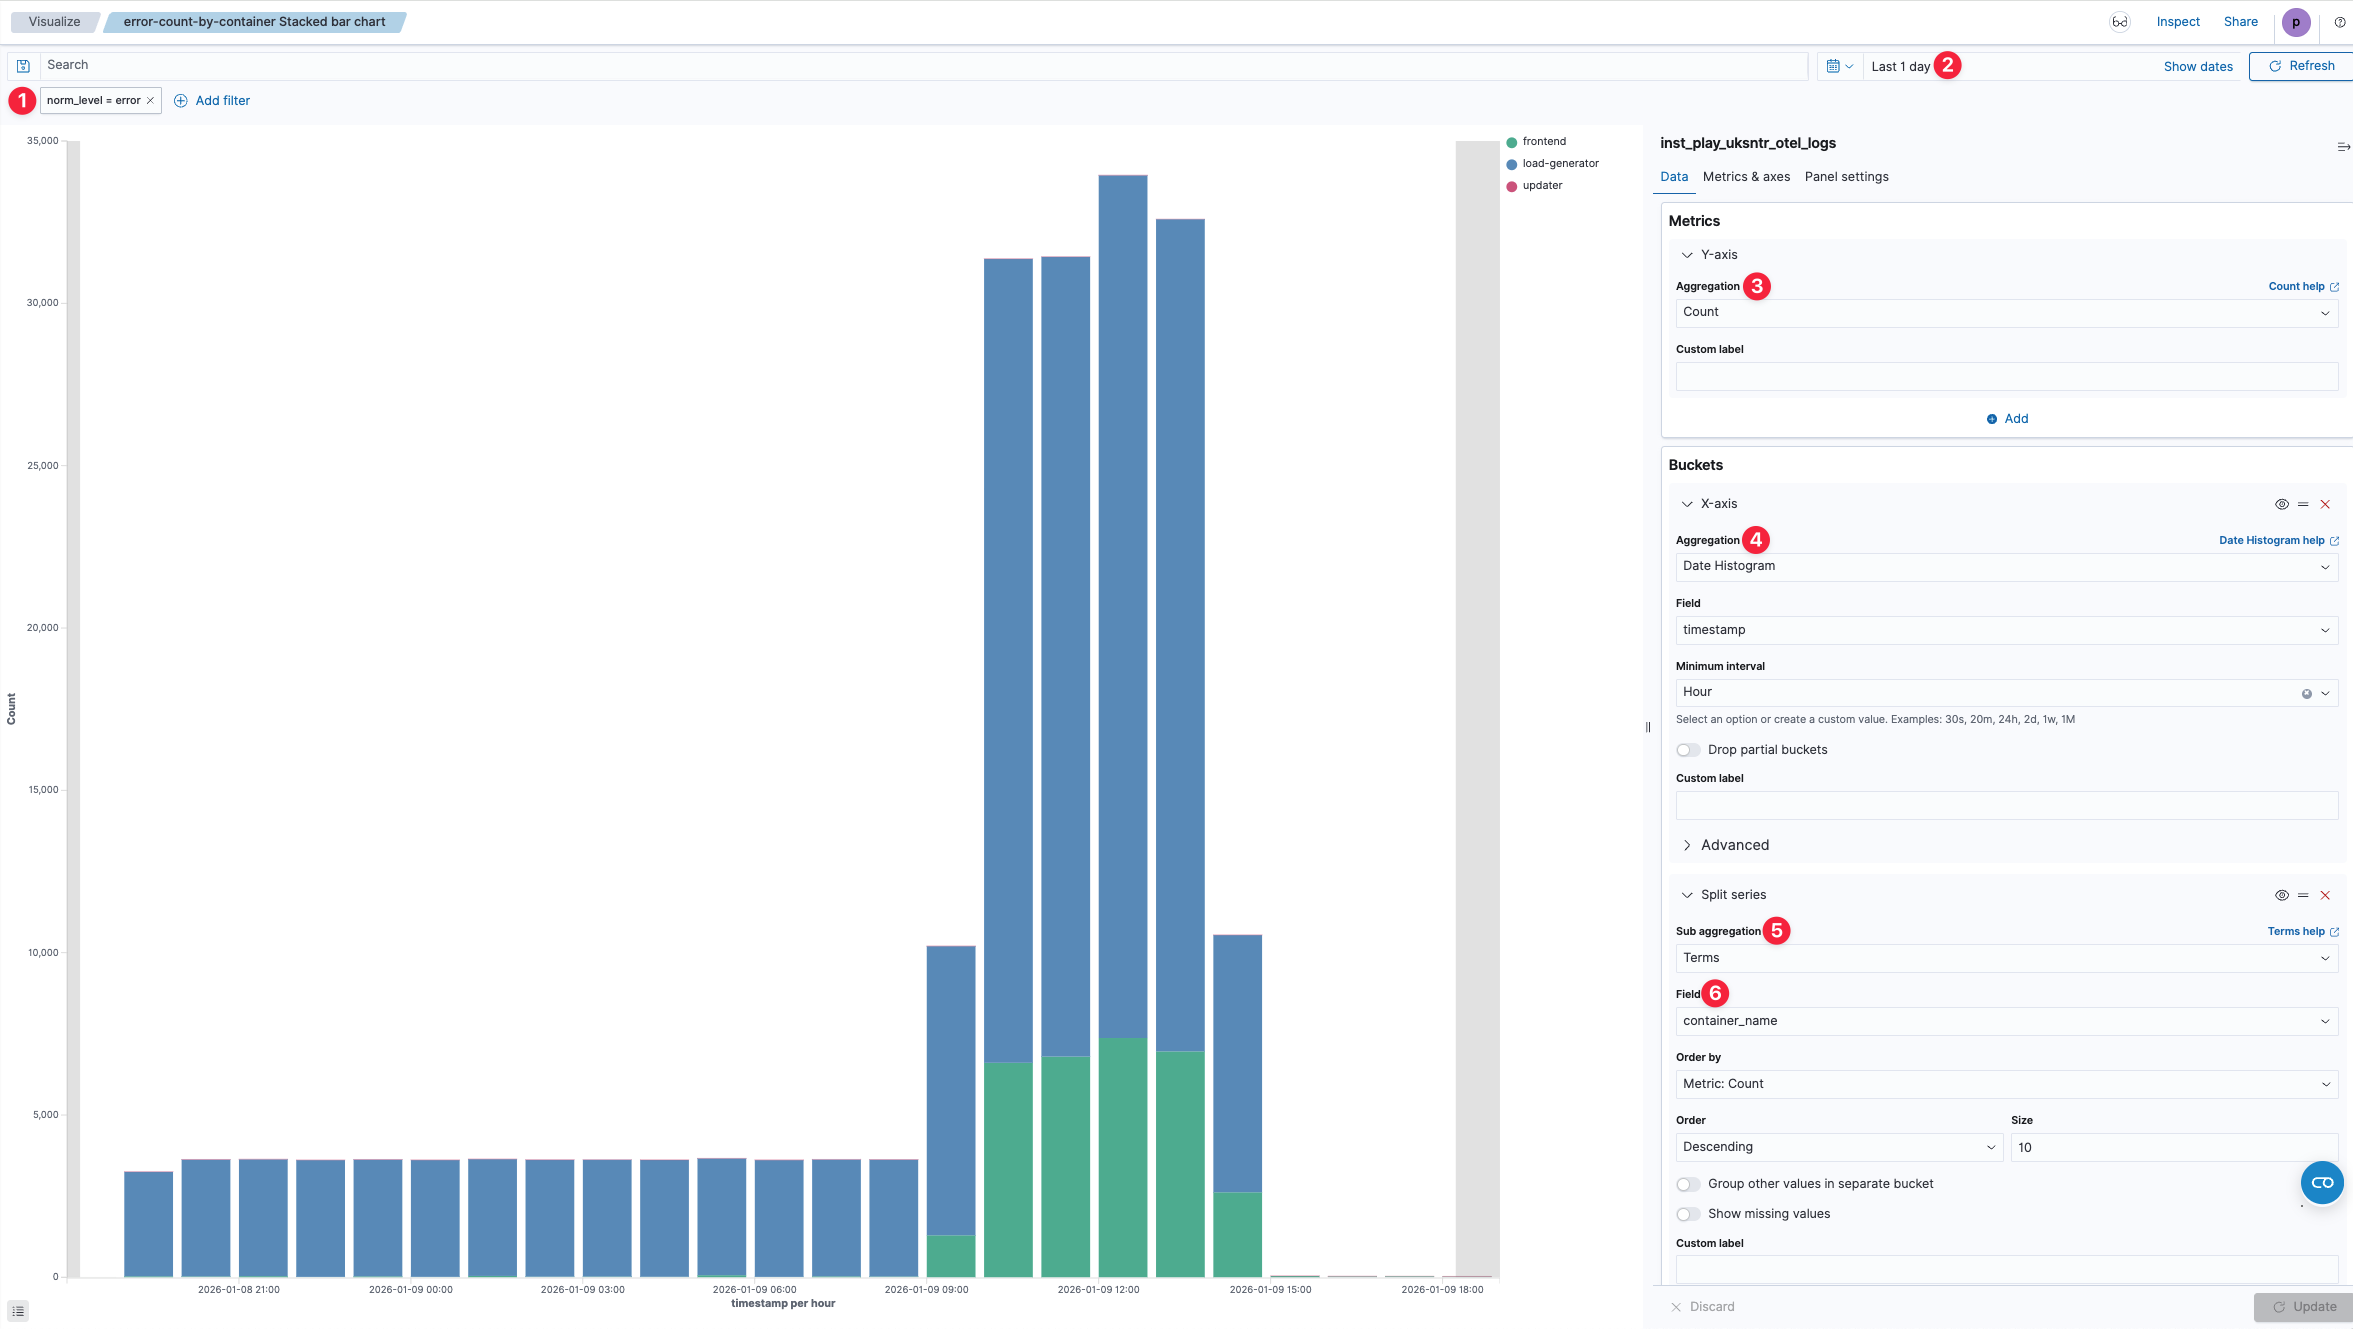
| # | Component | Description |
|---|-----------|-------------|
| 1 | **Filter** | Filter logs to include only data relevant to your visualization. Add multiple filters to narrow down results. |
| 2 | **Time Range** | Set the time window for your data. Use quick selections like "Last 1 day" or define custom ranges. |
| 3 | **Metrics (Y-Axis)** | Choose the aggregation for your Y-axis values. Options include Count, Sum, Average, Min, Max, and more. Scroll to see all available aggregations. |
| 4 | **Buckets (X-Axis)** | Define how data is grouped on the X-axis. Use Date Histogram for time-based charts or Terms for categorical grouping. |
| 5 | **Split Series** | Add a sub-aggregation to break down data into multiple series. Select Terms to split by field values. |
| 6 | **Sub-aggregation Field** | Choose the field to split your series by (e.g., `container_name`, `log_level`, `service`). |
## Visualization Types
### Line Chart
Line charts display data points connected over time, ideal for tracking trends
and identifying patterns in time-series data.
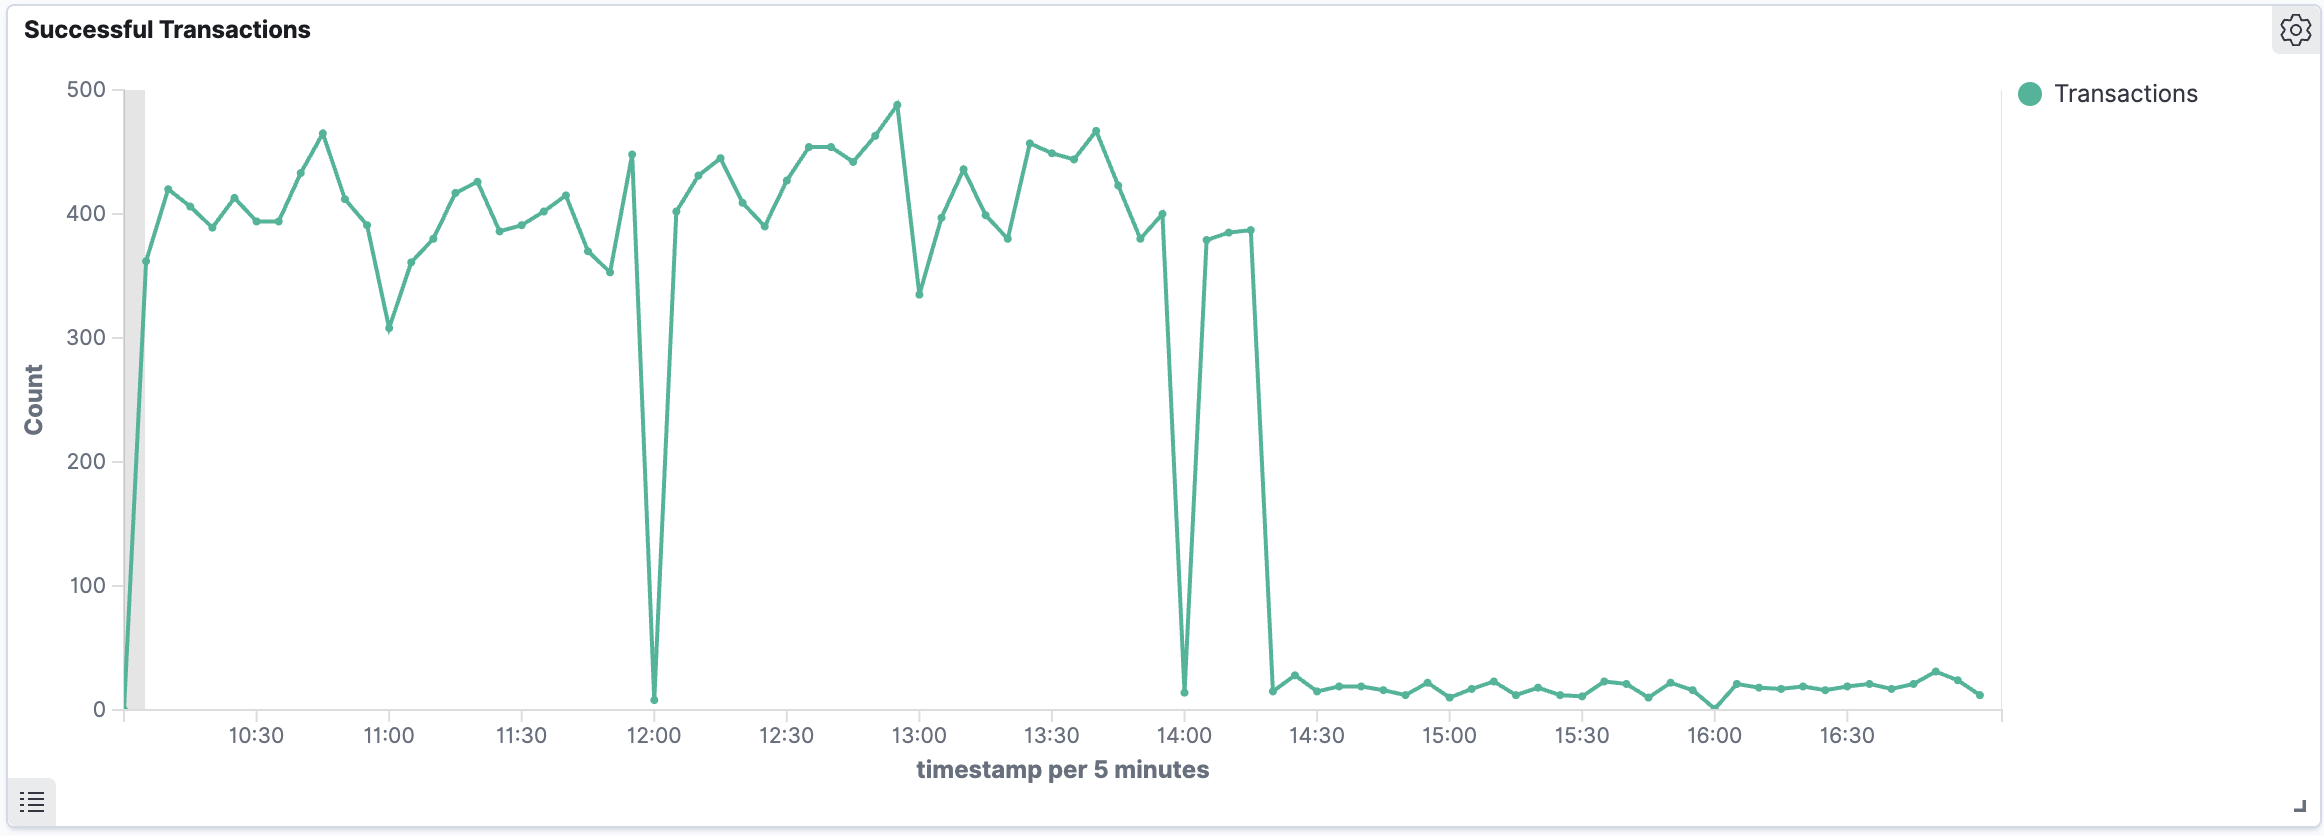
**Best for:**
- Tracking metrics over time (transactions, requests, errors)
- Identifying trends and anomalies
- Comparing before/after changes
**Configuration:**
1. **Metric**: Choose Count (or Sum/Average for numeric fields)
2. **X-Axis**: Add a Date Histogram bucket on your timestamp field
3. **Split Series** (optional): Add a Terms or Filters bucket to compare
multiple series
**Example: Successful Transactions Over Time**
- Metric: Count
- X-Axis: Date Histogram on `timestamp` with auto interval
- Split Series: Filters with query `message:Transaction complete.`
→ [View example in Playground](https://play.oodle.ai/logs/app/visualize#/edit/4ef9c1a0-edc0-11f0-b051-df37cf89c1fe)
---
### Bar Chart
Bar charts compare categorical data across groups or time periods. Stacked bars
show the composition of each group.
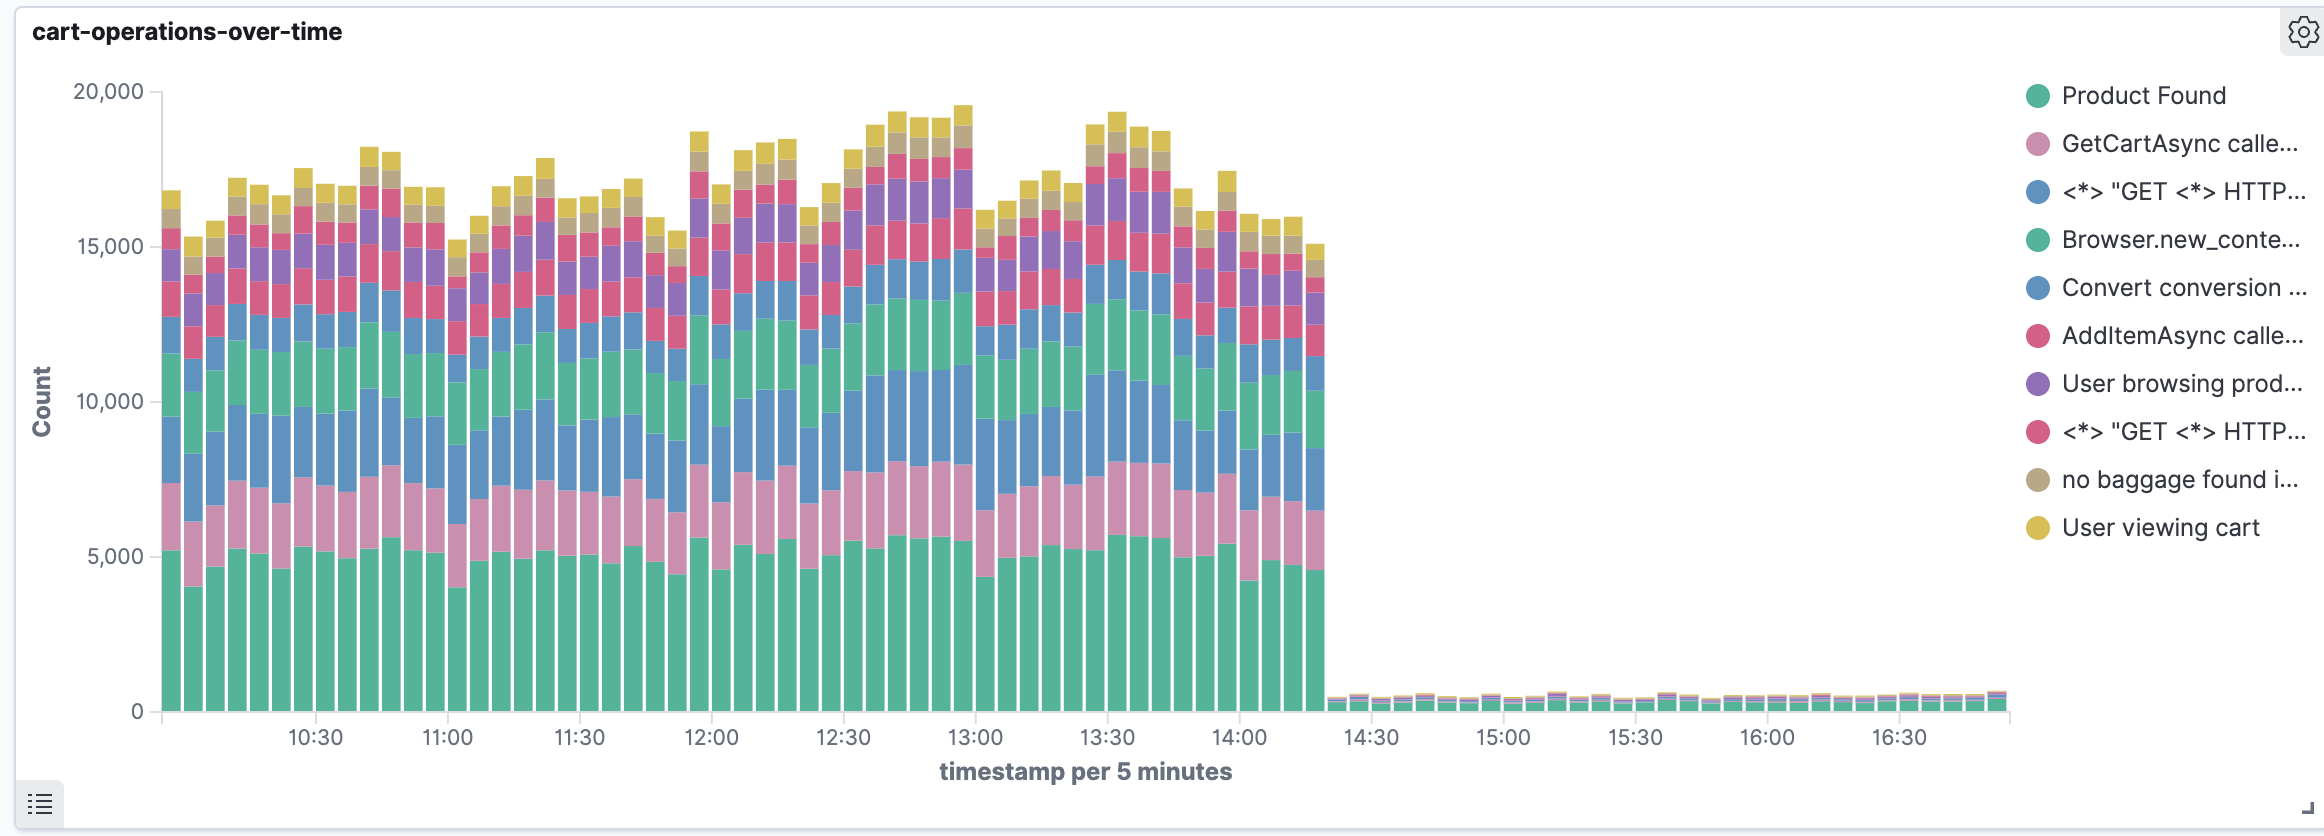
**Best for:**
- Comparing volumes across categories
- Showing composition (stacked bars)
- Analyzing distribution by time with breakdowns
**Configuration:**
1. **Metric**: Count or Sum
2. **X-Axis**: Date Histogram for time-series, or Terms for categories
3. **Split Series**: Terms bucket on a field (e.g., `container_name`,
`log_level`) to stack by category
**Example: Cart Operations Over Time**
- Metric: Count
- X-Axis: Date Histogram on `timestamp` (5-minute intervals)
- Split Series: Terms on `fingerprint.keyword` to see operation types
→ [View example in Playground](https://play.oodle.ai/logs/app/visualize#/edit/900d7c27-e8f8-4d95-9b47-a1773733a924)
---
### Area Chart
Area charts show magnitude over time with filled regions. Stacked area charts
display how parts contribute to a whole.
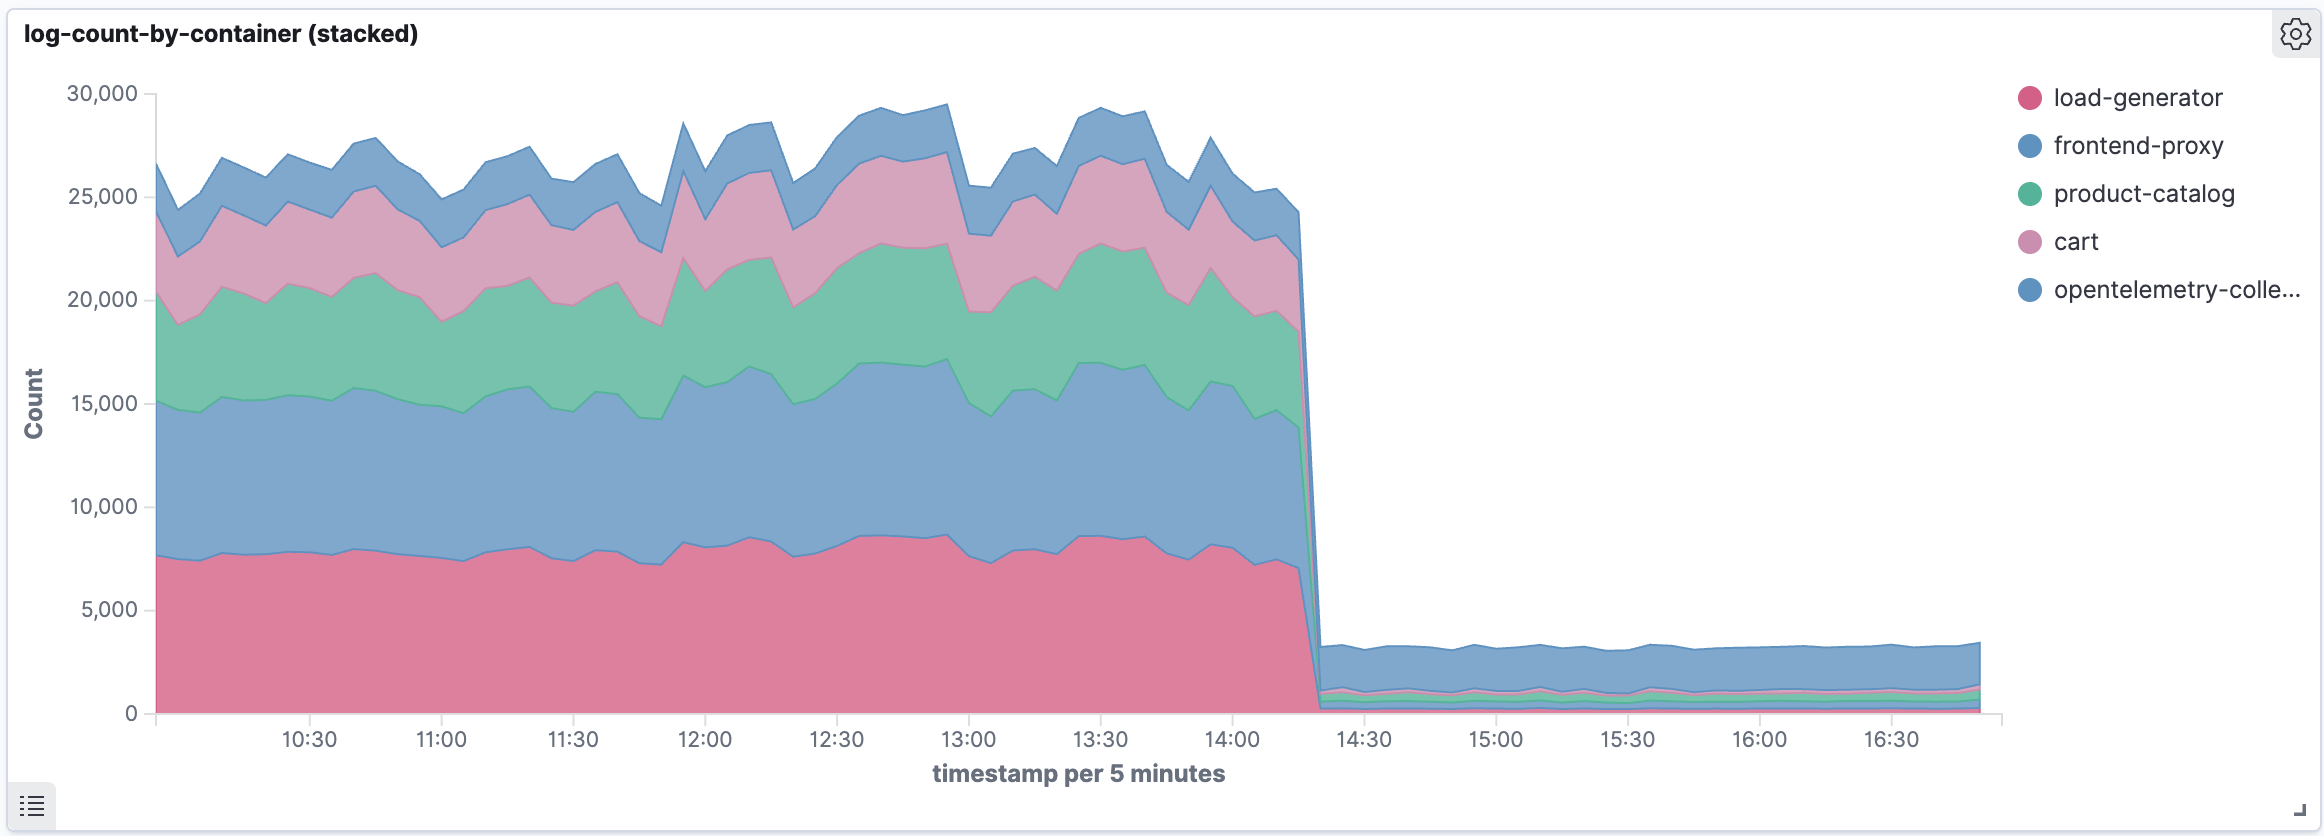
**Best for:**
- Visualizing volume trends over time
- Showing proportional contributions from different sources
- Highlighting sudden changes in data volume
**Configuration:**
1. **Metric**: Count
2. **X-Axis**: Date Histogram on `timestamp`
3. **Split Series**: Terms bucket on a categorical field
4. In **Metrics & axes**, set Chart type to "Area" and enable "Stacked"
**Example: Log Volume by Container**
- Metric: Count
- X-Axis: Date Histogram on `timestamp` (5-minute intervals)
- Split Series: Terms on `container_name.keyword`
→ [View example in Playground](https://play.oodle.ai/logs/app/visualize#/edit/4dbd9c50-edb9-11f0-b051-df37cf89c1fe)
---
### Pie Chart
Pie and donut charts show proportional distribution of data across categories.
**Best for:**
- Showing relative proportions
- Distribution across a small number of categories (≤10)
- Understanding composition at a glance
**Configuration:**
1. **Metric**: Count (or Sum for numeric values)
2. **Split Slices**: Terms bucket on the field to segment by
3. Optionally enable "Donut" mode in Options
**Example: Transactions by Customer Loyalty Level**
- Metric: Count
- Split Slices: Filters bucket with queries for each level:
- `message:Platinum` → label "Platinum"
- `message:Gold` → label "Gold"
- `message:Silver` → label "Silver"
- `message:Bronze` → label "Bronze"
→ [View example in Playground](https://play.oodle.ai/logs/app/visualize#/edit/23a5fa40-edbc-11f0-b901-edc57b66473a)
---
### Metric
Metric visualizations display a single prominent number, ideal for KPIs and
summary statistics.
**Best for:**
- Displaying key performance indicators
- Showing totals or averages at a glance
- Dashboard summary panels
**Configuration:**
1. **Metric**: Count, Sum, Average, or other aggregation
2. **Split Group** (optional): Terms bucket to show multiple metrics side by
side
**Example: Error Count by Service**
- Metric: Count
- Query filter: `log_level:error OR level:ERROR`
- Split Group: Terms on `container_name.keyword` (top 3-5)
→ [View example in Playground](https://play.oodle.ai/logs/app/visualize#/edit/8c3e6f40-edb9-11f0-b051-df37cf89c1fe)
---
### Data Table
Data tables display aggregated data in tabular format, perfect for detailed
breakdowns and exports.
**Best for:**
- Detailed data exploration
- Exporting aggregated data
- Showing exact counts and values
**Configuration:**
1. **Metric**: Count (and additional metrics as needed)
2. **Split Rows**: Terms bucket on the field to list
3. Configure sort order (descending for "top N" lists)
**Example: Top Log Fingerprints**
- Metric: Count
- Split Rows: Terms on `fingerprint.keyword` with size 10
- Sort by Count descending
→ [View example in Playground](https://play.oodle.ai/logs/app/visualize#/edit/7b780660-2b10-11f0-8d5a-b38158070b23)
---
### Heat Map
Heat maps use color intensity to represent value magnitude across two
dimensions, perfect for spotting patterns across time and categories.
**Best for:**
- Identifying activity patterns across time and categories
- Spotting outliers in multi-dimensional data
- Understanding when and where activity occurs
**Configuration:**
1. **Metric**: Count (determines color intensity)
2. **X-Axis**: Date Histogram on `timestamp`
3. **Y-Axis**: Terms bucket on the categorical field
**Example: Log Activity by Container Over Time**
- Metric: Count
- X-Axis: Date Histogram on `timestamp` (1-hour intervals)
- Y-Axis: Terms on `container_name.keyword`
→ [View example in Playground](https://play.oodle.ai/logs/app/visualize#/edit/0d169890-edba-11f0-b051-df37cf89c1fe)
---
## Filtering Data
You can filter visualization data in several ways:
### Query Bar
Enter a Lucene query to filter documents:
```
log_level:error AND container_name:frontend
```
For the full syntax, see
[Query Logs](/logs-visualization#query-logs).
### Filters Aggregation
Use Filters as a bucket type to create labeled segments based on queries:
```
# Filter 1
Query: message:success
Label: Successful
# Filter 2
Query: message:failed OR message:error
Label: Failed
```
### Time Filter
Use the time picker in the top navigation to adjust the time range for all
visualizations.
## Saving Visualizations
1. Click **Save** in the top menu
2. Enter a descriptive title
3. Optionally add to an existing dashboard
4. Click **Save**
Saved visualizations can be:
- Added to multiple dashboards
- Shared with team members
- Used as a template for similar visualizations
## Next Steps
- Combine your visualizations into
[dashboards](/dashboards/logs/log-dashboards) for comprehensive monitoring
views
- Explore the [logs interface](/logs-visualization) for ad-hoc log analysis
---
## Create a Dashboard
This guide walks you through creating a new dashboard in Oodle.
## Create a New Dashboard
1. Click **Dashboards** in the left sidebar.
2. Click the **New** button near the top right of the page.
3. Choose **New dashboard** from the dropdown menu.
Now you should have a new blank dashboard.
## Add a New Panel
1. Click **Add visualization** on the empty dashboard screen to add a new panel.
2. Click **oodle** on the "Select data source" dialog.
## Configure the Panel
Panels come with extensive configuration options. Let's take a look at the
configuration options for [Cluster CPU Utilization panel from Oodle Playground](
https://play.oodle.ai/grafana/d/k8s_views_global/kubernetes-views-global?editPanel=72):
1. See how the panel will look like on the dashboard in the **visualization preview**.
2. Choose the visualization type from the **visualization dropdown**.
3. Write **PromQL query** to fetch the data for the panel,
4. Or use the **query builder** UI to build the query.
5. **Customize the panel** both in appearance and functionality using the provided options.
---
## Dashboard Variables
Dashboard variables allow you to create interactive, dynamic dashboards. They
can be used in queries and panel titles to create dashboards that can be easily
modified to show different data.
## Create a Variable
To add a variable to your dashboard:
1. Click the **Edit** button in the top-right corner of the dashboard.
2. Click the **Settings** button that just appeared.
3. The **Settings** page shows up.
1. Choose the **Variables** tab.
2. This page has link to the detailed documentation for variables if needed.
3. Click **Add variable** button.
In the next section we'll take a deeper look at some of the most useful and commonly used
variable types.
## Types of Variables
Oodle supports all the variable types [supported by Grafana](
https://grafana.com/docs/grafana/latest/dashboards/variables/).
Among those, two most useful and commonly used are **Query**,
and **Ad hoc filters**.
While the [Grafana docs](
https://grafana.com/docs/grafana/latest/dashboards/variables/
) cover the technical details, here we'll focus on how to configure them, and how
to use them in dashboards.
### Query Variable
Query variables are variables that show up as a dropdown in the dashboard, where
the values shown in the dropdown are determined by running a PromQL query.
Let's look at the `namespace` variable in the [Kubernetes / Views / Namespaces](
https://play.oodle.ai/grafana/d/k8s_views_ns/kubernetes-views-namespaces
) dashboard on Oodle Playground.
#### Appearance
This variable appears as a dropdown in the dashboard, where you can select the
kubernetes namespace.
#### Configuration
Here's how the [configuration page for `namespace`](
https://play.oodle.ai/grafana/d/k8s_views_ns/kubernetes-views-namespaces?editview=variables&editIndex=2
) looks like:
1. **Name** specifies the name that will be used in the dashboard to reference the variable.
2. **Query** is used to fetch the variable values, which will be displayed in the dropdown.
In this example, it means:
1. Query the metric `kube_pod_info`
2. Only consider the timeseries where `cluster` label equals the value of `cluster` variable.
Note how configuration of `namespace` variable makes use of another variable, `cluster`.
Also note how `$cluster` is used to reference the `cluster` variable.
3. From the resulting timeseries, take the value of `namespace` label.
4. Take the distinct set of values from the `namespace` label, and populate the dropdown.
3. **Multi-value** allows to select multiple values from the dropdown.
4. **Include All option** allows to include the special "All" value in the dropdown.
5. **Preview of values** shows all the values that will be present in the dropdown.
#### Usage
The [Kubernetes Resource Count panel](
https://play.oodle.ai/grafana/d/k8s_views_ns/kubernetes-views-namespaces?editPanel=32
) uses the `namespace` variable by adding `$namespace` appropriately in all the queries
of the panel that need to filter by namespace:
### Ad-hoc Filters
#### Appearance
Ad-hoc filters show up as double-dropdowns in the dashboard, where you can select:
1. The PromQL label to filter by
2. The value of the label to filter by
#### Configuration
Ad-hoc filters are configured by choosing **Ad-hoc filters** in "Select variable type" dropdown.
#### Usage
Unlike query variables, which need to be referenced in the query using `$variable_name`,
ad-hoc filters don't need to be referenced in the query at all. Instead, they are
automatically applied to all the queries in the dashboard.
---
## Terraform for dashboards
Configure all your Grafana dashboards and folders through terraform.
## Advantages of managing dashboards as code
* They are version-controlled, making changes and rollbacks more transparent
and trackable.
* This approach allows you to standardize dashboard configurations across
environments, eliminating manual errors and drift between staging and
production. You can apply the same dashboard configuration across all your
deployments / environments.
* Terraform's declarative nature also makes it easy to spin up or tear down
dashboards alongside your infrastructure, ensuring your monitoring
visualizations evolve with your stack.
* Integrating dashboard management into your CI/CD pipeline means faster,
more reliable deployments, as your dashboards will always align with the
infrastructure they monitor.
## How
:::info
Use oodle's [Terraform Provider](
https://registry.terraform.io/providers/oodle-ai/oodle/latest/docs/resources/grafana_dashboard)
:::
### Prerequisites
To setup Oodle Dashboards via Terraform files, you'll need the following
values:
- `OODLE_INSTANCE`: Your Oodle instance ID. Go to `Settings` icon ->
`API Keys` page in your Oodle UI to find out. (Oodle UI links:
)
- `OODLE_API_KEY`: Your Oodle API key for authentication. Go to `Settings`
icon -> `API Keys` in your Oodle UI to choose an appropriate key.
(Oodle UI links: )
### Example usage
```hcl
terraform {
required_providers {
oodle = {
source = "registry.terraform.io/oodle-ai/oodle"
}
}
}
# These can also be set as environment variables:
# export OODLE_DEPLOYMENT=https://us1.oodle.ai/
# export OODLE_INSTANCE="my-instance"
# export OODLE_API_KEY="my-api-key"
provider "oodle" {
deployment_url = "https://us1.oodle.ai/"
instance = "my-instance"
api_key = "my-api-key"
}
# Example of creating a Grafana folder and dashboard together
# The dashboard references the folder's UID
resource "oodle_grafana_folder" "my_folder" {
title = "Test Folder"
}
resource "oodle_grafana_dashboard" "test_folder" {
folder = oodle_grafana_folder.my_folder.uid
config_json = jsonencode({
"title" : "My Dashboard Title",
"uid" : "my-dashboard-uid",
"schemaVersion" : 39,
"timezone" : "browser",
"panels" : [
{
"id" : 1,
"type" : "stat",
"title" : "Request Rate",
"gridPos" : {
"h" : 8,
"w" : 12,
"x" : 0,
"y" : 0
},
"targets" : [
{
"expr" : "sum(rate(http_requests_total[5m]))",
"refId" : "A"
}
]
},
{
"id" : 2,
"type" : "timeseries",
"title" : "Error Rate",
"gridPos" : {
"h" : 8,
"w" : 12,
"x" : 12,
"y" : 0
},
"targets" : [
{
"expr" : "sum(rate(http_requests_total{status=~\"5..\"}[5m])) / sum(rate(http_requests_total[5m]))",
"refId" : "A"
}
]
}
]
})
}
# Example of a dashboard with a commit message for version history
resource "oodle_grafana_dashboard" "service_dashboard" {
folder = oodle_grafana_folder.my_folder.uid
message = "Initial dashboard creation"
overwrite = true
config_json = jsonencode({
"title" : "Service Health",
"uid" : "service-health-dashboard",
"schemaVersion" : 39,
"time" : {
"from" : "now-6h",
"to" : "now"
},
"panels" : [
{
"id" : 1,
"type" : "gauge",
"title" : "Uptime",
"gridPos" : {
"h" : 8,
"w" : 8,
"x" : 0,
"y" : 0
},
"targets" : [
{
"expr" : "avg(up{job=\"my-service\"})",
"refId" : "A"
}
]
}
]
})
}
# Example without a folder (created at root level)
resource "oodle_grafana_dashboard" "root_dashboard" {
config_json = jsonencode({
"title" : "Root Level Dashboard",
"uid" : "root-level-dashboard",
"schemaVersion" : 39,
"panels" : []
})
}
```
Apply terraform configuration
```bash
terraform init
terraform apply
```
---
## Metrics Dashboards
Oodle dashboards are a way to query, visualize, and organize metrics to gain
deeper insights into your data at a glance.
## Overview
Let's take a look at the [Kubernetes Overview dashboard on Oodle Playground](
https://play.oodle.ai/grafana/d/k8s_views_global/kubernetes-views-global):
1. **Dashboards button** on the left sidebar provides quick access to Oodle
dashboards.
2. **Dashboard path** shows your current location in the dashboard hierarchy,
including folder structure and dashboard name. You can navigate back through
folders using this breadcrumb trail.
3. **Variables** allow you to filter and refine your view.
4. **Time controls** let you set the time range for dashboard data.
5. **Visualization panels** show the data using a variety of visualizations.
## Explore Further
export const FilteredDocCardList = () => {
const category = useCurrentSidebarCategory();
const filteredItems = category.items.filter(
item => item.label !== 'Metrics Dashboards'
);
return ;
};
---
## Database Hosts
The Hosts tab provides a host-level view of your monitored
database instances, showing key performance and resource
utilization metrics.
## Hosts Table
| Column | Description |
|--------|-------------|
| **Database Host** | Instance hostname or endpoint |
| **Queries/s** | Average queries per second |
| **Total Duration** | Cumulative query execution time |
| **Avg Duration** | Mean query execution time |
| **Max Duration** | Longest single query execution |
| **Rows/s** | Rows processed per second |
| **Avg CPU Utilization** | Average CPU usage percentage |
| **Max CPU Utilization** | Peak CPU usage percentage |
## Filters
The left-hand panel provides:
- **Database Type** — Filter by engine (PostgreSQL, MySQL).
Each type is shown with its logo icon.
- **Version** — Filter by database version.
- **Database Identifier** — Search by DB instance identifier.
## Click to Drill Down
Click a host row to open a detail drawer with:
- **Overview metrics** — CPU utilization, active connections,
queries per second, and replication lag over time.
- **Databases table** — Lists each database on the host with
its size, active connections, commits, rollbacks, and
conflict count.
- **Replication metrics** — Write lag, flush lag, replay lag,
and replication slot delay (when applicable).
## Use Cases
- **Capacity planning** — Identify hosts approaching CPU or
connection limits.
- **Performance debugging** — Correlate host-level resource
spikes with query duration increases.
- **Fleet management** — Compare performance across database
instances to find outliers.
## Related Pages
- [Database Queries](/database-monitoring/queries) — Aggregated
query performance metrics.
- [Database Samples](/database-monitoring/samples) — View
individual query execution events.
---
## Database Monitoring
Oodle Database Monitoring gives you deep visibility into your
database performance. Track query execution times, identify slow
queries, monitor host resource utilization, and analyze query
samples — all from a single interface.
## Getting Started
Navigate to **Database Monitoring** in the sidebar. The default
view opens on the **Queries** tab, which shows an aggregated view
of all database queries.
## Navigation
Database Monitoring is organized into three tabs:
| Tab | Description |
|-----|-------------|
| **[Queries](/database-monitoring/queries)** | Aggregated query performance metrics |
| **[Samples](/database-monitoring/samples)** | Individual query execution samples |
| **[Hosts](/database-monitoring/hosts)** | Database host health and resource usage |
## Filters
Each tab provides a filter sidebar on the left. The **Queries**
and **Samples** tabs share these filters:
- **Host** — Filter by database host.
- **Database** — Filter by database name.
- **User** — Filter by the database user that executed the query.
- **Tables** — Filter by referenced table names.
- **Commands** — Filter by SQL command type
(e.g., SELECT, INSERT).
The **Hosts** tab has its own filters:
- **Database Type** — Filter by engine (PostgreSQL, MySQL).
- **Version** — Filter by database version.
- **Database Identifier** — Search by DB instance identifier.
All tabs include a **time picker** to adjust the observation
window.
## Supported Databases
Oodle Database Monitoring supports:
- **PostgreSQL** (including Aurora PostgreSQL)
- **MySQL** (including Aurora MySQL)
## Best Practices
- **Start with the Queries tab** to identify the most expensive
queries by total duration.
- **Drill into Samples** when you need to see individual
execution plans or parameter values.
- **Monitor Hosts** to detect resource bottlenecks (CPU,
connections) that affect query performance.
- **Set alerts** on key database metrics (query duration, error
rate) to catch regressions early.
## Related Pages
- [Kubernetes](/kubernetes/) — Monitor Kubernetes clusters,
workloads, and pods.
- [Serverless](/serverless/) — Monitor AWS Lambda functions.
---
## Database Queries
The Queries tab shows aggregated performance metrics for every
normalized database query. Use it to identify slow queries, high-
volume queries, and queries that consume the most total database
time.
## Overview Chart
At the top of the page, a time-series chart visualizes the
selected metric over time. Use the dropdown to switch between:
- **Total Duration** — Cumulative execution time across all
executions.
- **Avg Duration** — Mean execution time per query call.
- **Count** — Number of executions.
## Queries Table
Below the chart, the table lists every normalized query:
| Column | Description |
|--------|-------------|
| **Query** | Normalized SQL statement (parameters replaced with placeholders) |
| **Count** | Number of times the query ran in the selected window |
| **Total Duration** | Cumulative execution time with a visual bar |
| **Avg Duration** | Average execution time |
| **Avg Rows** | Average number of rows returned or affected |
| **Cache Hit Ratio** | Percentage of executions served from cache |
| **% Duration** | Share of total database time consumed by this query |
### Sorting
Click any column header to sort. Sorting by **Total Duration**
(descending) is the most effective way to find the queries that
matter most.
### Search
Use the search bar to filter queries by SQL text.
### Column Selector
Click the column-selector button in the toolbar to toggle
additional columns on or off. Hidden by default are
block-level I/O columns such as Avg Shared Blocks Hit/Read,
Avg Local Blocks Hit/Read, and Avg Temp Blocks Read/Written.
These are useful for diagnosing I/O-heavy queries.
### Show Full Query
Toggle **Show Full Query** in the toolbar to expand truncated
SQL statements in the table so you can read the complete query
text without clicking into the detail drawer.
## Filters
The left-hand panel provides:
- **Host** — Filter by database host.
- **Database** — Filter by database name.
- **User** — Filter by the database user that executed
the query.
- **Tables** — Filter by referenced table names.
- **Commands** — Filter by SQL command type
(e.g., SELECT, INSERT).
## Click to Drill Down
Click any query row to see:
- A detailed execution timeline.
- Per-host breakdown of execution statistics.
- Link to related [Samples](/database-monitoring/samples)
for that query.
## Related Pages
- [Database Samples](/database-monitoring/samples) — View
individual query execution events.
- [Database Hosts](/database-monitoring/hosts) — Monitor
host-level performance.
---
## Database Samples
The Samples tab displays individual query execution events
captured from your databases. Unlike the aggregated Queries view,
Samples shows each execution with its exact timestamp, full SQL
statement, and the database instance it ran on.
## Samples Table
| Column | Description |
|--------|-------------|
| **Time** | Exact timestamp of the execution. |
| **Statement** | Normalized SQL statement (displayed in monospace font). |
| **Database Instance** | The host the query ran on. |
| **User** | The database user that executed the query. |
| **Wait Event Group** | The wait-event category — color-coded badges for CPU, IO, Network, and Lock. |
| **Database** | The database name. |
| **Duration** | Execution duration, color-coded by severity. |
| **Application** | The client application name (if reported). |
| **State** | Current state of the query (e.g., active, idle). |
:::tip
The table shows the latest 1,000 samples. If the limit is
reached, a note appears above the table. Narrow the time range
to load more samples.
:::
## Filters
The left-hand panel provides:
- **Host** — Filter by database host.
- **Database** — Filter by database name.
- **User** — Filter by the database user.
- **Tables** — Filter by referenced table names.
- **Commands** — Filter by SQL command type
(e.g., SELECT, INSERT).
### Search
Use the search bar to filter samples by SQL text, host,
database, or user.
## Click to Drill Down
Click any sample row to open a detail drawer showing the full
query text, execution plan (when available), and contextual
details like client application name and user.
## Use Cases
- **Debug slow queries** — Find specific executions that were
abnormally slow and inspect their details.
- **Audit activity** — Review which queries ran at a specific
time against a specific database.
- **Investigate deadlocks** — Examine the exact statements
involved in a deadlock event.
- **Validate deployments** — After a schema migration, verify
that new query patterns appear as expected.
## Related Pages
- [Database Queries](/database-monitoring/queries) — Aggregated
query performance metrics.
- [Database Hosts](/database-monitoring/hosts) — Monitor
host-level performance.
---
## Amazon ECS
Oodle provides a seamless integration with [Elastic Container Service](https://aws.amazon.com/ecs/) and [AWS Fargate](https://aws.amazon.com/fargate/) to ingest **metrics, logs, and traces** from your ECS cluster.
The quickest path for all three signals is the **Datadog Agent**, which ships
metrics, logs, and traces together; see [Datadog Agent](#datadog-agent) below. If
you only need logs, the [log routers](#configuration) (FireLens, OpenTelemetry,
CloudWatch) cover that on their own.
## Datadog Agent
If the [Datadog Agent](https://docs.datadoghq.com/integrations/ecs_fargate/) runs
in your ECS tasks (injected as a sidecar on **Fargate**, or as a daemon task on
**EC2**), point it at Oodle by adding environment variables to the **Agent
container**, with no application changes required. This carries **metrics, logs,
and traces** together, unlike the log-only routers below.
**Dual-write** (Datadog + Oodle) adds Oodle as additional endpoints; keep your
existing `DD_API_KEY` / `DD_SITE`:
```json
"environment": [
{
"name": "DD_ADDITIONAL_ENDPOINTS",
"value": "{\"\": [\"\"]}"
},
{ "name": "DD_USE_V3_API_SERIES_ENABLED", "value": "false" },
{
"name": "DD_LOGS_CONFIG_ADDITIONAL_ENDPOINTS",
"value": "[{\"api_key\": \"\", \"Host\": \"\", \"Port\": 443, \"is_reliable\": false}]"
},
{ "name": "DD_LOGS_CONFIG_FORCE_USE_HTTP", "value": "true" },
{
"name": "DD_APM_ADDITIONAL_ENDPOINTS",
"value": "{\"\": [\"\"]}"
}
]
```
**Single-write** (Oodle only) overrides the Agent's primary endpoints and
authenticates with your Oodle API key:
```json
"environment": [
{ "name": "DD_API_KEY", "value": "" },
{ "name": "DD_DD_URL", "value": "" },
{ "name": "DD_USE_V3_API_SERIES_ENABLED", "value": "false" },
{ "name": "DD_APM_DD_URL", "value": "" },
{ "name": "DD_LOGS_CONFIG_LOGS_DD_URL", "value": ":443" },
{ "name": "DD_LOGS_CONFIG_FORCE_USE_HTTP", "value": "true" }
]
```
:::note
On the **EC2** launch type, also set `DD_ORCHESTRATOR_EXPLORER_ENABLED=false`.
Orchestrator Explorer ships to Datadog's site-based process intake, which
`DD_DD_URL` cannot redirect to Oodle.
:::
For the full reference (Helm/Operator/YAML elsewhere, plus a runnable
`terraform-aws-ecs-datadog` example for Fargate and EC2), see the
[Datadog on ECS guide](/integrations/metrics/datadog#amazon-ecs).
## Configuration
To configure Oodle to ingest logs from your ECS cluster, you'll need the following values:
- `OODLE_INSTANCE`: Your Oodle instance ID. Go to `Settings` icon -> `API Keys` page in your Oodle UI to find out. (Oodle UI links: )
- `OODLE_API_KEY`: Your Oodle API key for authentication. Go to `Settings` icon -> `API Keys` in your Oodle UI to choose an appropriate key. (Oodle UI links: )
- `OODLE_LOGS_HOST`: The Oodle Host for log ingestion. Go to `Settings` -> `Integrations` -> `Logs` -> `Fluent Bit` in your Oodle UI to find out.
- `OODLE_METRICS_HOST`: The Oodle Host for metrics ingestion. Go to `Settings` -> `Integrations` -> `Metrics` -> `Prometheus` in your Oodle UI to find out.
### Using AWS FireLens
If you are using [awslogs](https://docs.aws.amazon.com/AmazonECS/latest/developerguide/using_awslogs.html) log driver to send logs to CloudWatch, [AWS FireLens](https://docs.aws.amazon.com/AmazonECS/latest/developerguide/using_firelens.html) is recommended for routing
logs to external destinations. Oodle uses Fluent Bit with FireLens for routing logs.
#### Customer-Hosted Fluent Bit Configs
It is recommended to host Fluent Bit configs in the customer's S3 buckets as that allows maximum flexibility
in terms of being able to version-control the configs, and modifying the config for specific needs. It also simplifies
ECS task definitions as config files can be directly pulled from customer's S3 bucket.
1. Store your fluent bit config in a S3 bucket. Following is an example config which configures dual-write
of logs to CloudWatch and Oodle, and also send Fluent Bit internal metrics to Oodle. It also adds following filters:
- [multiline](https://github.com/aws-samples/amazon-ecs-firelens-examples/tree/mainline/examples/fluent-bit/filter-multiline-partial-message-mode)
to concatenate partial/split container logs due to container runtime split.
```conf
[INPUT]
name fluentbit_metrics
tag internal_metrics
scrape_interval 2
[FILTER]
name multiline
match *
multiline.key_content log
mode partial_message
[OUTPUT]
Name cloudwatch_logs
Match *
region ${AWS_REGION}
log_group_name ${CLOUDWATCH_LOG_GROUP}
log_stream_name ${CLOUDWATCH_LOG_STREAM}/${ECS_TASK_ID}
auto_create_group true
Retry_Limit 3
[OUTPUT]
Name http
Match *
Host ${OODLE_LOGS_HOST}
Port 443
URI /ingest/v1/logs
Header X-OODLE-INSTANCE ${OODLE_INSTANCE}
Header X-API-KEY ${OODLE_API_KEY}
Format json
Compress gzip
Json_date_key timestamp
Json_date_format iso8601
Tls On
Retry_Limit 3
[OUTPUT]
Name prometheus_remote_write
Match internal_metrics
Host ${OODLE_METRICS_HOST}
Port 443
Uri /v1/prometheus/${OODLE_INSTANCE}/write
Header X-API-KEY ${OODLE_API_KEY}
Log_response_payload True
Tls On
# These environment variables are added by aws-for-fluent-bit init container
add_label ecs_cluster ${ECS_CLUSTER}
add_label ecs_task_arn ${ECS_TASK_ARN}
add_label ecs_task_definition ${ECS_TASK_DEFINITION}
add_label ecs_task_id ${ECS_TASK_ID}
Retry_Limit 3
```
:::note
Depending on your needs, you can update the fluent bit config, e.g. to only send logs to Oodle, you can remove
`cloudwatch_logs` Output section in the config.
:::
2. In the ECS task definition, update the value of `logDriver` from `awslogs` to `awsfirelens` for the application
container.
```json
{
"logConfiguration": {
"logDriver": "awsfirelens"
}
}
```
3. In the ECS task definition, add a Fluent Bit sidecar container to handle log routing. Provide relevant
environment variables referenced in the fluent bit config, and provide fluent bit config via `aws_fluent_bit_init_s3_1`
environment variable.
```json
{
"name": "fluent-bit",
"image": "public.ecr.aws/aws-observability/aws-for-fluent-bit:init-2.32.5.20250305",
"essential": false,
"memory": 200,
"environment": [
{
"name": "OODLE_INSTANCE",
"value": ""
},
{
"name": "OODLE_API_KEY",
"value": ""
},
{
"name": "OODLE_LOGS_HOST",
"value": ""
},
{
"name": "OODLE_METRICS_HOST",
"value": ""
},
{
"name": "CLOUDWATCH_LOG_GROUP",
"value": ""
},
{
"name": "CLOUDWATCH_LOG_STREAM",
"value": ""
},
{
"name": "aws_fluent_bit_init_s3_1",
"value": "/fluent-bit.conf>"
}
],
"firelensConfiguration": {
"type": "fluentbit"
},
"logConfiguration": {
"logDriver": "awslogs",
"options": {
"awslogs-region": "",
"awslogs-group": "",
"awslogs-stream-prefix": ""
}
}
}
```
4. Ensure your ECS [task role](https://docs.aws.amazon.com/AmazonECS/latest/developerguide/task-iam-roles.html) has
permissions to download from S3 bucket.
```json
{
"Version": "2012-10-17",
"Statement": [
{
"Effect": "Allow",
"Action": [
"s3:GetObject",
"s3:GetBucketLocation"
],
"Resource": "*"
}
]
}
```
:::note
If you want to restrict the permissions to the specific bucket where your Fluent Bit configs
are hosted, then you can update `Resource` to `arn:aws:s3:::/*`
:::
5. If you are writing logs from Fluent Bit to CloudWatch as well, then ensure your ECS task role has relevant
CloudWatch permissions as well.
```json
{
"Version": "2012-10-17",
"Statement": [
{
"Effect": "Allow",
"Action": [
"logs:CreateLogGroup",
"logs:CreateLogStream",
"logs:PutLogEvents"
],
"Resource": "arn:aws:logs:::log-group::*"
}
]
}
```
#### Oodle-Hosted Fluent Bit Configs
If you prefer to use Oodle-Hosted Fluent Bit configs, then you can follow steps in this section.
##### Send to CloudWatch and Oodle
In this configuration, ECS application container logs are sent to both CloudWatch and Oodle. Sidecar containers logs
are sent to CloudWatch.
1. In the application container definition, update the value of `logDriver` from `awslogs` to `awsfirelens`.
```json
{
"logConfiguration": {
"logDriver": "awsfirelens"
}
}
```
2. Add an ephemeral volume in the ECS task definition. This volume will be used to store Fluent Bit configuration file
as configured in Step #3.
```json
"volumes": [
{
"name": "config",
"host": {}
}
]
```
3. Add two containers to the ECS task definition:
- An init container to download Fluent Bit configuration file
- A Fluent Bit sidecar container to handle log routing to both CloudWatch and Oodle.
```json
{
"name": "config-init",
"image": "public.ecr.aws/docker/library/alpine:3.21.3",
"essential": false,
"memoryReservation": 64,
"command": [
"sh",
"-c",
"set -e && apk add --no-cache ca-certificates wget && wget -O /oodle/fluent-bit.conf https://oodle-configs.s3.us-west-2.amazonaws.com/logs/ecs/fluent-bit/fluent-bit-cloudwatch-v3.conf || exit 1"
],
"mountPoints": [
{
"sourceVolume": "config",
"containerPath": "/oodle",
"readOnly": false
}
],
"logConfiguration": {
"logDriver": "awslogs",
"options": {
"awslogs-region": "",
"awslogs-group": "",
"awslogs-stream-prefix": ""
}
}
},
{
"name": "fluent-bit",
"image": "public.ecr.aws/aws-observability/aws-for-fluent-bit:init-2.32.5.20250305",
"essential": false,
"memory": 200,
"environment": [
{
"name": "OODLE_INSTANCE",
"value": ""
},
{
"name": "OODLE_API_KEY",
"value": ""
},
{
"name": "OODLE_LOGS_HOST",
"value": ""
},
{
"name": "OODLE_METRICS_HOST",
"value": ""
},
{
"name": "CLOUDWATCH_LOG_GROUP",
"value": ""
},
{
"name": "CLOUDWATCH_LOG_STREAM",
"value": ""
}
],
"mountPoints": [
{
"sourceVolume": "config",
"containerPath": "/oodle",
"readOnly": true
}
],
"dependsOn": [
{
"containerName": "config-init",
"condition": "COMPLETE"
}
],
"firelensConfiguration": {
"type": "fluentbit",
"options": {
"config-file-type": "file",
"config-file-value": "/oodle/fluent-bit.conf"
}
},
"logConfiguration": {
"logDriver": "awslogs",
"options": {
"awslogs-region": "",
"awslogs-group": "",
"awslogs-stream-prefix": ""
}
}
}
```
4. Ensure your ECS [task role](https://docs.aws.amazon.com/AmazonECS/latest/developerguide/task-iam-roles.html)) has relevant
CloudWatch permissions.
```json
{
"Version": "2012-10-17",
"Statement": [
{
"Effect": "Allow",
"Action": [
"logs:CreateLogGroup",
"logs:CreateLogStream",
"logs:PutLogEvents"
],
"Resource": "arn:aws:logs:::log-group::*"
}
]
}
```
##### Send to Oodle Only
In this configuration, ECS application container logs are sent to Oodle only. Sidecar containers logs are sent to CloudWatch.
1. Configure the application container and volume (Steps 1-2 above).
2. Update the `config-init` container definition.
```json
{
"name": "config-init",
"image": "public.ecr.aws/docker/library/alpine:3.21.3",
"essential": false,
"memoryReservation": 64,
"command": [
"sh",
"-c",
"set -e && apk add --no-cache ca-certificates wget && wget -O /oodle/fluent-bit.conf https://oodle-configs.s3.us-west-2.amazonaws.com/logs/ecs/fluent-bit/fluent-bit-v3.conf || exit 1"
],
"mountPoints": [
{
"sourceVolume": "config",
"containerPath": "/oodle",
"readOnly": false
}
],
"logConfiguration": {
"logDriver": "awslogs",
"options": {
"awslogs-region": "",
"awslogs-group": "",
"awslogs-stream-prefix": ""
}
}
}
```
The `config-init` container downloads a simplified configuration file from [fluent-bit-v3.conf](https://oodle-configs.s3.us-west-2.amazonaws.com/logs/ecs/fluent-bit/fluent-bit-v3.conf)
that routes logs exclusively to Oodle.
In addition, environment variables `CLOUDWATCH_LOG_GROUP` and `CLOUDWATCH_LOG_STREAM` can be removed from
the `fluent-bit` container.
#### Optional Configurations
This section documents configurations which can be used if you have the specified use-cases.
##### JSON Logs
If your applications emit logs in json format, then you can add a fluent parser to parse the json logs
before routing them to destinations.
It makes use of [multi-config-support](https://github.com/aws-samples/amazon-ecs-firelens-examples/tree/mainline/examples/fluent-bit/multi-config-support)
and [parse-json](https://github.com/aws-samples/amazon-ecs-firelens-examples/tree/mainline/examples/fluent-bit/parse-json)
capability in AWS for Fluent Bit image.
To add `parse-json` parser in your `fluent-bit` configuration, you can add following environment variable to `fluent-bit`
container:
```json
{
"name": "aws_fluent_bit_init_file_1",
"value": "/fluent-bit/configs/parse-json.conf"
}
```
The default parser used in AWS for Fluent Bit image uses `Time_Format %d/%b/%Y:%H:%M:%S %z` to parse the timestamp from
the logs. If your application logs have a different timestamp format, you can override the json parser. As an example,
if your timestamp format is ISO8601 (`%Y-%m-%dT%H:%M:%S.%LZ`), then you can follow below steps:
1. Update `config-init` container command to download custom json parser related configuration files, add following `wget`
commands in the command used in `config-init` container:
```
wget -O /oodle/parser.conf https://oodle-configs.s3.us-west-2.amazonaws.com/logs/ecs/fluent-bit/fluent-bit-parser-v1.conf && wget -O /oodle/parse-json.conf https://oodle-configs.s3.us-west-2.amazonaws.com/logs/ecs/fluent-bit/fluent-bit-filter-parse-json-iso8601-v1.conf
```
2. Add following environment variables in `fluent-bit` container:
```
{
"name": "aws_fluent_bit_init_file_1",
"value": "/oodle/parser.conf"
},
{
"name": "aws_fluent_bit_init_file_2",
"value": "/oodle/parse-json.conf"
}
```
:::note
Parser definitions needs to be provided as separate file and cannot be merged
with Filter definitions in a single file.
You can choose to store these config files in your S3 bucket as well, and use
`aws_fluent_bit_init_s3_` environment variables to refer to them.
:::
##### Concatenate Partial/Split Container Logs
Container runtime splits log lines larger than 16KB into multiple log lines. Fluent Bit can concatenate these split
log lines using `multiline` filter. To use it, add following filter in your fluent bit configuration:
```conf
[FILTER]
name multiline
match *
multiline.key_content log
mode partial_message
```
:::note
This needs to be first filter in the pipeline so that all remaining filters operate on concatenated log lines.
:::
##### Enrich log lines with additional key-value pair
Say, you want to ingest your dev and prod cluster logs to Oodle. You can enrich each log line with a `environment: dev`
or `environment: prod` field by making following changes:
1. Update `config-init` container command to download custom modify filter configuration file, add following `wget` command
in the command used in `config-init` container:
```
wget -O /oodle/modify-add-field.conf https://oodle-configs.s3.us-west-2.amazonaws.com/logs/ecs/fluent-bit/fluent-bit-modify-add-field-v1.conf
```
2. Add following environment variables in `fluent-bit` container:
```
{
"name": "FIELD_NAME",
"value": "environment"
},
{
"name": "FIELD_VALUE",
"value": "dev"
},
{
"name": "aws_fluent_bit_init_file_1",
"value": "/oodle/modify-add-field.conf"
},
```
:::note
The numbering in `aws_fluent_bit_init_file_*` can be used to add multiple init files, e.g. if you need both
json parsing and enrich field, then you can add all files needed with increasing counter.
:::
### Using OpenTelemetry Collector
Users can run [OpenTelemetry (OTel) Collector contrib](https://github.com/open-telemetry/opentelemetry-collector-contrib) image to send ECS logs to Oodle.
:::note
1. [AWS Distro for OpenTelemetry](https://aws-otel.github.io) image is not supported as it doesn't contain the [Fluent Forward Receiver](https://github.com/open-telemetry/opentelemetry-collector-contrib/blob/main/receiver/fluentforwardreceiver)
required by this configuration.
1. [Fluent Forward Receiver](https://github.com/open-telemetry/opentelemetry-collector-contrib/blob/main/receiver/fluentforwardreceiver)
is currenlty in **beta** status.
:::
#### Send to CloudWatch and Oodle
In this configuration, ECS application container logs are sent to both CloudWatch and Oodle. Sidecar containers logs are sent to CloudWatch.
1. In the application container definition, update the value of `logDriver` from `awslogs` to `awsfirelens`.
```json
{
"logConfiguration": {
"logDriver": "awsfirelens"
}
}
```
Fluent Forward Receiver in OTel collector is used in this configuration. Therefore, the value of `logDriver`
is set to `awsfirelens` and the `firelensConfiguration` type in next step is set to `fluentbit`.
2. Add an OTel collector sidecar container in the ECS task definiton.
```json
{
"name": "otel-collector",
"image": "ghcr.io/open-telemetry/opentelemetry-collector-releases/opentelemetry-collector-contrib:0.121.0",
"essential": false,
"memory": 200,
"environment": [
{
"name": "OODLE_INSTANCE",
"value": ""
},
{
"name": "OODLE_API_KEY",
"value": ""
},
{
"name": "OODLE_LOGS_HOST",
"value": ""
},
{
"name": "CLOUDWATCH_LOG_GROUP",
"value": ""
},
{
"name": "CLOUDWATCH_LOG_STREAM",
"value": ""
}
],
"command": [
"--config",
"https://oodle-configs.s3.us-west-2.amazonaws.com/logs/ecs/otel/otel-config-cloudwatch-v2.yaml"
],
"logConfiguration": {
"logDriver": "awslogs",
"options": {
"awslogs-region": "",
"awslogs-group": "",
"awslogs-stream-prefix": ""
}
},
"firelensConfiguration": {
"type": "fluentbit"
}
}
```
3. Ensure your ECS [task role](https://docs.aws.amazon.com/AmazonECS/latest/developerguide/task-iam-roles.html)) has relevant
CloudWatch permissions.
```json
{
"Version": "2012-10-17",
"Statement": [
{
"Effect": "Allow",
"Action": [
"logs:CreateLogGroup",
"logs:CreateLogStream",
"logs:PutLogEvents"
],
"Resource": "arn:aws:logs:::log-group::*"
}
]
}
```
OTeL collector downloads an [otel-config-cloudwatch-v2.yaml](https://oodle-configs.s3.us-west-2.amazonaws.com/logs/ecs/otel/otel-config-cloudwatch-v2.yaml)
from a public S3 repository owned by Oodle. The config files in this repository are versioned and immutable.
#### Send to Oodle Only
In this configuration, ECS application container logs are sent to Oodle only. Sidecar containers logs are sent to CloudWatch.
1. Configure the application container (Step 1 above).
2. Update the `otel-collector` container definition.
```json
{
"name": "otel-collector",
"image": "ghcr.io/open-telemetry/opentelemetry-collector-releases/opentelemetry-collector-contrib:0.121.0",
"essential": false,
"memory": 200,
"environment": [
{
"name": "OODLE_INSTANCE",
"value": ""
},
{
"name": "OODLE_API_KEY",
"value": ""
},
{
"name": "OODLE_LOGS_HOST",
"value": ""
}
],
"command": [
"--config",
"https://oodle-configs.s3.us-west-2.amazonaws.com/logs/ecs/otel/otel-config-v2.yaml"
],
"logConfiguration": {
"logDriver": "awslogs",
"options": {
"awslogs-region": "",
"awslogs-group": "",
"awslogs-stream-prefix": ""
}
},
"firelensConfiguration": {
"type": "fluentbit"
}
}
```
The `otel-collector` container downloads a simplified configuration file from [otel-config-v2.yaml](https://oodle-configs.s3.us-west-2.amazonaws.com/logs/ecs/otel/otel-config-v2.yaml) that routes logs exclusively to Oodle.
In addition, environment variables `CLOUDWATCH_LOG_GROUP` and `CLOUDWATCH_LOG_STREAM` are also removed from the `otel-collector` container.
## CloudWatch Logs Integration
If you are already sending your ECS logs to CloudWatch and prefer to push logs from CloudWatch to Oodle instead of
modifying your ECS task definitions, you can use our CloudWatch integration.
This approach allows you to keep your existing logging setup while still getting your logs into Oodle.
For detailed instructions on how to set up the CloudWatch to Oodle integration, please refer to
our [CloudWatch integration guide](/integrations/logs/cloudwatch).
---
## Built-in Code Checks
Built-in code checks are code evaluators that Oodle
writes and maintains. You write no code: pick a check,
set its settings, and choose the spans it scores. Like
all code evaluators, they are fast and make no LLM call.
## Use a built-in check
1. Go to **Agent Observability → Evaluators**
()
2. Click **Create Evaluator** and pick a check from
**Built-in checks**
3. Set the check's settings, for example the keywords
that the reply must mention
4. Set the filters, the sampling rate and the hourly
cap, as for any evaluator
5. Click **Save**
Each check is a managed template with the id
`oodle-managed-code--v1`. Use that id as the
template when you create an evaluator through the API
(`evaluatorId`), the CLI or MCP (`templateId`):
```json
{"action": "create_evaluator", "name": "Support replies mention refunds",
"templateId": "oodle-managed-code-keyword-check-v1",
"params": {"required": ["refund"], "mode": "any"}, "enabled": false}
```
The settings of each check are the keyword arguments
of its library function. The
[library reference](./oodle-eval-reference#metrics)
gives each argument and its default. A setting that you
do not set takes that default.
## The checks
The first score of each check is its primary score.
### Format
| Check | Template id | What it scores | Scores | Function |
|-------|-------------|----------------|--------|----------|
| JSON validity | `oodle-managed-code-json-validity-v1` | Output parses as JSON and has the keys, value types and schema you set | `is_json`, `json_schema_ok` | [`json_validity`](./oodle-eval-reference#metrics-json_validity) |
| Regex match | `oodle-managed-code-regex-match-v1` | Output matches every required pattern and none of the forbidden ones | `regex_pass` | [`regex_match`](./oodle-eval-reference#metrics-regex_match) |
| Keyword check | `oodle-managed-code-keyword-check-v1` | Output mentions the required keywords and none of the forbidden ones | `keywords_ok`, `keyword_coverage` | [`keyword_check`](./oodle-eval-reference#metrics-keyword_check) |
| Contains | `oodle-managed-code-contains-v1` | Output contains the values you list, anywhere in the text | `contains` | [`contains`](./oodle-eval-reference#metrics-contains) |
| Length budget | `oodle-managed-code-length-budget-v1` | Output stays inside a word and character range | `within_length` | [`length_budget`](./oodle-eval-reference#metrics-length_budget) |
| Markdown structure | `oodle-managed-code-markdown-structure-v1` | Code fences are closed, tables are even, and the headings, lists and tables you require are there | `markdown_ok`, `heading_count` | [`markdown_structure`](./oodle-eval-reference#metrics-markdown_structure) |
| HTML validity | `oodle-managed-code-html-validity-v1` | The HTML in the output has balanced tags, and only the tags you allow | `html_valid` | [`html_validity`](./oodle-eval-reference#metrics-html_validity) |
| CSV validity | `oodle-managed-code-csv-validity-v1` | Output is CSV with the same number of fields in every row, and the columns you require | `csv_valid`, `row_count` | [`csv_validity`](./oodle-eval-reference#metrics-csv_validity) |
| TOML validity | `oodle-managed-code-toml-validity-v1` | Output parses as TOML and has the keys you require | `toml_valid` | [`toml_validity`](./oodle-eval-reference#metrics-toml_validity) |
| SQL shape | `oodle-managed-code-sql-shape-v1` | Generated SQL is only the statement types you allow, with no write keyword you did not allow | `sql_ok`, `statement_type` | [`sql_shape`](./oodle-eval-reference#metrics-sql_shape) |
### Text quality
| Check | Template id | What it scores | Scores | Function |
|-------|-------------|----------------|--------|----------|
| Readability | `oodle-managed-code-readability-v1` | Flesch reading ease and Flesch-Kincaid grade, with a grade range to enforce | `readability_ok`, `reading_ease` | [`readability`](./oodle-eval-reference#metrics-readability) |
| Language adherence | `oodle-managed-code-language-adherence-v1` | Output is written in the language you expect | `language_match`, `detected_language` | [`language_adherence`](./oodle-eval-reference#metrics-language_adherence) |
### Compare to a reference
These checks compare the output with a **Reference**
setting. In an experiment, a check with no reference
set uses the dataset item's expected output. On a
live span, set the reference.
| Check | Template id | What it scores | Scores | Function |
|-------|-------------|----------------|--------|----------|
| Exact match | `oodle-managed-code-exact-match-v1` | Output equals a reference text | `exact_match` | [`exact_match`](./oodle-eval-reference#metrics-exact_match) |
| Edit similarity | `oodle-managed-code-levenshtein-ratio-v1` | How close the output is to a reference text, by edit distance | `levenshtein_ratio` | [`levenshtein_ratio`](./oodle-eval-reference#metrics-levenshtein_ratio) |
| Word overlap | `oodle-managed-code-jaccard-similarity-v1` | Share of words the output and a reference text have in common | `jaccard_similarity` | [`jaccard_similarity`](./oodle-eval-reference#metrics-jaccard_similarity) |
| ROUGE | `oodle-managed-code-rouge-v1` | ROUGE-L, ROUGE-1 and ROUGE-2 F1 of the output against a reference text | `rouge_l`, `rouge_1`, `rouge_2` | [`rouge`](./oodle-eval-reference#metrics-rouge) |
| BLEU | `oodle-managed-code-bleu-v1` | Sentence BLEU of the output against a reference text | `bleu` | [`bleu`](./oodle-eval-reference#metrics-bleu) |
| Numeric difference | `oodle-managed-code-numeric-diff-v1` | How close the first number in the output is to a reference number | `numeric_diff` | [`numeric_diff`](./oodle-eval-reference#metrics-numeric_diff) |
| JSON difference | `oodle-managed-code-json-diff-v1` | How close the output's JSON is to a reference JSON value, key by key | `json_diff` | [`json_diff`](./oodle-eval-reference#metrics-json_diff) |
### Safety and tone
| Check | Template id | What it scores | Scores | Function |
|-------|-------------|----------------|--------|----------|
| Tone | `oodle-managed-code-tone-v1` | Flags shouting, too many exclamation marks, negative sentiment and banned phrases | `tone_ok`, `sentiment` | [`tone`](./oodle-eval-reference#metrics-tone) |
| Sentiment | `oodle-managed-code-sentiment-v1` | Sentiment of the output from -1 (negative) to 1 (positive), from a word list | `sentiment`, `sentiment_label` | [`sentiment`](./oodle-eval-reference#metrics-sentiment) |
| PII and secret leak | `oodle-managed-code-pii-leak-v1` | Output contains an email, phone, card number, national id, IP address or credential | `pii_free`, `pii_count` | [`pii_leak`](./oodle-eval-reference#metrics-pii_leak) |
| URL check | `oodle-managed-code-url-check-v1` | URLs are well formed, use an allowed scheme and domain, and do not point at a private address | `urls_ok`, `url_count` | [`url_check`](./oodle-eval-reference#metrics-url_check) |
| Prompt injection | `oodle-managed-code-prompt-injection-v1` | The input tries to override the model's instructions, directly or through a tool result | `injection_detected`, `injection_risk`, `injection_signals` | [`prompt_injection`](./oodle-eval-reference#metrics-prompt_injection) |
| Refusal | `oodle-managed-code-refusal-v1` | The model declined to do what it was asked | `refused` | [`refusal`](./oodle-eval-reference#metrics-refusal) |
### Conversation
| Check | Template id | What it scores | Scores | Function |
|-------|-------------|----------------|--------|----------|
| Conversation degeneration | `oodle-managed-code-conversation-degeneration-v1` | The assistant repeats itself, within the reply or across turns | `degenerated`, `degeneration` | [`conversation_degeneration`](./oodle-eval-reference#metrics-conversation_degeneration) |
| Knowledge retention | `oodle-managed-code-knowledge-retention-v1` | The reply asks again for, or contradicts, facts the user already gave | `knowledge_retained`, `knowledge_retention` | [`knowledge_retention`](./oodle-eval-reference#metrics-knowledge_retention) |
### Context and relevance
These checks compare the reply with the retrieved
context. They find the context in this order: the
`context` setting, then the span attribute that
`context_key` names (`context` by default), then the
text of the input messages. `bm25_relevance` and
`tfidf_similarity` compare with the question by
default; set `against` to `context` to compare with
the context.
| Check | Template id | What it scores | Scores | Function |
|-------|-------------|----------------|--------|----------|
| Grounding | `oodle-managed-code-grounding-v1` | Share of the reply's sentences whose words are in the retrieved context | `grounded`, `grounding` | [`grounding`](./oodle-eval-reference#metrics-grounding) |
| Unsupported numbers | `oodle-managed-code-unsupported-numbers-v1` | Numbers and names in the reply that the retrieved context does not have | `numbers_supported`, `unsupported_count` | [`unsupported_numbers`](./oodle-eval-reference#metrics-unsupported_numbers) |
| Citation check | `oodle-managed-code-citation-check-v1` | Every [n] marker and URL in the reply points at a source the context has | `citations_ok`, `citation_count` | [`citation_check`](./oodle-eval-reference#metrics-citation_check) |
| BM25 relevance | `oodle-managed-code-bm25-relevance-v1` | How relevant the reply is to the question or the context, by BM25 | `bm25_relevance` | [`bm25_relevance`](./oodle-eval-reference#metrics-bm25_relevance) |
| TF-IDF similarity | `oodle-managed-code-tfidf-similarity-v1` | Cosine similarity of the reply and the question or the context | `tfidf_similarity` | [`tfidf_similarity`](./oodle-eval-reference#metrics-tfidf_similarity) |
### Agent and cost
The step checks (`span_count`, `error_spans`,
`repeated_tool_calls`, `total_duration`) read the
agent's steps in `ctx.trace.spans`, which an
experiment fills.
| Check | Template id | What it scores | Scores | Function |
|-------|-------------|----------------|--------|----------|
| Tool call validity | `oodle-managed-code-tool-call-validity-v1` | Tool calls have JSON arguments, use allowed tools, and do not loop | `tool_calls_valid`, `tool_call_loop` | [`tool_call_validity`](./oodle-eval-reference#metrics-tool_call_validity) |
| Tool trajectory | `oodle-managed-code-tool-trajectory-v1` | The agent called the tools you expect, in order or as a set | `trajectory_match`, `tool_correctness` | [`tool_trajectory`](./oodle-eval-reference#metrics-tool_trajectory) |
| Step count | `oodle-managed-code-span-count-v1` | How many steps the agent took, from its trace | `span_count`, `within_span_limit` | [`span_count`](./oodle-eval-reference#metrics-span_count) |
| Failed steps | `oodle-managed-code-error-spans-v1` | How many of the agent's steps failed, from its trace | `no_errors`, `error_count` | [`error_spans`](./oodle-eval-reference#metrics-error_spans) |
| Tool call loop | `oodle-managed-code-repeated-tool-calls-v1` | The agent calls the same tool with the same input again and again | `tool_loop`, `most_repeated` | [`repeated_tool_calls`](./oodle-eval-reference#metrics-repeated_tool_calls) |
| Total duration | `oodle-managed-code-total-duration-v1` | How long the agent ran, from its trace | `total_duration_ms`, `within_duration` | [`total_duration`](./oodle-eval-reference#metrics-total_duration) |
| Token and latency budget | `oodle-managed-code-token-latency-budget-v1` | The call stays inside its token, duration and time to first token limits | `within_budget`, `budget_used` | [`token_latency_budget`](./oodle-eval-reference#metrics-token_latency_budget) |
`list_templates` in MCP and `oodle genai templates list`
in the CLI show these templates with the other managed
templates.
## When you need more
- **Change a check's logic.** Start a code template from
the check's starter (the template form offers each
check as a starter), then change the code.
- **Run several checks in one evaluator, or add your own
score.** Call the library functions from your own
template. See the [cookbook](./code-evaluator-cookbook).
- **Compare with a value from the span.** Call a
reference check from your own template and pass
`reference=` from `ctx`. See the
[cookbook](./code-evaluator-cookbook#compare-with-a-reference-value).
Built-in checks need the same account access as other
code evaluators.
---
## Code Evaluator Cookbook
Each recipe is a complete code evaluator. Paste it into
a new code template, click **Run** on a sample span, and
save it. The functions come from the
[`oodle_eval` library](./oodle-eval-reference).
## Built-in check plus your own score
Run a built-in check and add a score of your own. Each
library check returns a list of scores, so add your
score to the list.
This is the same evaluator as an Opik custom metric that
runs `ConversationDegenerationMetric` and adds its own
score:
```python
from oodle_eval.v1 import metrics, text
def evaluate(ctx):
# degenerated (BOOLEAN) and degeneration (0 to 1)
scores = metrics.conversation_degeneration(ctx, threshold=0.6)
reply = text.reply(ctx)
mine = Score(
name="mentions_refund",
value="refund" in reply.lower(),
data_type="BOOLEAN",
higher_is_better=True,
)
return EvaluationResult(scores=scores + [mine])
```
```python
from opik.evaluation.metrics import ConversationDegenerationMetric
from opik.evaluation.metrics import base_metric, score_result
class SupportReply(base_metric.BaseMetric):
def __init__(self, name="support_reply"):
super().__init__(name=name)
self.degeneration = ConversationDegenerationMetric()
def score(self, conversation, **ignored_kwargs):
degeneration = self.degeneration.score(conversation=conversation)
reply = conversation[-1]["content"]
mine = score_result.ScoreResult(
name="mentions_refund",
value=float("refund" in reply.lower()),
)
return [degeneration, mine]
```
In Oodle, the evaluator runs on each chat span as it
arrives. `ctx` holds the conversation: `text.turns(ctx)`
gives the turns as `{"role", "content"}` dicts, and
`text.reply(ctx)` gives the newest reply.
## Weighted quality score
Run several checks and make one 0 to 1 score from them.
Keep the separate scores too, so a drop in the combined
score shows its cause.
```python
from oodle_eval.v1 import combine, metrics
def evaluate(ctx):
readable = metrics.readability(ctx, max_grade=10)
tone = metrics.tone(ctx)
length = metrics.length_budget(ctx, max_words=250)
# The primary score of each check: all BOOLEAN, so all 0 or 1.
primary = [readable["readability_ok"], tone["tone_ok"], length["within_length"]]
quality = combine.weighted_mean(
primary,
weights={"readability_ok": 1, "tone_ok": 2, "within_length": 1},
name="quality",
)
return EvaluationResult(scores=readable + tone + length + [quality])
```
`weighted_mean` reads a `BOOLEAN` score as 0 or 1, and
skips categorical scores and scores with no value. It
uses each value as it is, so give it scores on the same
scale that read the same way. Here that excludes
`reading_ease`, which is 0 to 100. A name that
`weights` does not list has the weight 1.
## Gate on a check
Score the content of a JSON reply only when the reply is
valid JSON. When it is not, return the JSON check alone:
a content score for a reply that did not parse means
nothing.
```python
from oodle_eval.v1 import combine, metrics, text
def evaluate(ctx):
shape = metrics.json_validity(ctx, required_keys=["answer", "sources"])
if not combine.passed(shape["is_json"]):
return EvaluationResult(scores=shape)
data = text.extract_json(text.reply(ctx))
cited = Score(
name="has_sources",
value=isinstance(data, dict) and bool(data.get("sources")),
data_type="BOOLEAN",
higher_is_better=True,
)
return EvaluationResult(scores=shape + [cited])
```
To gate a **different evaluator** on this one, for
example an LLM judge that must run only on valid
replies, use an [evaluator dependency](./dependencies).
## All checks pass
Return one pass or fail score for a set of rules, plus
the separate scores:
```python
from oodle_eval.v1 import combine, metrics
def evaluate(ctx):
checks = (
metrics.pii_leak(ctx)
+ metrics.refusal(ctx)
+ metrics.keyword_check(ctx, forbidden=["guarantee", "promise"])
)
return EvaluationResult(scores=checks + [combine.all_pass(checks, name="safe_reply")])
```
`all_pass` reads each score with `combine.passed`, in
the direction that the score declares. The `refused`
score is lower-is-better, so a reply that refuses fails
the set. A numeric score passes at 0.5 or more (below
0.5 for a lower-is-better score), unless you give `at=`.
## Tool trajectory
Check that an agent called the tools that you expect.
In an experiment, `ctx.trace.spans` holds the agent's
steps. On a live span, the check reads the tool calls in
the span's output.
```python
from oodle_eval.v1 import metrics
def evaluate(ctx):
return EvaluationResult(scores=metrics.tool_trajectory(
ctx,
expected=["search_orders", "issue_refund"],
mode="superset",
))
```
| `mode` | Passes when |
|--------|-------------|
| `strict` | The same calls in the same order |
| `unordered` | The same calls in any order |
| `subset` | Every call is an expected one: no extra tool |
| `superset` | Every expected call happened. Extra calls are allowed |
Make `expected` a [setting](./code-evaluator-settings)
to use one template for many agents:
```python
from oodle_eval.v1 import metrics
def evaluate(ctx):
return EvaluationResult(scores=metrics.tool_trajectory(ctx, **ctx.params))
```
## Use a shared library
Put your team's rules in a
[shared library](./shared-libraries) and import them from
each evaluator. This library holds a banned-phrase list
and a check that uses it:
```python
# shared library "acme_policy"
from oodle_eval.v1 import metrics
BANNED = ["guarantee", "risk-free", "cannot lose"]
def policy_check(ctx):
return metrics.keyword_check(ctx, forbidden=BANNED, name="policy_ok")
```
```python
# code evaluator
from shared.acme_policy import policy_check
from oodle_eval.v1 import metrics
def evaluate(ctx):
return EvaluationResult(scores=policy_check(ctx) + metrics.pii_leak(ctx))
```
When you change `BANNED`, every evaluator that imports
`acme_policy` uses the new list, unless its template
pins an earlier version.
## Combine an LLM judge with a code check
Read the score of an LLM-as-Judge evaluator and a code
check that run on the same span, and write one overall
score. The names are evaluator names from the
Evaluators tab. Oodle runs this evaluator after both of
them. See
[Combine Scores from Other Evaluators](./combine-evaluator-scores).
```python
from oodle_eval.v1 import combine
def evaluate(ctx):
relevance = ctx.score("Answer relevance", default=0.0)
pii_free = ctx.score("PII leak", "pii_free", default=True)
overall = combine.weighted_mean(
[
Score(name="relevance", value=relevance),
Score(name="pii_free", value=pii_free, data_type="BOOLEAN"),
],
weights={"relevance": 3, "pii_free": 1},
name="overall",
)
return EvaluationResult(scores=[overall])
```
## Compare with a reference value
In an experiment, the checks that compare with a
reference use the dataset item's expected output
(`ctx.expected_output`) when you do not pass
`reference`. On a live span there is no expected
output: give the reference as a setting, or read it
from a span attribute.
```python
from oodle_eval.v1 import metrics, text
def evaluate(ctx):
# The expected output in an experiment, else a span attribute.
expected = ctx.expected_output
if expected is None:
expected = text.metadata_value(ctx, "app.expected_answer", default="")
return EvaluationResult(scores=(
metrics.exact_match(ctx, reference=expected, normalize=True)
+ metrics.levenshtein_ratio(ctx, reference=expected)
))
```
## A RAG answer is grounded in its context
Check that a retrieval-augmented answer stays inside what
was retrieved: its sentences use the context's words, its
numbers and names are in the context, and its citations
point at real sources. Then make one pass or fail score.
```python
from oodle_eval.v1 import combine, metrics
def evaluate(ctx):
grounded = metrics.grounding(ctx, threshold=0.8)
numbers = metrics.unsupported_numbers(ctx)
citations = metrics.citation_check(ctx)
checks = grounded + numbers + citations
primary = [
grounded["grounded"],
numbers["numbers_supported"],
citations["citations_ok"],
]
return EvaluationResult(scores=checks + [combine.all_pass(primary, name="rag_ok")])
```
The three checks find the retrieved context in this
order:
1. The `context` argument, when you pass one.
2. The span attribute that `context_key` names
(`context` by default). Pass `context_key=` when
your application writes the context to another
attribute.
3. The text of the input messages: a RAG call usually
puts what it retrieved in its prompt.
---
## Code Evaluator Settings
A code template can declare **settings**: named values
that its code reads from `ctx.params`. Each evaluator
that runs the template sets its own values. One
template then serves many evaluators, and you change a
keyword list or a threshold without a copy of the code.
For example, one "Keyword check" template can run as
two evaluators: one that requires `refund` on support
replies, and one that forbids `guarantee` on sales
replies.
## Declare settings on a template
In the code template form, add a row for each setting
to the **Settings** table below the code. Through the API, the CLI or MCP,
send them as the template's `params` list:
```json
{
"name": "Keyword check",
"type": "code",
"sourceCode": "...",
"params": [
{
"name": "required",
"type": "string_list",
"label": "Required keywords",
"description": "The reply must mention each of these.",
"default": []
},
{
"name": "mode",
"type": "enum",
"options": ["all", "any"],
"default": "all"
},
{
"name": "case_sensitive",
"type": "boolean",
"default": false
}
]
}
```
| Field | Required | Description |
|-------|----------|-------------|
| `name` | yes | The key in `ctx.params`. A lower-case Python name: letters, digits and `_`, up to 64 characters, not starting with a digit |
| `type` | yes | One of the types below |
| `label` | no | The label on the evaluator form |
| `description` | no | Help text on the evaluator form |
| `default` | no | The value when an evaluator does not set one. It must have the setting's type |
| `required` | no | `true` makes each evaluator set a value, unless there is a default |
| `options` | for `enum` | The values an `enum` setting can have |
A template can declare up to 32 settings, and each name
only once.
### Types
| Type | Value in `ctx.params` | Form input |
|------|------------------------|------------|
| `string` | `str` | One line of text |
| `text` | `str` | Several lines of text |
| `number` | `int` or `float` | Number |
| `integer` | `int` (a whole number) | Number |
| `boolean` | `True` or `False` | Switch |
| `string_list` | `list` of `str` | One input for each value. A value can contain commas |
| `enum` | `str`, one of `options` | Drop-down |
| `json` | Any JSON value (dict, list, number, string) | JSON editor |
## Set values on an evaluator
When you create or edit an evaluator on a template
with settings, the form shows one input for each
setting. Through the API, the CLI or MCP, send the
values as the evaluator's `params` object:
```json
{
"name": "Support replies mention refunds",
"evaluatorId": "",
"params": {"required": ["refund"], "mode": "any"}
}
```
Oodle checks the values against the template's
settings when you save the evaluator. It refuses a
value of the wrong type, a name that the template does
not declare, and a missing required value.
## Change the settings of a template
You can add, change and remove settings on a template
that evaluators already use. Oodle refuses the change
(HTTP 409) when an existing evaluator holds a value that
the new settings would not accept: for example, a value
for a setting that you remove, a value of a type that
you change, or no value for a setting that you make
required with no default. The error names the
evaluators. Change their values first, then change the
template.
## What the code gets
`ctx.params` holds every setting that the template
declares:
1. The evaluator's value, if it sets one.
2. Else the setting's default.
3. Else `None`.
So `ctx.params["name"]` never raises `KeyError` for a
declared setting. Code that allows `None` can use
`ctx.params.get("name") or `.
```python
from oodle_eval.v1 import metrics
def evaluate(ctx):
return EvaluationResult(scores=metrics.keyword_check(ctx, **ctx.params))
```
When the setting names are the same as the keyword
arguments of a [library check](./oodle-eval-reference#metrics),
`**ctx.params` passes them all. The
[built-in code checks](./built-in-code-checks) work this
way.
## Settings in tests and experiments
- A test run of a draft template uses the values that
you give for the run, else the defaults.
- An experiment that runs an evaluator uses that
evaluator's values.
- A test run of a draft checks the values against the
settings that you send with it (`paramSpecs`). With
MCP, give `starterId` or `templateId` to use the
settings of a starter or a saved template. An experiment that runs a
template with no evaluator uses the defaults.
- A change to a setting's default changes the value
for every evaluator that does not set its own.
## With the CLI and MCP
```bash
oodle genai templates starters # lists the setting names
oodle genai templates starters keyword-check # a template file with each setting's type and default
oodle genai evaluators get "Refund mentioned" # the values one evaluator sets
```
With MCP, `manage_genai_evaluators` sets values, and
`genai_evaluator_workbench` tries them:
```json
{"action": "update_evaluator", "name": "Refund mentioned",
"params": {"required": ["refund", "return"]}}
{"action": "try_code", "sourceCode": "...",
"paramSpecs": [{"name": "at", "type": "number", "default": 0.5}],
"params": {"at": 0.7}}
{"action": "try_code", "starterId": "keyword-check",
"params": {"required": ["refund"]}}
```
---
## Code Evaluators
Code evaluators score your GenAI spans by running a
short Python function. They are deterministic,
repeatable, and free to run (no LLM call), which makes
them a good fit for structural checks: JSON validity,
required fields, regex and keyword matches, exact
match, and length or format rules.
Each evaluation runs in an isolated microVM, so the
result comes back in milliseconds and your code never
touches other tenants' data.
## Three ways to start
| You want to | Use | Code to write |
|-------------|-----|---------------|
| Run a standard check, such as keywords, PII or JSON validity | A [built-in code check](./built-in-code-checks) | None. Set its settings on the evaluator |
| Combine standard checks with your own rules | The [`oodle_eval` library](./oodle-eval-reference) in your own template | A few lines |
| Score something that is special to your product | Your own `evaluate` function | All of it |
All three run in the same sandbox and write the same
kind of scores. You can also put code that many
evaluators need into a [shared library](./shared-libraries),
give a template [settings](./code-evaluator-settings)
so that one template serves many evaluators, and
[read the scores of other evaluators](./combine-evaluator-scores)
on the same span. The [cookbook](./code-evaluator-cookbook)
has complete examples.
## The `evaluate` Contract
Your source code defines one function, `evaluate(ctx)`,
which returns an `EvaluationResult` holding one or more
`Score` objects. `EvaluationResult`, `Score`, and `ctx`
are provided by the runtime, so there is nothing to
import.
Classes of your own with those names also work, which is
what an evaluator that must run outside Oodle too needs.
The runtime reads the fields the table below lists, and
takes the default for each one your class does not carry.
```python
def evaluate(ctx):
output = str(ctx.observation.output or "")
return EvaluationResult(scores=[
Score(
name="has_output",
value=len(output) > 0,
data_type="BOOLEAN",
),
])
```
### The `ctx` object
| Field | Value |
|-------|-------|
| `ctx.observation.input` | The span's `gen_ai.input.messages` tag. Parsed JSON (a list of messages) when the tag holds JSON, otherwise the raw string |
| `ctx.observation.output` | The span's `gen_ai.output.messages` tag. Parsed JSON when the tag holds JSON, otherwise the raw string |
| `ctx.observation.metadata` | Every other span tag, as a dict of tag name to value. For example `gen_ai.request.model` or your own attributes. In an experiment it also carries `dataset.expected_output`, the item's expected output as text, when the item has one |
| `ctx.trace.spans` | The agent's steps, in order, for an experiment item. Each step is a dict with `name`, `kind` (`llm`, `tool`, `agent` or `span`), `tool_name`, `model`, `input`, `output`, `duration_ms` and `error`. An empty list for a live span |
| `ctx.trace.tools_called()` | The tool name of each `tool` step, in order |
| `ctx.params` | The evaluator's [settings](./code-evaluator-settings), as a dict. Every setting that the template declares is a key. An empty dict when the template declares none |
| `ctx.scores` | The scores that [other evaluators](./combine-evaluator-scores) wrote on the same span, as a dict of evaluator name to a list of scores. An empty dict when the code reads none |
| `ctx.score(name)` | The value of the first score that the evaluator called `name` wrote on this span, or `None` |
| `ctx.experiment` | The dataset item, in an experiment: `item_id`, `expected_output`, `item_metadata` (a dict), `run_id` and `dataset_id`. On a live span every field is `None` and `item_metadata` is `{}` |
| `ctx.expected_output` | Short for `ctx.experiment.expected_output`: the item's expected output, as the dataset stores it (a string or any JSON value). `None` on a live span and on an item without one |
Both `input` and `output` are `None` when the span
carries no value for that tag, so coerce before use
(`str(ctx.observation.output or "")`). The
[`text` helpers](./oodle-eval-reference#text) read the
reply, the user turns and the tool calls out of every
common message shape for you.
### `Score`
| Argument | Required | Description |
|----------|----------|-------------|
| `value` | yes | The score. A float for `NUMERIC`, `True` / `False` for `BOOLEAN`, a string for `CATEGORICAL` |
| `name` | no | Score name shown on the trace. Defaults to the evaluator name. Use it when one evaluator returns several scores |
| `data_type` | no | `NUMERIC` (default), `BOOLEAN`, or `CATEGORICAL` |
| `comment` | no | Free-text explanation stored alongside the score |
| `higher_is_better` | no | Which way the score reads: `True` when a high value is good, `False` when a low value is good. It belongs on the score, not on the evaluator, because one evaluator can return both kinds. Leave it out on a categorical score, or to keep the evaluator's own setting |
A `NUMERIC` score must hold a number. Text needs
`data_type="CATEGORICAL"` and true/false needs
`"BOOLEAN"`: a numeric score holding text fails the
evaluation with `INVALID_RESULT` and scores nothing.
### What `evaluate` can return
- `EvaluationResult(scores=[...])` with a list of
`Score` objects.
- A dict with a non-empty `scores` list, for example
`{"scores": [{"name": "ok", "value": True, "data_type": "BOOLEAN"}]}`.
- The list that a library check returns, or several of
them added together:
`EvaluationResult(scores=metrics.refusal(ctx) + [mine])`.
Return as many scores as you like from one evaluator.
Give each score its own `name`:
```python
def evaluate(ctx):
output = str(ctx.observation.output or "")
return EvaluationResult(scores=[
Score(
name="output_length",
value=min(1.0, len(output) / 500),
comment=f"Length: {len(output)} chars",
),
Score(
name="size_bucket",
value=(
"short" if len(output) < 100
else "medium" if len(output) < 500
else "long"
),
data_type="CATEGORICAL",
),
])
```
## Use the `oodle_eval` library
The `oodle_eval` library is in the sandbox. Import it
like any module:
```python
from oodle_eval.v1 import metrics, text, combine
def evaluate(ctx):
# Two built-in checks. Each returns a list of scores.
scores = metrics.conversation_degeneration(ctx)
scores += metrics.pii_leak(ctx)
# Your own score, from the reply text.
reply = text.reply(ctx)
mine = Score(
name="mentions_refund",
value="refund" in reply.lower(),
data_type="BOOLEAN",
higher_is_better=True,
)
return EvaluationResult(scores=scores + [mine])
```
| Module | What it holds |
|--------|---------------|
| [`metrics`](./oodle-eval-reference#metrics) | The built-in checks as functions. Each takes `ctx` (or a plain string) and keyword settings, and returns a list of scores |
| [`text`](./oodle-eval-reference#text) | Helpers that read the reply, the user turns, the tool calls, JSON and span attributes out of `ctx` |
| [`combine`](./oodle-eval-reference#combine) | Functions that make one score from several: weighted mean, all pass, threshold, and more |
| `util` | The helpers that the checks are built from, for checks of your own |
The checks live in one file for each kind (`metrics/format.py`,
`quality`, `safety`, `conversation`, `similarity`, `context`,
`agent` and `trace`). Import them all from
`oodle_eval.v1.metrics`.
The list that a check returns also finds a score by
its name: `scores.get("pii_free")`,
`scores.value("pii_free")` and `scores.names()`.
Everything under `oodle_eval.v1` keeps its behaviour.
A later release changes it only to fix a bug, so your
scores do not move when Oodle updates the library. The
[library reference](./oodle-eval-reference) lists
every function, its arguments and the score names it
returns. The code editor completes these names as you
type.
## Examples
### Valid JSON output
```python
def evaluate(ctx):
output = str(ctx.observation.output or "")
try:
json.loads(output)
valid = True
except ValueError:
valid = False
return EvaluationResult(scores=[
Score(
name="valid_json",
value=valid,
data_type="BOOLEAN",
),
])
```
### Refusal detection
```python
REFUSAL = re.compile(
r"\b(i can't|i cannot|i'm unable to)\b",
re.IGNORECASE,
)
def evaluate(ctx):
output = str(ctx.observation.output or "")
match = REFUSAL.search(output)
return EvaluationResult(scores=[
Score(
name="refused",
value=bool(match),
data_type="BOOLEAN",
comment=match.group(0) if match else "",
),
])
```
### Reading span metadata
```python
def evaluate(ctx):
meta = ctx.observation.metadata or {}
model = str(meta.get("gen_ai.request.model", ""))
return EvaluationResult(scores=[
Score(
name="model",
value=model or "unknown",
data_type="CATEGORICAL",
),
])
```
More examples are in the [cookbook](./code-evaluator-cookbook).
## Creating a Code Evaluator
1. Go to **Agent Observability → Evaluators**
()
2. Click **Create Evaluator** → **New Template**
3. Select **Code Evaluator**
4. Name the evaluator. Use a `folder/name` prefix
(for example `safety/toxicity`) to group related
evaluators
5. Write your `evaluate` function in the editor, or pick
a starter. A starter is a working example that you
can change. Add [settings](./code-evaluator-settings)
if you want to set values per evaluator
6. Pick a span from **Sample spans** and click **Run**
to execute the code against real data. The result
panel shows the returned scores, or the error and
any `print()` output if the run fails
7. Click **Save**
Then create an evaluation rule from the template to
decide which spans it scores:
1. **Evaluator Name** is the score name that appears on
traces
2. **Settings** are the values for the template's
settings, if it has any
3. **Filter rules** restrict evaluation to spans
matching span labels
4. **Sampling rate** is the percentage of matching
spans to evaluate (1 to 100, default 100)
5. **Max invocations/hour** caps the run rate
(set to 0 for no limit)
6. **Dependencies** run this rule only on spans that
passed earlier rules. See
[Evaluator Dependencies](./dependencies)
Because code evaluators are fast and cost nothing per
run, they work well at 100% sampling, and as a level-0
filter that gates a more expensive LLM-as-Judge rule.
### In experiments
In an experiment, `ctx.expected_output` holds the
dataset item's expected output, and `ctx.trace.spans`
holds the agent's steps. The checks that compare with a
reference use the expected output when you do not set
`reference`, so a template that runs
`metrics.exact_match(ctx)` scores each item against its
own expected output:
```python
from oodle_eval.v1 import metrics
def evaluate(ctx):
return EvaluationResult(scores=metrics.exact_match(ctx, normalize=True))
```
On a live span there is no expected output, so set the
`reference` setting there.
Code evaluators also run in experiments. An experiment
that includes a code evaluator or a built-in code check
needs the same account access as creating one.
## Execution Environment
Each span is evaluated in its own subprocess inside a
Firecracker microVM, with a 5 second time limit and
128 MB of memory. The code has no network access. The
runtime is pure Python with the standard library
modules that are useful for scoring:
`abc`, `array`, `base64`, `binascii`, `bisect`,
`collections`, `contextlib`, `copy`, `dataclasses`,
`datetime`, `decimal`, `difflib`, `enum`, `fractions`,
`functools`, `hashlib`, `heapq`, `hmac`, `itertools`,
`json`, `math`, `numbers`, `operator`, `pprint`,
`random`, `re`, `statistics`, `string`, `struct`,
`textwrap`, `typing`, `unicodedata`, and for parsing
output: `csv`, `html`, `ipaddress`, `tomllib` and
`urllib.parse` (only `parse`: the other parts of
`urllib` open network connections)
It also has `oodle_eval` (the library above) and
`shared` (your team's [shared libraries](./shared-libraries)).
Use absolute imports, such as
`from oodle_eval.v1 import text`. The sandbox checks
each import by its top-level module name, so a
relative import (`from . import x`) fails with
`BLOCKED_IMPORT`.
Anything your code prints is captured and returned with
the result, which makes `print()` the way to debug a
test run.
## Automate with the CLI and MCP
The `oodle` CLI and the Oodle MCP server do the same
operations as the UI. For example, with the CLI:
```bash
# Starters and built-in checks, with their settings
oodle genai templates starters
# The oodle_eval library reference
oodle genai library
# Shared libraries
oodle genai code-libraries list
oodle genai code-libraries get
```
When you create an evaluation rule with the CLI, the
API or the MCP server, its `filters` use the same form
as the UI:
```json
[{"name": "span::gen_ai.operation.name", "type": "eq", "value": "chat"}]
```
- Name an attribute with its kind: `span::` for a span
attribute, `resource::` for a resource attribute
(for example `resource::service.name`). A dotted name
without it is refused, because it would match no
span.
- `type` is `eq`, `neq`, `re`, `nre`, `oneof`,
`not_oneof`, `gt`, `gte`, `lt` or `lte`. `oneof` and
`not_oneof` take a `multi_value` list instead of
`value`. The API stores the type as the number the UI
uses (`eq` as `0`), so a rule reads back with the
number.
An AI agent that uses the Oodle MCP server has two
tools. `genai_evaluator_workbench` reads, tries and
checks evaluators and changes nothing, so every role can
use it. `manage_genai_evaluators` creates, changes and
deletes them, and needs the Editor or Admin role. Each
tool answers `{"action": "help", "topic": "code"}` with
the guidance for a topic.
The agent can read the code that an evaluator can import,
as you would read a codebase before you reuse it: the
`oodle_eval` files and your team's shared libraries.
```json
{"action": "grep_library", "pattern": "def .*refund", "ignore_case": true}
{"action": "library_files", "prefix": "oodle_eval/v1/metrics/"}
{"action": "read_library_file", "path": "shared/acme_text.py", "start_line": 1, "end_line": 80}
{"action": "code_library_reference", "function": "metrics.safety.pii_leak", "source": true}
```
`grep_library` searches with a regular expression and
gives the file, the line number and the line.
`read_library_file` gives up to 200 numbered lines, and
reads a shared library at an earlier `version` too.
A typical run, in order:
1. Search for a check or a helper that already does the
work (`grep_library`, `code_library_reference`).
2. Import it: a check from `oodle_eval.v1.metrics`, a
helper from `oodle_eval.v1.util`.
3. Put code that several evaluators need in a
[shared library](./shared-libraries), and import it
with `from shared. import ...`.
4. Try the draft, with any changed library, before you
save it.
5. Pin library versions on the template where the scores
must not move when a library changes.
```json
{"action": "list_code_starters"}
{"action": "sample_spans", "filters": {"agent_name": "support"}, "start_time": "now-24h"}
{"action": "validate_code", "sourceCode": "...", "paramSpecs": [...]}
{"action": "try_code", "sourceCode": "from shared.acme_text import clean ...",
"libraries": {"acme_text": "def clean(s): ..."}}
```
These go to `genai_evaluator_workbench`. Then, with
`manage_genai_evaluators`, save the template and create
the evaluator paused:
```json
{"action": "create_template", "name": "Refund policy", "type": "code",
"sourceCode": "...", "params": [{"name": "required", "type": "string_list"}]}
{"action": "create_evaluator", "name": "Refund policy", "templateId": "",
"params": {"required": ["refund"]}, "enabled": false}
```
Try the saved evaluator on past spans, turn it on, and
read its health after it has run for a while:
```json
{"action": "try_code", "evaluatorId": "Refund policy", "start_time": "now-7d"}
{"action": "update_evaluator", "name": "Refund policy", "enabled": true}
{"action": "evaluator_health", "evaluator": "Refund policy", "start_time": "now-24h"}
```
`try_code` runs a draft, a starter, a template or an
evaluator on real spans and saves nothing. It takes
spans that you name (`spanIds` from `sample_spans`, or
`traceIds`), a span that you paste (`spanData`, with its
attributes in `tags`), or samples spans from several
traces that match `filters`. Each row gives the scores, or the error
and the printed output when the code fails.
`evaluator_health` gives an evaluator's run count, pass
rate, value histogram, errors by class and example
spans.
## Troubleshooting
| Error | What it means |
|-------|---------------|
| `BLOCKED_IMPORT` | The code imports a module outside the list above, uses a relative import, or calls one of the dynamic-execution builtins (`eval`, `exec`, `open`, `getattr`). Rewrite using the available modules |
| `USER_CODE_ERROR` | The code raised an exception. The message carries the Python traceback, and `logs` carries anything printed before the failure |
| `TIMEOUT` | The evaluation exceeded 5 seconds. Look for unbounded loops or backtracking regexes |
| `MEMORY_EXCEEDED` | The evaluation exceeded 128 MB. Avoid materialising large intermediate lists |
| `INVALID_RESULT` | `evaluate()` returned something other than an `EvaluationResult` (or a dict with a non-empty `scores` list), a score is missing `value`, or a `NUMERIC` score holds a value that is not a number. The message names the score |
| `LIBRARY_NOT_FOUND` | The code imports a shared library that does not exist, or the template pins a version that does not exist. See [Shared libraries](./shared-libraries) |
Run against a sample span in the editor before saving:
the test path and the production path share the same
runtime, so a run that succeeds there succeeds on live
spans.
---
## Combine Scores from Other Evaluators
A code evaluator can read the scores that other
evaluators wrote on the same span. Use this to make one
score from an LLM judge and a code check, to gate an
expensive result on a cheap one, or to write an overall
quality score.
```python
def evaluate(ctx):
# The judge's 0 to 1 score, or 0.0 when there is none.
helpful = ctx.score("Helpfulness", default=0.0)
# The value of the "pii_free" score of the "PII leak" evaluator.
pii_free = ctx.score("PII leak", "pii_free", default=True)
overall = Score(
name="support_quality",
value=float(helpful) if pii_free else 0.0,
higher_is_better=True,
comment="Helpfulness score" if pii_free else "PII in the reply",
)
return EvaluationResult(scores=[overall])
```
## How to read a score
| Expression | Gives |
|------------|-------|
| `ctx.score("Helpfulness")` | The value of the first score that the evaluator wrote, or `None` |
| `ctx.score("PII leak", "pii_free")` | The value of the score called `pii_free`. When the evaluator wrote no score with that name, the value of its first score |
| `ctx.score("Helpfulness", default=0.0)` | The value, or `0.0` when the evaluator wrote no score on this span |
| `ctx.scores.get("PII leak")` | The list of scores that the evaluator wrote, or `None` |
| `ctx.scores["PII leak"]` | The same list. Raises `KeyError` when there is none, so prefer `.get` |
The list finds a score by its name:
`.get("pii_free")` gives the `Score`,
`.value("pii_free", default=None)` gives its value,
and `.names()` gives the names in order.
The key is the **evaluator name** as you see it on the
Evaluators tab. For an LLM-as-Judge evaluator, the list
holds one score with the evaluator's name: its value is
the judge's 0 to 1 score and its comment is the judge's
reasoning.
## Dependencies are automatic
You do not list the evaluators that your code reads.
When you save the evaluator, or the template that it
runs, Oodle finds each name in the code and records a
dependency on that evaluator. The evaluator form shows
them as **Reads scores from**, and the dependency graph
shows them as a separate kind of edge.
Oodle finds a name only when:
- The code reads it as `ctx.scores["Name"]`,
`ctx.scores.get("Name")` or `ctx.score("Name")`.
- The name is a string literal in single or double
quotes. A name that the code builds at run time gets
no dependency and reads nothing.
- The line is not a comment. A read in a commented-out
line does not make a dependency.
Oodle refuses to save an evaluator when:
- A name in the code is not the name of an evaluator in
your instance. The error names it.
- The code reads the evaluator's own name.
- The dependencies make a cycle, for example A reads B
and B reads A. The error shows the cycle, such as
`A → B → A`. Oodle checks cycles over both kinds of
dependency: scores that code reads, and the gate
[dependencies](./dependencies) that you choose.
While other evaluators read an evaluator's scores, you
cannot rename or delete it. The error names the
evaluators that read it. Change their code first.
## When it runs
An evaluator that reads scores runs after every
evaluator that it reads, in the same evaluation cycle.
It runs only on the spans that **every** one of those
evaluators scored. A span that one of them has not
scored yet waits for a later cycle.
This is different from a gate
[dependency](./dependencies):
| | Reads scores (`ctx.scores`) | Gate dependency |
|---|---|---|
| You set it | From the code, automatically | On the evaluator form, by hand |
| Runs on | The spans that every input evaluator scored | Only the spans that the parent evaluator flagged (scored above 0) |
| Gets the parent's scores | Yes, in `ctx.scores` | No |
Use a gate to save cost: an LLM judge that runs only on
the spans that a cheap code check flagged. Use a score
read to combine results.
### The same spans
An evaluator that reads scores and the evaluators that
it reads must have the same filter rules, and every
evaluator that it reads must be enabled. Otherwise the
reader never gets their scores, so a save that breaks
this is refused.
To change the filter rules of such a group, disable the
evaluator that reads the scores first. Then change the
filter rules of every evaluator in the group, and enable
the reader again. The check runs when it is enabled.
## In experiments
In an experiment, Oodle orders the evaluators of the
run so that an evaluator that reads scores runs after
the evaluators that it names, on each item. A run whose
evaluators make a cycle fails with an error that names
them.
## Backfills
A backfill of an evaluator that reads other evaluators'
scores also runs those evaluators, and the evaluators
that they read in turn. In each time slice of the
backfill, the evaluators run in dependency order, so
each input runs before the evaluator that reads it. The
results of the added evaluators are recorded like the
results of the evaluators that you chose.
- The evaluator that reads scores runs only on the spans
that every one of its inputs scored in that slice.
- Gate [dependencies](./dependencies) do not apply in a
backfill: each evaluator runs on every span that
matches its filters.
- The notes of the run list each added evaluator and
the reason, for example
`also ran Helpfulness: Quality reads its scores`. They
also list each evaluator that did not run, because its
evaluators form a cycle or because one of its inputs
could not run.
An added evaluator costs what it costs in any run. An
LLM-as-Judge input makes one judge call for each span
that it scores. Before you start a backfill, the form
shows the added evaluators as **Also runs**.
## Test with simulated scores
A test run has no other evaluators, so give the scores
that the code reads. Send `scores` with the test run: a
map of evaluator name to a list of scores. With MCP
(`genai_evaluator_workbench`):
```json
{"action": "try_code", "sourceCode": "def evaluate(ctx): ...",
"scores": {
"Helpfulness": [{"name": "Helpfulness", "value": 0.8, "data_type": "NUMERIC"}],
"PII leak": [{"name": "pii_free", "value": true, "data_type": "BOOLEAN"}]
}}
```
Without `scores`, `ctx.scores` is empty and
`ctx.score(...)` gives its default, so test that your
code handles a missing score. Always return at least
one score: an empty list fails with `INVALID_RESULT`.
See the [cookbook](./code-evaluator-cookbook#combine-an-llm-judge-with-a-code-check)
for a complete example.
---
## Coming from Another Evaluation Tool
If you wrote evaluators for Opik, Braintrust, LangSmith
or Langfuse, most of what you know carries over. This
page maps their concepts to Oodle's.
## Concepts in common
| Concept | In Oodle |
|---------|----------|
| The function that scores | `evaluate(ctx)` in a code template |
| What it gets | `ctx`: the span's input, output and attributes, the agent's steps in an experiment, the evaluator's settings, and other evaluators' scores. See [the `ctx` object](./code-evaluators#the-ctx-object) |
| What it returns | `EvaluationResult(scores=[Score(...)])`, one or more named scores |
| Score types | `NUMERIC`, `BOOLEAN`, `CATEGORICAL`, and `higher_is_better` on each score |
| Pre-built metrics | [Built-in code checks](./built-in-code-checks), and the same checks as functions in the [`oodle_eval` library](./oodle-eval-reference) |
| Parameters of a scorer | Template [settings](./code-evaluator-settings), with values per evaluator |
| Code that many scorers share | [Shared libraries](./shared-libraries) |
| Combined or composite scores | `combine` in the library, or an evaluator that [reads other evaluators' scores](./combine-evaluator-scores) |
| Online evaluation | An evaluator (rule) with filters, sampling and an hourly cap |
| Offline evaluation | Experiments on a dataset |
| Expected output | `ctx.expected_output` in an experiment. The reference checks use it when you set no `reference`. On a live span, pass a reference as a setting |
The sandbox runs Python with the standard library
modules that are useful for scoring and the
`oodle_eval` library. Each span gets 5 seconds and
128 MB, and the code has no network access. Rewrite a
scorer that calls a model as an
[LLM-as-Judge](./llm-as-judge) evaluator, and combine
its score with code checks by
[reading its scores](./combine-evaluator-scores).
## Opik
| Opik | Oodle |
|------|-------|
| `BaseMetric` subclass with `score(...)` | `evaluate(ctx)` |
| `score_result.ScoreResult(name, value, reason)` | `Score(name=..., value=..., comment=...)` |
| A list of `ScoreResult` from one metric | A list of `Score` in one `EvaluationResult` |
| `Equals`, `Contains`, `RegexMatch`, `IsJson` | `metrics.exact_match`, `metrics.contains`, `metrics.regex_match`, `metrics.json_validity` |
| `LevenshteinRatio`, `SentenceBLEU`, `ROUGE`, `Sentiment` | `metrics.levenshtein_ratio`, `metrics.bleu`, `metrics.rouge`, `metrics.sentiment` |
| `ConversationDegenerationMetric`, `KnowledgeRetentionMetric` | `metrics.conversation_degeneration`, `metrics.knowledge_retention` |
| `AggregatedMetric(metrics=[...], aggregator=...)` | `combine.weighted_mean(scores)`, or your own arithmetic on the list |
| Online evaluation rule | Evaluator with filters and a sampling rate |
A metric that you constructed with arguments, such as
`Contains(case_sensitive=True)`, is a call with keyword
arguments: `metrics.contains(ctx, values=[...], case_sensitive=True)`.
The [cookbook](./code-evaluator-cookbook#built-in-check-plus-your-own-score)
shows an Opik custom metric and the same evaluator in
Oodle side by side.
## Braintrust
| Braintrust | Oodle |
|------------|-------|
| Code scorer `handler(input, output, expected, metadata)` | `evaluate(ctx)`. Read `ctx.observation.input`, `ctx.observation.output` and `ctx.observation.metadata` |
| A number, or `{"name", "score", "metadata"}` | `Score(name=..., value=..., comment=...)` in an `EvaluationResult` |
| `autoevals` `ExactMatch`, `Levenshtein`, `NumericDiff`, `JSONDiff` | `metrics.exact_match`, `metrics.levenshtein_ratio`, `metrics.numeric_diff`, `metrics.json_diff` |
| Scorer `parameters` | Template [settings](./code-evaluator-settings) |
| `project.scorers.create(...)` and pushing functions from the CLI | A code template, created in the UI, with `oodle genai templates create`, or through the API |
| Online scoring rule | Evaluator with filters and a sampling rate |
Where a Braintrust scorer reads `expected`, read
`ctx.expected_output` in an experiment. On live spans,
give the reference as a setting (`reference=`).
## LangSmith
| LangSmith | Oodle |
|-----------|-------|
| `perform_eval(run, example)` | `evaluate(ctx)` |
| `run["inputs"]`, `run["outputs"]` | `ctx.observation.input`, `ctx.observation.output` |
| `example["outputs"]` (reference outputs) | `ctx.expected_output` in an experiment, or a `reference` setting |
| `{"metric_name": score}` with several keys | Several named `Score` objects |
| Composite evaluator (weighted average or sum of feedback keys) | An evaluator that [reads other evaluators' scores](./combine-evaluator-scores) and uses `combine.weighted_mean`, or arithmetic of your own |
| Online evaluation rule | Evaluator with filters and a sampling rate |
A LangSmith composite score has no value when one of its
inputs is missing on a run. In Oodle, an evaluator that
reads scores runs only on the spans that every input
evaluator scored, which gives the same result.
## Langfuse
Oodle's code evaluator contract follows Langfuse's:
`evaluate(ctx)` returns an `EvaluationResult` of `Score`
objects with `name`, `value`, `data_type` and
`comment`. Most Langfuse Python code evaluators run in
Oodle with few changes.
| Langfuse | Oodle |
|----------|-------|
| `ctx.observation.input`, `.output`, `.metadata` | The same |
| `ctx.observation.tool_calls` | `text.tool_calls(ctx)`, which gives `{"id", "name", "arguments"}` dicts |
| `ctx.experiment.item_expected_output` | `ctx.experiment.expected_output`, or the shortcut `ctx.expected_output` |
| `ctx.experiment.item_metadata` | `ctx.experiment.item_metadata` |
| `Score(name, value, data_type, comment)` | The same, plus `higher_is_better` |
| One evaluator's scores in another | [`ctx.scores` and `ctx.score(...)`](./combine-evaluator-scores) |
If your evaluator defines its own `Score` or
`EvaluationResult` dataclasses so that it runs outside
Langfuse, keep them: Oodle reads the fields that it
needs from your classes.
## Move an evaluator
1. Find the checks that the library already has, and
use them. Most heuristic metrics are in
[`metrics`](./oodle-eval-reference#metrics).
2. Move each constant that differs between uses (a
keyword list, a threshold) into a
[setting](./code-evaluator-settings).
3. Move helper code that several scorers share into a
[shared library](./shared-libraries).
4. Run the template on sample spans in the editor, or
with `try_code` in MCP, before you create evaluators.
---
## Evaluator Dependencies
Evaluator dependencies let you chain evaluation rules
into a directed acyclic graph (DAG). A dependent rule
only runs on spans where **all** of its dependencies
scored > 0, saving LLM costs by skipping spans that
fail earlier, cheaper checks.
## How it works
1. The eval-worker builds a DAG from each rule's
`dependsOnRuleIds` field.
2. Rules are sorted into topological levels —
level 0 has no dependencies, level 1 depends only
on level 0, and so on.
3. After each rule runs, the eval-worker records which
span IDs had any score greater than zero.
4. Before running a dependent rule, the worker filters
candidates to only spans that passed **all** of
that rule's dependencies (AND logic).
5. Each rule still applies its own dedup, sampling,
and rate limits on the filtered set.
### What counts as "passing"
A span passes a dependency if **any** numeric score
returned by that rule is greater than zero. Categorical
scores are ignored.
## Example: code filter → LLM deep analysis
```
Code eval: has_output (level 0)
↓
LLM eval: Correctness (level 1)
↓
LLM eval: Deep analysis (level 2)
```
1. `has_output` is a code evaluator that returns 1 if
the span has non-empty output, 0 otherwise. It runs
on all matching spans.
2. `Correctness` depends on `has_output`. It only runs
the LLM judge on spans where the code eval scored
> 0 (i.e., spans that actually have output).
3. `Deep analysis` depends on `Correctness`. It only
runs on spans that passed the correctness check.
This saves LLM costs because the cheap code evaluator
filters out irrelevant spans before the expensive LLM
calls happen.
## Example: Jev gate → LLM judge
```
Jev eval: Grounded? (level 0)
↓
LLM eval: Grounded (Opus) (level 1)
```
1. `Grounded?` is a rule on a
[TypeSafe (Jev)](/agent-observability/llm-connections)
connection. It answers every span for a fraction
of a chat model's price and says how sure it is.
2. `Grounded (Opus)` depends on it. It runs only on
the spans Jev was **unsure** about.
A confident answer, yes or no, never reaches the
second judge, which is where the saving comes from. Raise
**Confidence** on the Jev rule to send more spans on;
lower it to send fewer.
## Multi-dependency example
```
Code eval: has_output (level 0)
Code eval: is_english (level 0)
↓ ↓
LLM eval: Correctness (level 1)
```
`Correctness` depends on both `has_output` and
`is_english`. A span must pass **both** code evaluators
to be evaluated for correctness.
## Setting up dependencies
1. Go to **GenAI → Evaluators → New Evaluator** (or
edit an existing rule).
2. In the **Depends on** section, select one or more
existing rules.
3. The API validates that the new dependency does not
create a cycle. If it does, the save is rejected
with an error.
## Cycle prevention
The system blocks saving any rule that would create a
dependency cycle. For example, if rule A depends on
rule B, you cannot make rule B depend on rule A.
Cycle detection runs both server-side (at save time)
and is enforced by the API, which returns a 400 error
if a cycle is detected.
## Deleting a dependency target
If you try to delete a rule that other rules depend on,
the API returns a 409 Conflict error listing the
dependent rule names. You must first remove the
dependency from those rules before deleting the target.
## Visualizing dependencies
### Dependencies tab
The **Dependencies** tab on the Evaluators page shows
the full DAG across all rules. Each node represents a
rule with its name, type (Code or LLM), and status
(Active or Paused). Edges show the dependency direction.
Click any node to open the evaluator details drawer.
### Drawer subtree view
Inside the evaluator details drawer, the
**Dependencies** tab shows the subtree for the focused
rule — both its upstream dependencies and downstream
dependents. The focused node is highlighted.
## Best practices
- **Same filters recommended:** dependent rules should
share the same span filters for best results. The
eval-worker groups rules by filter set, so
cross-group dependencies work but span overlap may
be limited.
- **Use code evals as first-pass filters:** code
evaluators are fast and cheap. Use them to filter
out irrelevant spans before running LLM judges.
- **Keep the DAG shallow:** deeply nested dependencies
add latency to each eval cycle. Two to three levels
is usually sufficient.
---
## Evaluators
Evaluators automatically score your LLM spans to track
quality, accuracy, and compliance across your GenAI
application. Navigate to **Agent Observability →
Evaluators** ().
## Types of Evaluators
| Type | Best For | Execution | Guide |
|------|----------|-----------|-------|
| **[LLM-as-Judge](./llm-as-judge)** | Nuanced quality assessment, relevance, tone | Calls an LLM to evaluate each span | [Setup guide →](./llm-as-judge) |
| **[Code](./code-evaluators)** | Deterministic checks: regex, JSON schema, exact match, keyword detection | Runs Python code in an isolated microVM, fast and free | [Setup guide →](./code-evaluators) |
## How It Works
1. **Create a template** — define what to evaluate
(LLM prompt or Python code)
2. **Create a rule** — configure which spans to
evaluate, sampling rate, and filters
3. **Scores appear** on the Traces page, attached to
each evaluated span
## When to Use Each Type
**Use LLM-as-Judge when:**
- You need subjective assessment (relevance,
helpfulness, tone)
- The evaluation criteria are hard to express as code
- You want natural-language reasoning with each score
- You want to use one of the 8
[built-in templates](./llm-as-judge#built-in-templates)
(hallucination, relevance, correctness, etc.)
**Use Code Evaluators when:**
- You need deterministic, repeatable checks
- Speed and cost matter (no LLM API call needed)
- You're validating structure (JSON schema, required
fields, format)
- You want exact match, regex, or keyword detection
- You want one of the
[built-in code checks](./built-in-code-checks)
(PII, tone, refusal, conversation degeneration, etc.),
which need no code
## Evaluators Page
The evaluators page has three tabs:
### Evaluators Tab
Shows all active evaluation rules. Each row displays
the rule name, status (Active / Paused), 24-hour
evaluation cost, and timestamps. Click a rule to open
a detail drawer with a score-over-time chart,
execution logs, and the full configuration.
Use the sidebar to filter by status (Active / Paused)
and evaluator name.
### Library Tab
Browse all available templates: the built-in managed
templates and any custom templates your team has
created. Click a template to see its full prompt
or code, variables, and the rules using it.
The built-in LLM-as-Judge templates cover common evaluation
criteria:
- Hallucination
- Helpfulness
- Relevance
- Toxicity
- Correctness
- Conciseness
- Context Relevance (RAG)
- Faithfulness (RAG)
See the [LLM-as-Judge guide](./llm-as-judge) for
details on each template. The built-in code checks are
listed in [Built-in Code Checks](./built-in-code-checks).
### Scores Tab
View all scores produced by evaluators. Filter by
time range, score name, value range, and span labels.
Click any row to open the corresponding trace detail.
## Prerequisites
- LLM-as-Judge evaluators require an
[LLM Connection](/agent-observability/llm-connections)
- Code evaluators have no external dependencies
- Creating evaluators requires the **Editor** or
**Admin** role
---
## LLM-as-Judge Evaluators
LLM-as-Judge evaluators use a language model to
score your GenAI spans. They are ideal for
subjective assessments like relevance, helpfulness,
and tone that are hard to express as deterministic
code.
## Built-in Templates
Oodle includes eight managed evaluator templates
ready to use out of the box. Each returns a score
from 0 to 1 with reasoning.
| Template | Variables | What it measures |
|----------|-----------|------------------|
| **Hallucination** | query, generation, context | Whether the output is grounded in the query and context |
| **Helpfulness** | query, generation | How helpful and complete the answer is |
| **Relevance** | query, generation | How relevant the output is to the query |
| **Toxicity** | generation | Presence of toxic content, hate speech, or profanity |
| **Correctness** | query, generation, ground_truth | Factual correctness against a known answer |
| **Conciseness** | query, generation | Brevity without losing completeness |
| **Context Relevance** | query, context | Whether retrieved context is relevant to the query (RAG) |
| **Faithfulness** | generation, context | Whether the output stays faithful to the context (RAG) |
Managed templates cannot be edited or deleted.
## Creating a Custom Template
1. Go to **GenAI → Evaluators**
()
2. Click **Create Evaluator** → **New Template**
3. Select **LLM as a Judge**
4. Enter a name and write your evaluation prompt
using `{{variable}}` placeholders
5. Click **Save**
The template automatically appends return
instructions that ask the model to respond with
a JSON score (0–1) and reasoning.
### Writing Effective Prompts
Use `{{variable}}` syntax to reference span data.
Common variables:
- `{{query}}` — the user's input
- `{{generation}}` — the model's output
- `{{context}}` — system instructions or
retrieved context
Example:
```text
You are an expert evaluator.
Score the following output on a scale of 0 to 1
based on whether it directly answers the question.
User query: {{query}}
LLM output: {{generation}}
```
## Judging with Jev
A rule whose connection is **TypeSafe (Jev)** runs the
same template through Jev instead of a chat model.
Jev takes the evidence and the question separately,
so write the prompt as one yes/no question and refer
to the variables by name:
```text
Does {{generation}} answer {{query}} without
inventing facts?
```
Each `{{variable}}` is sent to Jev as a field, and
the question reads `Does generation answer query
without inventing facts?`.
The rule form shows the same **Decision** settings an
[experiment on Jev](/agent-observability/llm-connections)
has, because the two are set up alike:
| Setting | What it does | Score written |
|---------|--------------|---------------|
| **Decision: Yes / no** | the question is answered with P(yes) | numeric, P(yes); keep **Higher is better** on when yes is the good answer and off when it is not (`Is {{generation}} toxic?`) |
| **Decision: One of a set of options** | Jev picks one of the options you list | categorical, the option |
| **Decision: A level on an ordered scale** | Jev places the answer on your levels | numeric, where on the scale it landed |
| **Threshold** (yes/no only) | P(yes) at or above which the answer reads "yes"; 0.5 unless set | |
| **Confidence** | how sure Jev has to be for its answer to be final; 0.7 unless set | |
Jev also reports how sure it is. The score comment
says the answer, or `unsure`. For
[dependent rules](/evaluators/dependencies) an unsure
verdict is the finding and a confident one, either
way, is final: a more expensive judge chained behind
Jev sees only what Jev could not decide. **Confidence**
is that line, on a 0–1 scale. Through the API the
settings are `modelParams.decision` on the rule:
`{"type": "noul", "threshold": 0.15, "confidence": 0.8}`.
## Creating an Evaluation Rule
After selecting a template (built-in or custom),
configure how it runs:
1. **Name** — the score name that appears on traces
2. **LLM Connection** — which provider to use for
evaluation
([configure here](/agent-observability/llm-connections))
3. **Model** — which model runs the evaluation
4. **Variable mapping** — map template variables to
span fields
5. **Sampling rate** — percentage of matching spans
to evaluate (1–100%, default 100%)
6. **Max invocations/hour** — rate cap to control
cost (default 100, set to 0 for no limit)
7. **Filter rules** — optional span label filters
to restrict which spans are evaluated
Click **Create** to activate the rule.
## Variable Mapping
Each `{{variable}}` in the template prompt maps to a
span field. Oodle auto-assigns sensible defaults:
| Variable | Default field |
|----------|---------------|
| `query`, `input` | `gen_ai.input.messages` |
| `generation`, `output` | `gen_ai.output.messages` |
| `context`, `system` | `gen_ai.system_instructions` |
| `ground_truth` | `expected_output` |
You can override any mapping by selecting a
different span tag from the dropdown. Add an
optional **JsonPath** expression (e.g.
`$[0].content`) to extract a nested value from
JSON fields.
Use the **Preview** toggle with a sample span to
verify that variables resolve correctly before
creating the rule.
## Managing Evaluators
### Evaluators Tab
The main tab shows all active evaluation rules.
Each row displays the rule name, status
(Active / Paused), 24-hour cost, and timestamps.
Click a rule to open a detail drawer with:
- **Score over time** chart (1h / 6h / 24h / 7d /
30d)
- **Execution logs** with per-span score, reasoning,
and trace links
- **Configuration** summary (connection, model,
template, mappings)
### Library Tab
Browse all templates — managed and custom. Click
any template to see its full prompt text, variables,
and the list of rules using it. Use **Use this
evaluator** to create a new rule from the template.
### Scores Tab
View all scores produced by evaluators across a
configurable time range. Filter by score name,
value range, and span labels. Click any row to open
the trace detail.
---
## oodle_eval Library Reference
{/* Generated by scripts/gen-code-eval-reference.mjs from the
api-server manifest. Do not edit: run the script. */}
# `oodle_eval` Library Reference
Code evaluators can import the `oodle_eval` library. It holds
the built-in checks as functions, helpers that read text and
tool calls out of a span, and functions that combine scores.
See [Code Evaluators](./code-evaluators) for how an evaluator
runs, and the [Cookbook](./code-evaluator-cookbook) for
complete examples.
Version: `1.0.0`
```python
from oodle_eval.v1 import metrics, text, combine
```
Everything under `oodle_eval.v1` keeps its behaviour: a later
release changes it only to fix a bug. A change that would move
your scores goes into a new version module, so an evaluator
that imports `v1` gives the same scores after an upgrade.
Each function in `metrics` takes the evaluation context `ctx`
(or a plain string) as its first argument, takes its settings
as keyword arguments, and returns `Scores`: a list of `Score`
objects with the primary score first. Add the lists together
to return scores from several checks.
## The evaluation context
| Path | Value |
|---|---|
| `ctx.observation.input` | The span's input: a string, a message list (OpenAI, Anthropic or OpenTelemetry gen_ai shape) or any JSON value. |
| `ctx.observation.output` | The span's output, in the same shapes as the input. A structured output or tool result arrives parsed. |
| `ctx.observation.metadata` | The span's attributes as a dict. A numeric attribute can carry a type suffix, such as duration_ms_int. |
| `ctx.trace.trace_id` | The trace id. Empty for a live span. |
| `ctx.trace.spans` | The agent's steps on an experiment item: dicts with name, kind (llm, tool, agent or span), tool_name, model, input, output, duration_ms and error. Empty for a live span. |
| `ctx.trace.tools_called()` | The tool name of each tool step in ctx.trace.spans, in order. |
| `ctx.params` | The evaluator's settings as a dict: the value set on the evaluator, else the template's default, else None. Every setting the template declares is a key. |
| `ctx.experiment` | The dataset item on an experiment run: item_id, expected_output, item_metadata, run_id and dataset_id. Every field is None (metadata {}) on a live span. |
| `ctx.expected_output` | Short for ctx.experiment.expected_output: the item's expected output, or None on a live span. Checks that compare against a reference use it when their reference setting is empty. |
| `ctx.scores` | The scores other evaluators wrote on the same span, as {evaluator name: Scores}. The evaluator runs after the ones its code names here. Use ctx.scores.get(name): an evaluator with no score on the span is not a key. |
| `ctx.score(evaluator, score_name=None, default=None)` | The value of one score another evaluator wrote: the score called score_name, else its first score, else default. |
## Runtime types
`Score` and `EvaluationResult` are already in the globals of
your evaluator code. Import the others, and import all of them
in a shared library, from `oodle_eval.runtime`.
### `Score` {#runtime-score}
```python
Score(value, data_type='NUMERIC', comment=None, name=None, higher_is_better=None)
```
```text
One named score.
Args:
value: A number for NUMERIC, True or False for BOOLEAN,
or a string for CATEGORICAL.
data_type: "NUMERIC", "BOOLEAN" or "CATEGORICAL".
comment: A short reason, shown next to the score.
name: The score name. An evaluator that returns more
than one score must name each.
higher_is_better: Which way is good for this score. None
uses the evaluator's own declaration.
```
### `EvaluationResult` {#runtime-evaluationresult}
```python
EvaluationResult(scores)
```
```text
What `evaluate(ctx)` returns.
Args:
scores: A list of `Score` (a `Scores` is a list).
```
### `Scores` {#runtime-scores}
```python
Scores(iterable=())
```
```text
A list of `Score` that also finds a score by its name.
Every built-in check returns one. It is a list, so
`scores + [Score(...)]` and `EvaluationResult(scores=scores)`
work as they do for a list. `scores["name"]` gives the score
of that name (KeyError when there is none); an int index
still gives the score at that place.
```
### `EvaluationContext` {#runtime-evaluationcontext}
```python
EvaluationContext(observation, trace=None, params=None, scores=None, experiment=None)
```
```text
What `evaluate(ctx)` gets.
Args:
observation: The `ObservationContext` under evaluation.
trace: The `TraceContext`. Empty for a live span.
params: The evaluator's settings, resolved: the value set
on the evaluator, else the template's default, else
None. Every setting the template declares is a key.
An empty dict when the template declares none.
scores: The scores other evaluators wrote on the same
span, as {evaluator name: Scores}. Only evaluators
the code names in `ctx.scores[...]`,
`ctx.scores.get(...)` or `ctx.score(...)` are here.
An empty dict when there are none.
experiment: The `ExperimentContext` of an experiment item.
Empty (every field None, metadata {}) on a live span.
```
### `ObservationContext` {#runtime-observationcontext}
```python
ObservationContext(input=None, output=None, metadata=None)
```
```text
The span or dataset item under evaluation.
Args:
input: The input, as the span stored it: a string, a
message list or any JSON value.
output: The output, in the same shapes as `input`.
metadata: The span's attributes, as a dict.
```
### `TraceContext` {#runtime-tracecontext}
```python
TraceContext(trace_id='', spans=None)
```
```text
The agent's trace, as ordered steps.
Args:
trace_id: The trace id. Empty for a live span.
spans: A list of dicts with name, kind (llm, tool, agent
or span), tool_name, model, input, output,
duration_ms and error. Filled for an experiment
item; empty for a live span.
```
### `ExperimentContext` {#runtime-experimentcontext}
```python
ExperimentContext(item_id=None, expected_output=None, item_metadata=None, run_id=None, dataset_id=None)
```
```text
The dataset item an experiment runs, empty on a live span.
Args:
item_id: The dataset item's id. None on a live span.
expected_output: The item's expected output, as the
dataset stores it: a string or any JSON value. None
when the item has none.
item_metadata: The item's metadata dict. {} when none.
run_id: The experiment run's id.
dataset_id: The dataset's id.
```
## `metrics` {#metrics}
Import path: `oodle_eval.v1.metrics`
```text
Built-in checks. Each returns `Scores`, primary score first.
Every check takes the evaluation context `ctx` first, or a plain
string to check that text. Its settings are keyword arguments,
so a template can pass its settings straight through:
def evaluate(ctx):
return EvaluationResult(scores=metrics.keyword_check(ctx, **ctx.params))
A setting passed as None takes its default, so an evaluator that
leaves a setting empty gets the check's own behaviour. Where the
summary says so, None on a limit means "do not check this limit".
`name` renames the primary score; the other scores keep their
names. Use `combine.rename` to change them all.
Checks that compare against a reference take it as the
`reference` setting. When that is None, they use the experiment
item's expected output (`ctx.expected_output`), so the same check
works on live spans with a fixed reference and in experiments
with the dataset's ground truth.
The checks live in one module per area, and every one is also
here, so `metrics.keyword_check` and
`from oodle_eval.v1.metrics import keyword_check` both work:
- `metrics.format`: JSON, patterns, keywords, length, Markdown,
HTML, CSV, TOML, SQL
- `metrics.quality`: readability, language, tone, sentiment
- `metrics.similarity`: comparison with a reference, a question
or a context
- `metrics.safety`: PII and secrets, refusals, prompt injection,
URLs
- `metrics.conversation`: repetition and forgotten facts
- `metrics.context`: grounding, unsupported numbers, citations
- `metrics.agent`: tool calls, tool trajectory, token and
latency budget
- `metrics.trace`: steps, failures, loops and duration of the
agent's trace
To write a check of your own the same way, see
`oodle_eval.v1.util`.
```
| Function | Summary |
|---|---|
| [`json_validity`](#metrics-json_validity) | Check that the output is JSON and has the shape you expect. |
| [`regex_match`](#metrics-regex_match) | Check that the text matches every required pattern and no forbidden one. |
| [`keyword_check`](#metrics-keyword_check) | Check that the text mentions the required words and none of the forbidden ones. |
| [`contains`](#metrics-contains) | Check that the text contains the given substrings. |
| [`length_budget`](#metrics-length_budget) | Check that the reply stays inside a word and character range. |
| [`markdown_structure`](#metrics-markdown_structure) | Check the reply's Markdown: code fences, tables, headings and lists. |
| [`html_validity`](#metrics-html_validity) | Check that the HTML in the reply has balanced tags. |
| [`csv_validity`](#metrics-csv_validity) | Check that the reply is CSV with the same number of fields in every row. |
| [`toml_validity`](#metrics-toml_validity) | Check that the reply parses as TOML and has the keys you require. |
| [`sql_shape`](#metrics-sql_shape) | Check that generated SQL is only the kind of statement you allow. |
| [`readability`](#metrics-readability) | Score Flesch reading ease and check the Flesch-Kincaid grade. |
| [`detect_language`](#metrics-detect_language) | Return the language of a text and a confidence. |
| [`language_adherence`](#metrics-language_adherence) | Check that the reply is written in the language you expect. |
| [`tone`](#metrics-tone) | Flag a reply that shouts, piles on exclamation marks, reads as negative, or uses a banned phrase. |
| [`sentiment`](#metrics-sentiment) | Score the reply's sentiment from -1 (negative) to 1 (positive). |
| [`exact_match`](#metrics-exact_match) | Check that the reply equals a reference text. |
| [`levenshtein_ratio`](#metrics-levenshtein_ratio) | Score how close the reply is to a reference, by edit distance. |
| [`jaccard_similarity`](#metrics-jaccard_similarity) | Score the overlap of the reply's and the reference's word sets. |
| [`rouge`](#metrics-rouge) | Score ROUGE-L, ROUGE-1 and ROUGE-2 F1 against a reference. |
| [`bleu`](#metrics-bleu) | Score sentence BLEU against a reference. |
| [`numeric_diff`](#metrics-numeric_diff) | Score how close the first number in the reply is to a reference number. |
| [`json_diff`](#metrics-json_diff) | Score how close the output's JSON is to a reference JSON value. |
| [`bm25_relevance`](#metrics-bm25_relevance) | Score how relevant the reply is to the question or context, by BM25. |
| [`tfidf_similarity`](#metrics-tfidf_similarity) | Score the cosine similarity of the reply and the question or context, by TF-IDF. |
| [`pii_leak`](#metrics-pii_leak) | Check the reply for an email, phone, card number, national id, IP address or credential. |
| [`refusal`](#metrics-refusal) | Check whether the model declined to do what it was asked. |
| [`url_check`](#metrics-url_check) | Check the URLs in the text: well formed, allowed scheme and domain, not private. |
| [`prompt_injection`](#metrics-prompt_injection) | Flag text that tries to override the model's instructions. |
| [`conversation_degeneration`](#metrics-conversation_degeneration) | Check whether the assistant starts to repeat itself, in the reply or across turns. |
| [`knowledge_retention`](#metrics-knowledge_retention) | Check that the reply does not forget what the user already said. |
| [`grounding`](#metrics-grounding) | Score the share of the reply's sentences whose words appear in the context. |
| [`unsupported_numbers`](#metrics-unsupported_numbers) | Find numbers and names in the reply that the context does not have. |
| [`citation_check`](#metrics-citation_check) | Check that every citation in the reply points at a real source. |
| [`tool_call_validity`](#metrics-tool_call_validity) | Check that the tool calls are well formed, allowed and not stuck in a loop. |
| [`tools_used`](#metrics-tools_used) | Return the names of the tools the agent called, in order. |
| [`tool_trajectory`](#metrics-tool_trajectory) | Check the agent's tool calls against the tools you expect. |
| [`token_latency_budget`](#metrics-token_latency_budget) | Check that the call stays inside its token, duration and time to first token limits. |
| [`span_count`](#metrics-span_count) | Count the agent's steps in ctx.trace.spans. |
| [`error_spans`](#metrics-error_spans) | Count the agent's steps that failed, in ctx.trace.spans. |
| [`repeated_tool_calls`](#metrics-repeated_tool_calls) | Detect the agent calling the same tool with the same input again and again. |
| [`total_duration`](#metrics-total_duration) | Measure how long the agent ran, from its trace. |
### `json_validity` {#metrics-json_validity}
```python
json_validity(ctx, *, extract_from_code_fence=True, required_keys=(), key_types=None, schema=None, name='is_json')
```
Score names: `is_json`, `json_schema_ok`
```text
Check that the output is JSON and has the shape you expect.
A structured output or tool result that arrives already
parsed counts as JSON with no second parse.
Args:
ctx: The evaluation context (reads the output), a string,
or a parsed JSON value.
extract_from_code_fence: Read the JSON inside a ```json
fenced block when the reply wraps it in prose. False
demands bare JSON.
required_keys: Keys the top-level object must carry.
key_types: {key: type} for top-level keys, where type is
"string", "number", "integer", "boolean", "array",
"object" or "null". A missing key is reported by
`required_keys`, not here.
schema: A JSON Schema subset the value must match: type,
required, properties, items, enum, minimum, maximum,
minLength and maxLength. Other keywords are ignored.
name: Name of the primary score.
Returns:
is_json (BOOLEAN): the output parses as JSON.
json_schema_ok (BOOLEAN): it parses and matches
`required_keys`, `key_types` and `schema`.
```
Example:
```python
from oodle_eval.v1 import metrics
def evaluate(ctx):
return EvaluationResult(scores=metrics.json_validity(ctx))
```
### `regex_match` {#metrics-regex_match}
```python
regex_match(ctx, *, must_match=(), must_not_match=(), field='output', name='regex_pass')
```
Score names: `regex_pass`
```text
Check that the text matches every required pattern and no forbidden one.
Patterns use Python's re syntax, in multi-line mode. Put
(?i) at the start of a pattern to ignore case. A pattern that
does not compile fails the check and says so.
Args:
ctx: The evaluation context, or the text to check.
must_match: Patterns that must each match.
must_not_match: Patterns that must not match.
field: "output" (the assistant's reply), "input" (the
user's messages) or "both".
name: Name of the primary score.
Returns:
regex_pass (BOOLEAN): every rule held.
```
Example:
```python
from oodle_eval.v1 import metrics
def evaluate(ctx):
return EvaluationResult(scores=metrics.regex_match(ctx))
```
### `keyword_check` {#metrics-keyword_check}
```python
keyword_check(ctx, *, required=(), forbidden=(), mode='all', case_sensitive=False, field='output', name='keywords_ok')
```
Score names: `keywords_ok`, `keyword_coverage`
```text
Check that the text mentions the required words and none of the forbidden ones.
Matching is on whole words, so "art" does not match "start".
Use `contains` to match any part of a word.
Args:
ctx: The evaluation context, or the text to check.
required: Keywords or phrases the text must mention.
forbidden: Keywords or phrases the text must not mention.
mode: "all": every required keyword must appear. "any":
one is enough.
case_sensitive: Match case exactly.
field: "output" (the assistant's reply), "input" (the
user's messages) or "both".
name: Name of the primary score.
Returns:
keywords_ok (BOOLEAN): the required rule held and no
forbidden keyword appeared.
keyword_coverage (NUMERIC, 0 to 1): the share of required
keywords found. Only when `required` is set.
```
Example:
```python
from oodle_eval.v1 import metrics
def evaluate(ctx):
return EvaluationResult(scores=metrics.keyword_check(ctx))
```
### `contains` {#metrics-contains}
```python
contains(ctx, *, values=(), mode='any', case_sensitive=False, field='output', name='contains')
```
Score names: `contains`
```text
Check that the text contains the given substrings.
Unlike `keyword_check`, a value matches anywhere, also inside
a word. Like OpenAI's `like` / `ilike` string check and Opik's
Contains.
Args:
ctx: The evaluation context, or the text to check.
values: The substrings to look for. Empty: the experiment
item's expected output (`ctx.expected_output`), a text
or a list of texts.
mode: "any": one value is enough. "all": every value
must appear. "none": no value may appear.
case_sensitive: Match case exactly.
field: "output" (the assistant's reply), "input" (the
user's messages) or "both".
name: Name of the primary score.
Returns:
contains (BOOLEAN): the text meets `mode`.
```
Example:
```python
from oodle_eval.v1 import metrics
def evaluate(ctx):
return EvaluationResult(scores=metrics.contains(ctx))
```
### `length_budget` {#metrics-length_budget}
```python
length_budget(ctx, *, min_words=1, max_words=300, min_chars=None, max_chars=4000, name='within_length')
```
Score names: `within_length`
```text
Check that the reply stays inside a word and character range.
Args:
ctx: The evaluation context (reads the reply), or the
text to check.
min_words: Fewest words. None: not checked.
max_words: Most words. None: not checked.
min_chars: Fewest characters. None: not checked.
max_chars: Most characters. None: not checked.
name: Name of the primary score.
Returns:
within_length (BOOLEAN): every bound held.
```
Example:
```python
from oodle_eval.v1 import metrics
def evaluate(ctx):
return EvaluationResult(scores=metrics.length_budget(ctx))
```
### `markdown_structure` {#metrics-markdown_structure}
```python
markdown_structure(ctx, *, required_headings=(), min_headings=0, require_list=False, require_table=False, name='markdown_ok')
```
Score names: `markdown_ok`, `heading_count`
```text
Check the reply's Markdown: code fences, tables, headings and lists.
Code fences (``` or ~~~) must be closed. A table's rows must
have as many cells as its header. Text inside a code fence is
not read as Markdown.
Args:
ctx: The evaluation context (reads the reply), or the
text to check.
required_headings: Headings the reply must have, matched
in any case, with no punctuation, inside the heading
text.
min_headings: Fewest headings.
require_list: The reply must have a bullet or numbered
list.
require_table: The reply must have a table.
name: Name of the primary score.
Returns:
markdown_ok (BOOLEAN): every rule held.
heading_count (NUMERIC): how many headings the reply has.
```
Example:
```python
from oodle_eval.v1 import metrics
def evaluate(ctx):
return EvaluationResult(scores=metrics.markdown_structure(ctx))
```
### `html_validity` {#metrics-html_validity}
```python
html_validity(ctx, *, allowed_tags=(), name='html_valid')
```
Score names: `html_valid`
```text
Check that the HTML in the reply has balanced tags.
Reads a ```html fenced block when there is one, else the
whole reply. Void tags (br, img, ...) need no end tag, and
tags whose end tag HTML makes optional (p, li, td, ...) are
not reported when left open.
Args:
ctx: The evaluation context (reads the reply), or the
text to check.
allowed_tags: Tag names allowed. Empty: any tag.
name: Name of the primary score.
Returns:
html_valid (BOOLEAN): every tag is closed in order, and
allowed.
```
Example:
```python
from oodle_eval.v1 import metrics
def evaluate(ctx):
return EvaluationResult(scores=metrics.html_validity(ctx))
```
### `csv_validity` {#metrics-csv_validity}
```python
csv_validity(ctx, *, delimiter=None, has_header=True, required_columns=(), min_rows=1, name='csv_valid')
```
Score names: `csv_valid`, `row_count`
```text
Check that the reply is CSV with the same number of fields in every row.
Reads a ```csv fenced block when there is one, else the whole
reply. Blank lines are skipped.
Args:
ctx: The evaluation context (reads the reply), or the
text to check.
delimiter: The field separator. Empty: the one of , ; tab
and | that the first row uses most.
has_header: The first row names the columns.
required_columns: Column names the header must have.
Needs `has_header`.
min_rows: Fewest data rows, the header not counted.
name: Name of the primary score.
Returns:
csv_valid (BOOLEAN): the rules held.
row_count (NUMERIC): data rows, the header not counted.
```
Example:
```python
from oodle_eval.v1 import metrics
def evaluate(ctx):
return EvaluationResult(scores=metrics.csv_validity(ctx))
```
### `toml_validity` {#metrics-toml_validity}
```python
toml_validity(ctx, *, required_keys=(), name='toml_valid')
```
Score names: `toml_valid`
```text
Check that the reply parses as TOML and has the keys you require.
Reads a ```toml fenced block when there is one, else the
whole reply.
Args:
ctx: The evaluation context (reads the reply), or the
text to check.
required_keys: Keys the document must have. A dotted key
such as "server.port" looks inside tables.
name: Name of the primary score.
Returns:
toml_valid (BOOLEAN): it parses and has every required key.
```
Example:
```python
from oodle_eval.v1 import metrics
def evaluate(ctx):
return EvaluationResult(scores=metrics.toml_validity(ctx))
```
### `sql_shape` {#metrics-sql_shape}
```python
sql_shape(ctx, *, allowed_statements=('SELECT',), allowed_keywords=(), max_statements=1, name='sql_ok')
```
Score names: `sql_ok`, `statement_type`
```text
Check that generated SQL is only the kind of statement you allow.
Reads a ```sql fenced block when there is one, else the whole
reply. Comments and string literals are left out before the
check, so a keyword inside a string does not count. This is a
pattern check, not a SQL parser: use it to catch a model that
writes where it should only read.
Args:
ctx: The evaluation context (reads the reply), or the
SQL text.
allowed_statements: Statement types allowed, such as
"SELECT" or "INSERT". A WITH statement counts as the
write it does, else as SELECT.
allowed_keywords: Write keywords (DROP, DELETE, INSERT,
UPDATE, ALTER, CREATE, TRUNCATE, GRANT, ...) allowed
anywhere. An allowed statement type is also allowed
as a keyword.
max_statements: Most statements, split on ";".
name: Name of the primary score.
Returns:
sql_ok (BOOLEAN): every rule held.
statement_type (CATEGORICAL): the first statement's type,
or "none".
```
Example:
```python
from oodle_eval.v1 import metrics
def evaluate(ctx):
return EvaluationResult(scores=metrics.sql_shape(ctx))
```
### `readability` {#metrics-readability}
```python
readability(ctx, *, min_grade=None, max_grade=10, min_words=20, name='readability_ok')
```
Score names: `readability_ok`, `reading_ease`
```text
Score Flesch reading ease and check the Flesch-Kincaid grade.
Syllables are counted with a vowel-group rule, so the grade
is an estimate, close enough to tell a plain answer from a
dense one. Code blocks, URLs and markdown are left out.
Args:
ctx: The evaluation context (reads the reply), or the
text to check.
min_grade: Lowest grade allowed. None: not checked.
max_grade: Highest grade allowed. None: not checked.
min_words: Replies shorter than this are too short to
grade and pass.
name: Name of the primary score.
Returns:
readability_ok (BOOLEAN): the grade is in range.
reading_ease (NUMERIC, 0 to 1): Flesch reading ease over
100. Not returned for a reply too short to grade.
```
Example:
```python
from oodle_eval.v1 import metrics
def evaluate(ctx):
return EvaluationResult(scores=metrics.readability(ctx))
```
### `detect_language` {#metrics-detect_language}
```python
detect_language(value)
```
```text
Return the language of a text and a confidence.
Latin-script languages are told apart by their most common
words; other scripts by their characters. Mixed or very short
text can read as "unknown".
Args:
value: The text.
Returns:
(code, confidence): an ISO 639-1 code (en, es, fr, de,
it, pt, nl, ru, uk, el, ar, he, hi, th, zh, ja, ko) or
"unknown", and a confidence from 0 to 1.
```
### `language_adherence` {#metrics-language_adherence}
```python
language_adherence(ctx, *, expected_language='en', min_words=5, name='language_match')
```
Score names: `language_match`, `detected_language`
```text
Check that the reply is written in the language you expect.
No model is needed, so it runs in the sandbox. See
`detect_language` for how the language is found.
Args:
ctx: The evaluation context (reads the reply), or the
text to check.
expected_language: ISO 639-1 code: en, es, fr, de, it,
pt, nl, ru, uk, el, ar, he, hi, th, zh, ja or ko.
min_words: Replies shorter than this pass with no verdict.
name: Name of the primary score.
Returns:
language_match (BOOLEAN): the detected language is the
expected one.
detected_language (CATEGORICAL): the detected code, or
"unknown". Not returned for a reply too short to
detect.
```
Example:
```python
from oodle_eval.v1 import metrics
def evaluate(ctx):
return EvaluationResult(scores=metrics.language_adherence(ctx))
```
### `tone` {#metrics-tone}
```python
tone(ctx, *, max_uppercase_ratio=0.3, max_exclamations=2, min_sentiment=-0.3, forbidden_phrases=('calm down', 'obviously', 'as i already said', "that's not my problem", 'you should have', 'stupid', 'shut up'), extra_positive_words=(), extra_negative_words=(), name='tone_ok')
```
Score names: `tone_ok`, `sentiment`
```text
Flag a reply that shouts, piles on exclamation marks, reads as negative, or uses a banned phrase.
Sentiment is a small word list with negation, scored the way
VADER normalises its compound score, so it needs no model.
Args:
ctx: The evaluation context (reads the reply), or the
text to check.
max_uppercase_ratio: Share of capital letters, over words
of 3 or more letters, above which the reply shouts.
Checked only on 20 or more such letters.
max_exclamations: Most exclamation marks allowed.
min_sentiment: Sentiment runs from -1 to 1. Below this
is negative.
forbidden_phrases: Phrases that fail the check, matched
in lower case anywhere in the reply.
extra_positive_words: Words to add to the positive list.
extra_negative_words: Words to add to the negative list.
name: Name of the primary score.
Returns:
tone_ok (BOOLEAN): no issue found.
sentiment (NUMERIC, -1 to 1): the reply's sentiment.
```
Example:
```python
from oodle_eval.v1 import metrics
def evaluate(ctx):
return EvaluationResult(scores=metrics.tone(ctx))
```
### `sentiment` {#metrics-sentiment}
```python
sentiment(ctx, *, extra_positive_words=(), extra_negative_words=(), name='sentiment')
```
Score names: `sentiment`, `sentiment_label`
```text
Score the reply's sentiment from -1 (negative) to 1 (positive).
The same word-list method as `tone`: no model is needed.
Like Opik Sentiment.
Args:
ctx: The evaluation context (reads the reply), or the
text to check.
extra_positive_words: Words to add to the positive list.
extra_negative_words: Words to add to the negative list.
name: Name of the primary score.
Returns:
sentiment (NUMERIC, -1 to 1): the compound sentiment.
sentiment_label (CATEGORICAL): "positive" at 0.05 and
above, "negative" at -0.05 and below, else "neutral".
```
Example:
```python
from oodle_eval.v1 import metrics
def evaluate(ctx):
return EvaluationResult(scores=metrics.sentiment(ctx))
```
### `exact_match` {#metrics-exact_match}
```python
exact_match(ctx, *, reference=None, normalize=False, case_sensitive=True, name='exact_match')
```
Score names: `exact_match`
```text
Check that the reply equals a reference text.
Space at the start and end is ignored. Like autoevals
ExactMatch, Opik Equals and OpenAI's `eq` string check.
Args:
ctx: The evaluation context (reads the reply), or the
text to check.
reference: The expected text. None: the
experiment item's expected output (`ctx.expected_output`).
normalize: Compare after `text.normalize`: lower case,
no punctuation, single spaces.
case_sensitive: Match case exactly. Ignored when
`normalize` is set.
name: Name of the primary score.
Returns:
exact_match (BOOLEAN): the texts are equal.
```
Example:
```python
from oodle_eval.v1 import metrics
def evaluate(ctx):
return EvaluationResult(scores=metrics.exact_match(ctx, reference=ctx.params.get("reference")))
```
### `levenshtein_ratio` {#metrics-levenshtein_ratio}
```python
levenshtein_ratio(ctx, *, reference=None, normalize=False, name='levenshtein_ratio')
```
Score names: `levenshtein_ratio`
```text
Score how close the reply is to a reference, by edit distance.
1 minus the Levenshtein distance over the longer length.
Each text is compared on its first 1000 characters. Like
autoevals Levenshtein and Opik LevenshteinRatio.
Args:
ctx: The evaluation context (reads the reply), or the
text to check.
reference: The expected text. None: the
experiment item's expected output (`ctx.expected_output`).
normalize: Compare after `text.normalize`.
name: Name of the primary score.
Returns:
levenshtein_ratio (NUMERIC, 0 to 1): 1 is identical.
```
Example:
```python
from oodle_eval.v1 import metrics
def evaluate(ctx):
return EvaluationResult(scores=metrics.levenshtein_ratio(ctx, reference=ctx.params.get("reference")))
```
### `jaccard_similarity` {#metrics-jaccard_similarity}
```python
jaccard_similarity(ctx, *, reference=None, name='jaccard_similarity')
```
Score names: `jaccard_similarity`
```text
Score the overlap of the reply's and the reference's word sets.
Words are compared in lower case with no punctuation.
Args:
ctx: The evaluation context (reads the reply), or the
text to check.
reference: The expected text. None: the
experiment item's expected output (`ctx.expected_output`).
name: Name of the primary score.
Returns:
jaccard_similarity (NUMERIC, 0 to 1): shared words over
all words. 1 when both texts have no words.
```
Example:
```python
from oodle_eval.v1 import metrics
def evaluate(ctx):
return EvaluationResult(scores=metrics.jaccard_similarity(ctx, reference=ctx.params.get("reference")))
```
### `rouge` {#metrics-rouge}
```python
rouge(ctx, *, reference=None, name='rouge_l')
```
Score names: `rouge_l`, `rouge_1`, `rouge_2`
```text
Score ROUGE-L, ROUGE-1 and ROUGE-2 F1 against a reference.
Tokens are normalised words (see `text.normalize`). ROUGE-L
uses the first 400 tokens of each text. Like OpenAI's
text_similarity grader and Opik ROUGE.
Args:
ctx: The evaluation context (reads the reply), or the
text to check.
reference: The expected text. None: the
experiment item's expected output (`ctx.expected_output`).
name: Name of the primary score.
Returns:
rouge_l (NUMERIC, 0 to 1): longest common subsequence F1.
rouge_1 (NUMERIC, 0 to 1): word overlap F1.
rouge_2 (NUMERIC, 0 to 1): word pair overlap F1.
```
Example:
```python
from oodle_eval.v1 import metrics
def evaluate(ctx):
return EvaluationResult(scores=metrics.rouge(ctx, reference=ctx.params.get("reference")))
```
### `bleu` {#metrics-bleu}
```python
bleu(ctx, *, reference=None, max_n=4, name='bleu')
```
Score names: `bleu`
```text
Score sentence BLEU against a reference.
Geometric mean of the 1- to `max_n`-gram precisions, with
add-one smoothing for n above 1 so a short reply does not
score 0, times the brevity penalty. Tokens are normalised
words. Like Opik's and OpenAI's BLEU.
Args:
ctx: The evaluation context (reads the reply), or the
text to check.
reference: The expected text. None: the
experiment item's expected output (`ctx.expected_output`).
max_n: The longest n-gram, 1 to 4.
name: Name of the primary score.
Returns:
bleu (NUMERIC, 0 to 1): 1 is identical.
```
Example:
```python
from oodle_eval.v1 import metrics
def evaluate(ctx):
return EvaluationResult(scores=metrics.bleu(ctx, reference=ctx.params.get("reference")))
```
### `numeric_diff` {#metrics-numeric_diff}
```python
numeric_diff(ctx, *, reference=None, name='numeric_diff')
```
Score names: `numeric_diff`
```text
Score how close the first number in the reply is to a reference number.
1 minus the difference over the sum of the two sizes, as
autoevals NumericDiff does. "1,200" reads as 1200.
Args:
ctx: The evaluation context (reads the reply), the text,
or a number.
reference: The expected number, or a text holding it.
None: the experiment item's expected output
(`ctx.expected_output`).
name: Name of the primary score.
Returns:
numeric_diff (NUMERIC, 0 to 1): 1 is equal. 0 when the
reply holds no number.
```
Example:
```python
from oodle_eval.v1 import metrics
def evaluate(ctx):
return EvaluationResult(scores=metrics.numeric_diff(ctx, reference=ctx.params.get("reference")))
```
### `json_diff` {#metrics-json_diff}
```python
json_diff(ctx, *, reference=None, name='json_diff')
```
Score names: `json_diff`
```text
Score how close the output's JSON is to a reference JSON value.
Objects score the mean over the union of their keys (a key
on one side only scores 0), arrays the mean over the longer
length, strings by edit similarity, numbers as in
`numeric_diff`. Like autoevals JSONDiff.
Args:
ctx: The evaluation context (reads the output), a text,
or a parsed value.
reference: The expected value, or its JSON text. A text
that is not JSON is compared as a string. None: the
experiment item's expected output (`ctx.expected_output`).
name: Name of the primary score.
Returns:
json_diff (NUMERIC, 0 to 1): 1 is the same structure and
values. 0 when the output holds no JSON.
```
Example:
```python
from oodle_eval.v1 import metrics
def evaluate(ctx):
return EvaluationResult(scores=metrics.json_diff(ctx, reference=ctx.params.get("reference")))
```
### `bm25_relevance` {#metrics-bm25_relevance}
```python
bm25_relevance(ctx, *, against='input', context=None, context_key='context', k1=1.5, b=0.75, name='bm25_relevance')
```
Score names: `bm25_relevance`
```text
Score how relevant the reply is to the question or context, by BM25.
The question's (or context's) content words are the query,
and each sentence of the reply is a document; the best
sentence's BM25 score is divided by the score a sentence of
average length that holds each query word once would get,
and capped at 1. Word frequencies come from the sentences of
both texts. Use it to rank or to flag replies that do not
touch the question; it is not a calibrated probability.
Args:
ctx: The evaluation context, or the reply text (then give
`context`).
against: "input": the user's last message. "context":
the context (see `grounding` for where it comes from).
context: The context text, or a list of passages.
context_key: The span attribute that holds the context
when `context` is not given.
k1: BM25 term saturation.
b: BM25 length normalisation, 0 to 1.
name: Name of the primary score.
Returns:
bm25_relevance (NUMERIC, 0 to 1): higher is more relevant.
```
Example:
```python
from oodle_eval.v1 import metrics
def evaluate(ctx):
return EvaluationResult(scores=metrics.bm25_relevance(ctx))
```
### `tfidf_similarity` {#metrics-tfidf_similarity}
```python
tfidf_similarity(ctx, *, against='input', context=None, context_key='context', name='tfidf_similarity')
```
Score names: `tfidf_similarity`
```text
Score the cosine similarity of the reply and the question or context, by TF-IDF.
Content words only (no stop words). Word weights come from
the sentences of both texts.
Args:
ctx: The evaluation context, or the reply text (then give
`context`).
against: "input": the user's last message. "context":
the context (see `grounding` for where it comes from).
context: The context text, or a list of passages.
context_key: The span attribute that holds the context
when `context` is not given.
name: Name of the primary score.
Returns:
tfidf_similarity (NUMERIC, 0 to 1): 1 is the same words
in the same proportions.
```
Example:
```python
from oodle_eval.v1 import metrics
def evaluate(ctx):
return EvaluationResult(scores=metrics.tfidf_similarity(ctx))
```
### `pii_leak` {#metrics-pii_leak}
```python
pii_leak(ctx, *, checks=('email', 'phone', 'credit_card', 'us_ssn', 'ip_address', 'secret'), allowed_email_domains=('example.com',), ignore_values_from_input=True, name='pii_free')
```
Score names: `pii_free`, `pii_count`
```text
Check the reply for an email, phone, card number, national id, IP address or credential.
Card numbers are checked with the Luhn sum, so a long order
number does not read as a card. The comment names the kinds
found, never the values, so a score does not copy the leak.
Args:
ctx: The evaluation context (reads the reply), or the
text to check.
checks: The kinds to look for: "email", "phone",
"credit_card", "us_ssn", "ip_address", "secret".
allowed_email_domains: Email domains that are fine to
show, such as your support address.
ignore_values_from_input: A value the user typed is not a
leak when the model says it back. False flags every
occurrence.
name: Name of the primary score.
Returns:
pii_free (BOOLEAN): nothing found.
pii_count (NUMERIC): how many values were found.
```
Example:
```python
from oodle_eval.v1 import metrics
def evaluate(ctx):
return EvaluationResult(scores=metrics.pii_leak(ctx))
```
### `refusal` {#metrics-refusal}
```python
refusal(ctx, *, patterns=None, extra_patterns=(), scan_first_chars=400, name='refused')
```
Score names: `refused`
```text
Check whether the model declined to do what it was asked.
A refusal is sometimes correct, so this scores the event.
Pair it with a filter on the spans where a refusal is a bug.
Patterns are matched without regard to case.
Args:
ctx: The evaluation context (reads the reply), or the
text to check.
patterns: Patterns that mark a refusal. None uses the
built-in English list.
extra_patterns: Patterns to add to `patterns`.
scan_first_chars: Look only at the start of the reply. A
long answer that says "I can't guarantee this" in
paragraph four is not a refusal.
name: Name of the primary score.
Returns:
refused (BOOLEAN): a pattern matched. Lower is better.
```
Example:
```python
from oodle_eval.v1 import metrics
def evaluate(ctx):
return EvaluationResult(scores=metrics.refusal(ctx))
```
### `url_check` {#metrics-url_check}
```python
url_check(ctx, *, allowed_schemes=('http', 'https'), allowed_domains=(), blocked_domains=(), allow_private=False, require_url=False, field='output', name='urls_ok')
```
Score names: `urls_ok`, `url_count`
```text
Check the URLs in the text: well formed, allowed scheme and domain, not private.
A URL is anything of the form scheme://... . A domain rule
also covers its subdomains. An IP that is not public
(private, loopback, link-local, reserved) and localhost fail
unless `allow_private` is set.
Args:
ctx: The evaluation context, or the text to check.
allowed_schemes: Schemes allowed, such as "https".
allowed_domains: Domains allowed. Empty: any domain.
blocked_domains: Domains that fail the check.
allow_private: Allow private and local addresses.
require_url: Fail when the text has no URL.
field: "output" (the assistant's reply), "input" (the
user's messages) or "both".
name: Name of the primary score.
Returns:
urls_ok (BOOLEAN): every URL passed.
url_count (NUMERIC): how many URLs the text has.
```
Example:
```python
from oodle_eval.v1 import metrics
def evaluate(ctx):
return EvaluationResult(scores=metrics.url_check(ctx))
```
### `prompt_injection` {#metrics-prompt_injection}
```python
prompt_injection(ctx, *, field='input', extra_patterns=(), min_base64_chars=120, threshold=0.5, name='injection_detected')
```
Score names: `injection_detected`, `injection_risk`, `injection_signals`
```text
Flag text that tries to override the model's instructions.
Signals, each with a weight: "ignore previous instructions"
phrasing (0.6), asking for the system prompt (0.4), role
markers such as "system:" or <|im_start|> (0.4), persona
switches such as "developer mode" (0.3), hidden Unicode tag
characters (0.6), three or more invisible format characters
(0.2), a long base64 blob that decodes (0.3), and each of
your `extra_patterns` (0.5). The risk is the sum of the
signals found, capped at 1. A heuristic: it catches the
common attacks, not a determined one.
Args:
ctx: The evaluation context, or the text to check.
field: "input": the user's and the tools' messages, where
direct and indirect injection arrive. "output": the
reply. "both".
extra_patterns: Python regular expressions to add as
signals.
min_base64_chars: Shortest base64 run that counts.
threshold: Risk at which the text counts as an injection.
name: Name of the primary score.
Returns:
injection_detected (BOOLEAN): risk reached `threshold`.
Lower is better.
injection_risk (NUMERIC, 0 to 1): lower is better.
injection_signals (CATEGORICAL): the signals found,
comma separated, or "none".
```
Example:
```python
from oodle_eval.v1 import metrics
def evaluate(ctx):
return EvaluationResult(scores=metrics.prompt_injection(ctx))
```
### `conversation_degeneration` {#metrics-conversation_degeneration}
```python
conversation_degeneration(ctx, *, turns_to_consider=5, min_words=8, threshold=0.6, name='degenerated')
```
Score names: `degenerated`, `degeneration`
```text
Check whether the assistant starts to repeat itself, in the reply or across turns.
Point it at chat spans: their input holds the conversation
so far, and the output is the newest reply. Three signals,
each 0 (healthy) to 1 (degenerate):
- repetition: share of the reply's word 3-grams that occur
more than once in it (a reply that loops on a phrase)
- turn similarity: how close the reply is to the most
similar earlier assistant turn (the same answer again)
- low diversity: 1 minus the word entropy of the reply, over
the most it could be for its length
Args:
ctx: The evaluation context, or the reply text (then only
repetition and low diversity count).
turns_to_consider: Earlier assistant turns to compare
against.
min_words: Replies shorter than this are not compared
across turns: two "Done." replies are not a sign of
degeneration.
threshold: The degeneration score at which the reply
counts as degenerated.
name: Name of the primary score.
Returns:
degenerated (BOOLEAN): degeneration reached `threshold`.
Lower is better.
degeneration (NUMERIC, 0 to 1): the largest of the three
signals. Lower is better. Not returned when the reply
has no text.
```
Example:
```python
from oodle_eval.v1 import metrics
def evaluate(ctx):
return EvaluationResult(scores=metrics.conversation_degeneration(ctx))
```
### `knowledge_retention` {#metrics-knowledge_retention}
```python
knowledge_retention(ctx, *, turns_to_consider=5, contradiction_kinds=('email', 'phone', 'name'), name='knowledge_retained')
```
Score names: `knowledge_retained`, `knowledge_retention`
```text
Check that the reply does not forget what the user already said.
Point it at chat spans: their input holds the conversation
so far. It collects facts the user stated in earlier turns
(email, phone, order or ticket number, name), then fails the
reply when it asks for one of those again, or quotes a
different value of the same kind.
Args:
ctx: The evaluation context.
turns_to_consider: Earlier user turns to read facts from.
contradiction_kinds: Kinds where the reply quoting a
different value is a mistake: "email", "phone",
"order_id", "name". Order numbers are left out by
default: an agent that opens a new ticket quotes a
new number, and that is correct.
name: Name of the primary score.
Returns:
knowledge_retained (BOOLEAN): no fact was forgotten.
knowledge_retention (NUMERIC, 0 to 1): the share of facts
kept. Not returned when the user stated no facts.
```
Example:
```python
from oodle_eval.v1 import metrics
def evaluate(ctx):
return EvaluationResult(scores=metrics.knowledge_retention(ctx))
```
### `grounding` {#metrics-grounding}
```python
grounding(ctx, *, context=None, context_key='context', min_overlap=0.6, threshold=0.8, name='grounded')
```
Score names: `grounded`, `grounding`
```text
Score the share of the reply's sentences whose words appear in the context.
A sentence counts as grounded when at least `min_overlap` of
its content words (no stop words, 3 letters or more) appear
in the context. Sentences with no content words are not
counted. A word check, not an entailment model: it catches a
reply that talks about things the context never mentions.
The context is, in order: the `context` argument, the span
attribute `context_key`, else the text of every input
message, where a RAG call usually puts what it retrieved.
Args:
ctx: The evaluation context, or the reply text (then give
`context`).
context: The context text, or a list of passages.
context_key: The span attribute that holds the context.
min_overlap: Share of a sentence's words, 0 to 1, that
must be in the context.
threshold: Share of grounded sentences at which the reply
counts as grounded.
name: Name of the primary score.
Returns:
grounded (BOOLEAN): grounding reached `threshold`.
grounding (NUMERIC, 0 to 1): the share of grounded
sentences.
```
Example:
```python
from oodle_eval.v1 import metrics
def evaluate(ctx):
return EvaluationResult(scores=metrics.grounding(ctx))
```
### `unsupported_numbers` {#metrics-unsupported_numbers}
```python
unsupported_numbers(ctx, *, context=None, context_key='context', check_entities=True, name='numbers_supported')
```
Score names: `numbers_supported`, `unsupported_count`
```text
Find numbers and names in the reply that the context does not have.
Numbers match by value ("1,200" equals "1200"). One-digit
whole numbers and list positions are ignored. Names are runs
of capitalised words that do not start a sentence, matched in
any case. The context comes from the same places as in
`grounding`.
Args:
ctx: The evaluation context, or the reply text (then give
`context`).
context: The context text, or a list of passages.
context_key: The span attribute that holds the context.
check_entities: Also check names.
name: Name of the primary score.
Returns:
numbers_supported (BOOLEAN): everything found is in the
context.
unsupported_count (NUMERIC): how many are not. Lower is
better.
```
Example:
```python
from oodle_eval.v1 import metrics
def evaluate(ctx):
return EvaluationResult(scores=metrics.unsupported_numbers(ctx))
```
### `citation_check` {#metrics-citation_check}
```python
citation_check(ctx, *, sources=None, context=None, context_key='context', require_citation=False, check_urls=True, name='citations_ok')
```
Score names: `citations_ok`, `citation_count`
```text
Check that every citation in the reply points at a real source.
A marker such as [2], [1, 3] or [2-4] must name a source: a
number from 1 to the length of `sources` when given, else a
number the context marks as [n] or as a numbered line. A URL
in the reply must appear in the sources or the context. The
context comes from the same places as in `grounding`.
Args:
ctx: The evaluation context, or the reply text (then give
`context` or `sources`).
sources: The list of sources the reply may cite, in order.
context: The context text, or a list of passages.
context_key: The span attribute that holds the context.
require_citation: Fail a reply with no citation at all.
check_urls: Check the URLs in the reply too.
name: Name of the primary score.
Returns:
citations_ok (BOOLEAN): every citation resolves.
citation_count (NUMERIC): markers and URLs found.
```
Example:
```python
from oodle_eval.v1 import metrics
def evaluate(ctx):
return EvaluationResult(scores=metrics.citation_check(ctx))
```
### `tool_call_validity` {#metrics-tool_call_validity}
```python
tool_call_validity(ctx, *, allowed_tools=(), required_args=None, max_identical_calls=2, name='tool_calls_valid')
```
Score names: `tool_calls_valid`, `tool_call_loop`
```text
Check that the tool calls are well formed, allowed and not stuck in a loop.
Checks each call's arguments parse as a JSON object and carry
the arguments you require, that the tool is on the allow
list, and that the model does not repeat a call it already
made with the same arguments earlier in the conversation.
On an experiment item it also reads the agent's tool steps
in ctx.trace.spans.
Args:
ctx: The evaluation context.
allowed_tools: Tool names allowed. Empty: any tool.
required_args: {tool name: [argument names]} each call
of that tool must carry.
max_identical_calls: The same call (name and arguments)
seen this many times counts as a loop.
name: Name of the primary score.
Returns:
tool_calls_valid (BOOLEAN): every call is well formed and
allowed.
tool_call_loop (BOOLEAN): a call repeated. Lower is
better. Not returned when there are no calls.
```
Example:
```python
from oodle_eval.v1 import metrics
def evaluate(ctx):
return EvaluationResult(scores=metrics.tool_call_validity(ctx))
```
### `tools_used` {#metrics-tools_used}
```python
tools_used(ctx)
```
```text
Return the names of the tools the agent called, in order.
Reads the tool steps in ctx.trace.spans. When the trace has
none (a live span), reads the tool calls in the output.
Args:
ctx: The evaluation context.
Returns:
A list of tool names.
```
### `tool_trajectory` {#metrics-tool_trajectory}
```python
tool_trajectory(ctx, *, expected=(), mode='strict', name='trajectory_match')
```
Score names: `trajectory_match`, `tool_correctness`
```text
Check the agent's tool calls against the tools you expect.
Like LangChain agentevals trajectory match and DeepEval
ToolCorrectness. Calls are compared by tool name.
Args:
ctx: The evaluation context (see `tools_used`), or a
list of tool names.
expected: The tool names you expect, in order.
mode: "strict": the same calls in the same order.
"unordered": the same calls in any order.
"subset": every call is an expected one (no extra
tool). "superset": every expected call happened
(extra calls allowed). Repeated names count.
name: Name of the primary score.
Returns:
trajectory_match (BOOLEAN): the calls meet `mode`.
tool_correctness (NUMERIC, 0 to 1): the share of expected
calls that happened. 1 when nothing is expected.
```
Example:
```python
from oodle_eval.v1 import metrics
def evaluate(ctx):
return EvaluationResult(scores=metrics.tool_trajectory(ctx))
```
### `token_latency_budget` {#metrics-token_latency_budget}
```python
token_latency_budget(ctx, *, max_output_tokens=2000, max_input_tokens=None, max_duration_ms=30000, max_time_to_first_token_ms=5000, name='within_budget')
```
Score names: `within_budget`, `budget_used`
```text
Check that the call stays inside its token, duration and time to first token limits.
Reads the span's own attributes, so it needs no text. A span
that reports none of them passes and says so.
Args:
ctx: The evaluation context, or the metadata dict.
max_output_tokens: None: not checked.
max_input_tokens: None: not checked.
max_duration_ms: None: not checked.
max_time_to_first_token_ms: None: not checked.
name: Name of the primary score.
Returns:
within_budget (BOOLEAN): no limit was passed.
budget_used (NUMERIC): the largest share of any limit;
above 1 is over. Lower is better. Not returned when
the span reports none of the attributes.
```
Example:
```python
from oodle_eval.v1 import metrics
def evaluate(ctx):
return EvaluationResult(scores=metrics.token_latency_budget(ctx))
```
### `span_count` {#metrics-span_count}
```python
span_count(ctx, *, kind=None, max_spans=None, name='span_count')
```
Score names: `span_count`, `within_span_limit`
```text
Count the agent's steps in ctx.trace.spans.
The trace is filled on an experiment item and empty on a live
span, so on a live span the count is 0.
Args:
ctx: The evaluation context, or a list of span dicts.
kind: Count only steps of this kind: "llm", "tool",
"agent" or "span". None: every step.
max_spans: Most steps allowed. None: not checked.
name: Name of the primary score.
Returns:
span_count (NUMERIC): the count. Lower is better.
within_span_limit (BOOLEAN): the count is at most
`max_spans`. Only when `max_spans` is set.
```
Example:
```python
from oodle_eval.v1 import metrics
def evaluate(ctx):
return EvaluationResult(scores=metrics.span_count(ctx))
```
### `error_spans` {#metrics-error_spans}
```python
error_spans(ctx, *, max_errors=0, name='no_errors')
```
Score names: `no_errors`, `error_count`
```text
Count the agent's steps that failed, in ctx.trace.spans.
A step failed when its `error` field is set, or its `status`
is "error".
Args:
ctx: The evaluation context, or a list of span dicts.
max_errors: Most failed steps allowed.
name: Name of the primary score.
Returns:
no_errors (BOOLEAN): at most `max_errors` steps failed.
error_count (NUMERIC): failed steps. Lower is better.
```
Example:
```python
from oodle_eval.v1 import metrics
def evaluate(ctx):
return EvaluationResult(scores=metrics.error_spans(ctx))
```
### `repeated_tool_calls` {#metrics-repeated_tool_calls}
```python
repeated_tool_calls(ctx, *, max_repeats=2, consecutive_only=False, name='tool_loop')
```
Score names: `tool_loop`, `most_repeated`
```text
Detect the agent calling the same tool with the same input again and again.
Reads the tool steps in ctx.trace.spans; with none (a live
span), the tool calls in the output.
Args:
ctx: The evaluation context, or a list of span dicts.
max_repeats: The same call seen this many times counts as
a loop.
consecutive_only: Count only calls repeated back to back.
name: Name of the primary score.
Returns:
tool_loop (BOOLEAN): a call repeated `max_repeats` times.
Lower is better.
most_repeated (NUMERIC): the most times one call was
made. Lower is better.
```
Example:
```python
from oodle_eval.v1 import metrics
def evaluate(ctx):
return EvaluationResult(scores=metrics.repeated_tool_calls(ctx))
```
### `total_duration` {#metrics-total_duration}
```python
total_duration(ctx, *, max_duration_ms=None, name='total_duration_ms')
```
Score names: `total_duration_ms`, `within_duration`
```text
Measure how long the agent ran, from its trace.
With agent steps in ctx.trace.spans, the longest agent step;
else the sum of every step's duration_ms (steps can overlap,
so the sum is an upper bound); with no steps (a live span),
the span's own duration_ms attribute.
Args:
ctx: The evaluation context, or a list of span dicts.
max_duration_ms: Longest time allowed. None: not checked.
name: Name of the primary score.
Returns:
total_duration_ms (NUMERIC): lower is better.
within_duration (BOOLEAN): at most `max_duration_ms`.
Only when it is set.
```
Example:
```python
from oodle_eval.v1 import metrics
def evaluate(ctx):
return EvaluationResult(scores=metrics.total_duration(ctx))
```
## `text` {#text}
Import path: `oodle_eval.v1.text`
```text
Read text, turns and tool calls out of a span, whatever its shape.
A span's input and output arrive as a plain string, one message
dict, or a list of messages. A message holds its text as a
`content` string, as a list of content blocks (OpenAI and
Anthropic), or as OpenTelemetry gen_ai `parts`. The helpers here
read all of these, so a check does not care which SDK wrote the
span.
Every function takes either the evaluation context `ctx` or the
value itself, where the summary says so.
```
| Function | Summary |
|---|---|
| [`message_text`](#text-message_text) | Return the plain text of a message value. |
| [`reply`](#text-reply) | Return the text of the assistant's reply in the output. |
| [`user_text`](#text-user_text) | Return the text of every user message in the input. |
| [`turns`](#text-turns) | Return the conversation as a list of turns. |
| [`last_user_message`](#text-last_user_message) | Return the text of the last user turn in the input. |
| [`tool_calls`](#text-tool_calls) | Return every tool call in a value, in order. |
| [`words`](#text-words) | Return the words of a text. |
| [`sentences`](#text-sentences) | Return the sentences of a text. |
| [`normalize`](#text-normalize) | Return a text in lower case, with no punctuation and single spaces. |
| [`extract_json`](#text-extract_json) | Return the first JSON value found in a text. |
| [`metadata_value`](#text-metadata_value) | Return the first span attribute found among `names`. |
| [`metadata_number`](#text-metadata_number) | Return the first span attribute among `names` that is a number. |
### `message_text` {#text-message_text}
```python
message_text(value, role=None, default_role=None)
```
```text
Return the plain text of a message value.
Args:
value: A string, a message dict, or a list of messages
and strings. Any other JSON value is returned as its
JSON text.
role: Keep only messages of this role ("user",
"assistant", "system", "tool"). None keeps every
message.
default_role: The role of a message that has no `role`
key. None means `role`, so a bare message counts as
the role asked for.
Returns:
The text of the kept messages, joined by new lines. A
string value is returned as it is, whatever `role` is.
```
### `reply` {#text-reply}
```python
reply(ctx)
```
```text
Return the text of the assistant's reply in the output.
Args:
ctx: The evaluation context, or the output value itself.
Returns:
The assistant messages' text. A message with no role
counts as the assistant's.
```
### `user_text` {#text-user_text}
```python
user_text(ctx)
```
```text
Return the text of every user message in the input.
Args:
ctx: The evaluation context, or the input value itself.
Returns:
The user messages' text. A message with no role counts
as the user's. A plain string input is returned as it is.
```
### `turns` {#text-turns}
```python
turns(ctx, include_reply=True)
```
```text
Return the conversation as a list of turns.
The shape is the thread shape DeepEval, Ragas and Opik use.
Args:
ctx: The evaluation context.
include_reply: Add the output's messages at the end.
Returns:
A list of {"role": str, "content": str}. An input
message with no role is a user turn; an output message
with no role is an assistant turn. A plain string input
is one user turn. Turns with no text are left out.
```
### `last_user_message` {#text-last_user_message}
```python
last_user_message(ctx)
```
```text
Return the text of the last user turn in the input.
Args:
ctx: The evaluation context.
Returns:
The text, or "" when the input has no user turn.
```
### `tool_calls` {#text-tool_calls}
```python
tool_calls(ctx_or_value)
```
```text
Return every tool call in a value, in order.
Reads OpenAI chat `tool_calls`, OpenAI Responses
`function_call` items, OpenTelemetry gen_ai parts of type
`tool_call`, and Anthropic `tool_use` content blocks.
Args:
ctx_or_value: The evaluation context (reads the output)
or a message value.
Returns:
A list of {"id", "name", "arguments"}. `arguments` is
parsed when it is a JSON string, else the value as it
came (a string that is not JSON stays a string). `name`
is "" when the call has none.
```
### `words` {#text-words}
```python
words(text, lower=True)
```
```text
Return the words of a text.
Args:
text: The text.
lower: Lower-case the words first.
Returns:
A list of runs of letters, digits and underscores.
```
### `sentences` {#text-sentences}
```python
sentences(text)
```
```text
Return the sentences of a text.
A full stop, question mark or exclamation mark followed by a
space, or a blank line, ends a sentence.
Args:
text: The text.
Returns:
A list of sentences with the space around them removed.
```
### `normalize` {#text-normalize}
```python
normalize(text)
```
```text
Return a text in lower case, with no punctuation and single spaces.
Use it before an exact comparison, so "Paris." equals "paris".
Args:
text: The text.
Returns:
The normalised text.
```
### `extract_json` {#text-extract_json}
```python
extract_json(text)
```
```text
Return the first JSON value found in a text.
Tries, in order: the whole text, the first fenced code
block (```json or ```), then the first balanced {...} or
[...] that parses.
Args:
text: The text. A dict or list is returned as it is.
Returns:
The parsed value, or None when no JSON is found.
```
### `metadata_value` {#text-metadata_value}
```python
metadata_value(ctx, *names, default=None)
```
```text
Return the first span attribute found among `names`.
A numeric attribute can be stored with a type suffix, so
each name is also tried with `_int`, `_float`, `_double`,
`_bool`, `_str` and `_string`.
Args:
ctx: The evaluation context, or the metadata dict.
*names: Attribute names to try, first found wins.
default: Returned when no name is found.
Returns:
The attribute value as stored, or `default`.
```
### `metadata_number` {#text-metadata_number}
```python
metadata_number(ctx, *names, default=None)
```
```text
Return the first span attribute among `names` that is a number.
Like `metadata_value`, but skips a value that does not read
as a number, and returns a float.
Args:
ctx: The evaluation context, or the metadata dict.
*names: Attribute names to try, first found wins.
default: Returned when no name holds a number.
Returns:
The number as a float, or `default`.
```
## `combine` {#combine}
Import path: `oodle_eval.v1.combine`
```text
Combine several scores into one.
Every function takes a list of scores: a `Scores` from a check,
a plain list, or a list of such lists, which is read as one flat
list. A score can also be a dict with "name", "value",
"data_type" and "higher_is_better", as `ctx.scores` holds.
scores = metrics.tone(ctx) + metrics.readability(ctx)
overall = combine.weighted_mean(scores, weights={"tone_ok": 2})
return EvaluationResult(scores=scores + [overall])
The models for these are OpenAI's multi grader, promptfoo's
weights and assert sets, DeepEval's composite metrics, Opik's
AggregatedMetric and LangSmith's composite scores.
```
| Function | Summary |
|---|---|
| [`weighted_mean`](#combine-weighted_mean) | Return the weighted mean of the scores' values as one NUMERIC score. |
| [`passed`](#combine-passed) | Return whether one score reads as a pass. |
| [`all_pass`](#combine-all_pass) | Return True when every score passes, as a BOOLEAN score. |
| [`any_fail`](#combine-any_fail) | Return True when a score fails, as a BOOLEAN score. |
| [`minimum`](#combine-minimum) | Return the smallest value among the scores, as a NUMERIC score. |
| [`maximum`](#combine-maximum) | Return the largest value among the scores, as a NUMERIC score. |
| [`threshold`](#combine-threshold) | Turn one score into a BOOLEAN pass at a line. |
| [`rename`](#combine-rename) | Return copies of the scores with new names. |
### `weighted_mean` {#combine-weighted_mean}
```python
weighted_mean(scores, weights=None, name='combined')
```
```text
Return the weighted mean of the scores' values as one NUMERIC score.
A BOOLEAN score counts as 1 or 0. CATEGORICAL scores and
scores with no value are skipped. Values are used as they
are: pick scores that read the same way (turn a
lower-is-better score round with `threshold` or `passed`
first).
Args:
scores: The scores to combine.
weights: {score name: weight}, or a list of weights in
the order of `scores`. A name missing from the dict
weighs 1. None: every score weighs 1.
name: Name of the combined score.
Returns:
A NUMERIC Score, higher is better.
Raises:
ValueError: no score has a number to combine.
```
### `passed` {#combine-passed}
```python
passed(score, at=None)
```
```text
Return whether one score reads as a pass.
A BOOLEAN score passes when it is True, or when it is False
for a lower-is-better score (such as `refused`). A NUMERIC
score passes when it is at or above `at`, or at or below
`at` for a lower-is-better score. With no `at`, 0.5 is the
line: at or above for higher-is-better, below for
lower-is-better.
Args:
score: A Score or a score dict.
at: The pass line for a NUMERIC score.
Returns:
True or False.
Raises:
ValueError: the score is CATEGORICAL or has no value.
```
### `all_pass` {#combine-all_pass}
```python
all_pass(scores, name='all_pass', at=None)
```
```text
Return True when every score passes, as a BOOLEAN score.
Each score is read with `passed`. CATEGORICAL scores and
scores with no value are skipped.
Args:
scores: The scores to check.
at: The pass line for NUMERIC scores, as in `passed`.
name: Name of the result score.
Returns:
A BOOLEAN Score, higher is better. True when there is
nothing to check.
```
### `any_fail` {#combine-any_fail}
```python
any_fail(scores, name='any_fail', at=None)
```
```text
Return True when a score fails, as a BOOLEAN score.
The opposite of `all_pass`.
Args:
scores: The scores to check.
at: The pass line for NUMERIC scores, as in `passed`.
name: Name of the result score.
Returns:
A BOOLEAN Score, lower is better.
```
### `minimum` {#combine-minimum}
```python
minimum(scores, name='minimum')
```
```text
Return the smallest value among the scores, as a NUMERIC score.
A BOOLEAN score counts as 1 or 0; CATEGORICAL scores and
scores with no value are skipped.
Args:
scores: The scores to read.
name: Name of the result score.
Returns:
A NUMERIC Score. Its direction is the one the scores
share, else unset.
Raises:
ValueError: no score has a number.
```
### `maximum` {#combine-maximum}
```python
maximum(scores, name='maximum')
```
```text
Return the largest value among the scores, as a NUMERIC score.
A BOOLEAN score counts as 1 or 0; CATEGORICAL scores and
scores with no value are skipped.
Args:
scores: The scores to read.
name: Name of the result score.
Returns:
A NUMERIC Score. Its direction is the one the scores
share, else unset.
Raises:
ValueError: no score has a number.
```
### `threshold` {#combine-threshold}
```python
threshold(score, at, name=None, above=True)
```
```text
Turn one score into a BOOLEAN pass at a line.
Args:
score: A Score or a score dict. A BOOLEAN counts as 1
or 0.
at: The line.
above: True: pass at or above `at`. False: pass below
`at`.
name: Name of the result score. None: the score's name
with "_ok" added.
Returns:
A BOOLEAN Score, higher is better. False when the score
has no number.
```
### `rename` {#combine-rename}
```python
rename(scores, prefix='', names=None)
```
```text
Return copies of the scores with new names.
Use it when two checks return scores of the same name, or to
tell apart the scores of one check run twice.
Args:
scores: The scores to rename.
prefix: Text to put before every name.
names: {old name: new name}, applied before `prefix`.
Returns:
A new Scores. The scores passed in do not change.
```
## `util` {#util}
Import path: `oodle_eval.v1.util`
```text
Building blocks for writing your own checks, the way the built-in ones are written.
from oodle_eval.v1 import text, util
@util.declares("polite", "politeness")
def politeness(ctx, *, words=None, name="polite"):
words = util.opt(words, ["please", "thank"])
reply = util.subject_text(ctx).lower()
found = [w for w in words if w in reply]
return Scores([
util.boolean_score(util.opt(name, "polite"), bool(found), f"found {found}"),
util.numeric_score("politeness", len(found) / len(words), "share of words"),
])
A check built this way takes a context or a plain string, reads
None as "the default", and returns `Scores` whose names the
editor knows before the first run. Message helpers (reply,
turns, tool calls, JSON) are in `oodle_eval.v1.text`.
The sandbox gives each item 5 seconds: cut long text with
`MAX_TEXT_CHARS` and `MAX_SENTENCES` before anything that grows
faster than the text.
```
| Function | Summary |
|---|---|
| [`declares`](#util-declares) | Record the score names a check returns, primary first. |
| [`opt`](#util-opt) | Return `value`, or `default` when `value` is None. |
| [`is_context`](#util-is_context) | Return whether `value` is an evaluation context. |
| [`subject_text`](#util-subject_text) | Return the text a check reads: the reply, the user's turns, or both. |
| [`reference_or_expected`](#util-reference_or_expected) | Return the reference setting, else the experiment item's expected output. |
| [`require_reference`](#util-require_reference) | Return a reference as text, or say how to set one. |
| [`boolean_score`](#util-boolean_score) | Return a BOOLEAN Score. |
| [`numeric_score`](#util-numeric_score) | Return a NUMERIC Score. |
| [`strip_code`](#util-strip_code) | Return a text with code blocks, inline code and URLs made spaces. |
| [`fenced_block`](#util-fenced_block) | Return the first fenced code block of one of `langs`, else the whole text. |
| [`join_problems`](#util-join_problems) | Return problems as one comment, the first `limit` named. |
| [`flat_text`](#util-flat_text) | Return any value as text: a string as it is, a list line by line, else JSON. |
| [`context_text`](#util-context_text) | Return the retrieved context to check a reply against. |
| [`content_words`](#util-content_words) | Return the words of a text that carry content. |
| [`find_number`](#util-find_number) | Return the first number in a value, as a float. |
| [`find_urls`](#util-find_urls) | Return the URLs in a text, with trailing punctuation removed. |
| [`is_messages`](#util-is_messages) | Return whether a value is a list of chat messages. |
### `declares` {#util-declares}
```python
declares(*names)
```
```text
Record the score names a check returns, primary first.
The library reference reads them from the function, so the
editor can offer a score name before the check has run once.
Args:
*names: The score names, primary first.
Returns:
A decorator that sets `__scores__` on the function and
returns the function unchanged.
```
### `opt` {#util-opt}
```python
opt(value, default)
```
```text
Return `value`, or `default` when `value` is None.
An evaluator's unset setting arrives as None, so a check
reads each setting through this to get its own default.
Args:
value: The setting as passed.
default: The value to use for None.
Returns:
`value`, or `default`.
```
### `is_context` {#util-is_context}
```python
is_context(value)
```
```text
Return whether `value` is an evaluation context.
Args:
value: Anything.
Returns:
True for an object with `observation` and `trace`.
```
### `subject_text` {#util-subject_text}
```python
subject_text(ctx, field='output', limit=None)
```
```text
Return the text a check reads: the reply, the user's turns, or both.
Args:
ctx: The evaluation context, a plain string (returned as
it is), or a message value (its assistant text).
field: "output" (the assistant's reply), "input" (the
user's messages) or "both". Used for a context only.
limit: The most characters to return. None: all.
Returns:
The text.
Raises:
ValueError: `field` is not one of the three.
```
### `reference_or_expected` {#util-reference_or_expected}
```python
reference_or_expected(ctx, reference)
```
```text
Return the reference setting, else the experiment item's expected output.
Args:
ctx: The evaluation context, or anything else.
reference: The reference setting.
Returns:
`reference` when set; else `ctx.expected_output` for a
context; else None.
```
### `require_reference` {#util-require_reference}
```python
require_reference(reference, check)
```
```text
Return a reference as text, or say how to set one.
Args:
reference: The reference, a string or any JSON value.
check: The check's name, for the error message.
Returns:
The reference itself when it is a string, else its JSON
text.
Raises:
ValueError: `reference` is None.
```
### `boolean_score` {#util-boolean_score}
```python
boolean_score(name, value, comment, higher_is_better=True)
```
```text
Return a BOOLEAN Score.
Args:
name: The score name.
value: Read as True or False.
comment: A short reason.
higher_is_better: False for a score that flags a problem
when true, such as `refused`.
Returns:
A Score.
```
### `numeric_score` {#util-numeric_score}
```python
numeric_score(name, value, comment, higher_is_better=True)
```
```text
Return a NUMERIC Score.
Args:
name: The score name.
value: A number.
comment: A short reason.
higher_is_better: False for a count of problems or a
duration.
Returns:
A Score.
```
### `strip_code` {#util-strip_code}
```python
strip_code(value)
```
```text
Return a text with code blocks, inline code and URLs made spaces.
Use it before a check of prose, so code does not read as
words.
Args:
value: The text.
Returns:
The text without code and URLs.
```
### `fenced_block` {#util-fenced_block}
```python
fenced_block(value, *langs)
```
```text
Return the first fenced code block of one of `langs`, else the whole text.
Args:
value: The text.
*langs: Fence labels to accept, such as "json". A block
with no label is also accepted.
Returns:
The block's content, or `value` when there is none.
```
### `join_problems` {#util-join_problems}
```python
join_problems(problems, limit=10)
```
```text
Return problems as one comment, the first `limit` named.
Args:
problems: A list of short texts.
limit: The most to name; the rest are counted.
Returns:
"a; b; and 3 more", or "" for no problems.
```
### `flat_text` {#util-flat_text}
```python
flat_text(value)
```
```text
Return any value as text: a string as it is, a list line by line, else JSON.
Args:
value: A string, a list, or any JSON value.
Returns:
The text. "" for None.
```
### `context_text` {#util-context_text}
```python
context_text(ctx, context=None, context_key='context')
```
```text
Return the retrieved context to check a reply against.
In order: the `context` argument, else the span attribute
`context_key`, else the text of every input message (a RAG
call usually puts what it retrieved in its prompt). Cut to
`MAX_TEXT_CHARS`.
Args:
ctx: The evaluation context, or a plain string (then only
`context` counts).
context: The context text, or a list of passages.
context_key: The span attribute that holds the context.
Returns:
The context text, or "".
```
### `content_words` {#util-content_words}
```python
content_words(value)
```
```text
Return the words of a text that carry content.
Args:
value: The text.
Returns:
Lower-case words of 3 or more characters that are not in
`STOPWORDS`.
```
### `find_number` {#util-find_number}
```python
find_number(value)
```
```text
Return the first number in a value, as a float.
Args:
value: A number (a bool is not one), or a text holding
one. "1,200" reads as 1200.
Returns:
The number, or None.
```
### `find_urls` {#util-find_urls}
```python
find_urls(value, limit=None)
```
```text
Return the URLs in a text, with trailing punctuation removed.
Args:
value: The text.
limit: The most URLs to return. None: all.
Returns:
A list of URLs, in order.
```
### `is_messages` {#util-is_messages}
```python
is_messages(value)
```
```text
Return whether a value is a list of chat messages.
Args:
value: Anything.
Returns:
True for a list with a dict that has "role" or "parts".
```
## `metrics.format` {#metrics-format}
Import path: `oodle_eval.v1.metrics.format`
The `metrics` functions defined in `oodle_eval/v1/metrics/format.py`. Import them from `oodle_eval.v1.metrics`.
| Function | Summary |
|---|---|
| [`json_validity`](#metrics-json_validity) | Check that the output is JSON and has the shape you expect. |
| [`regex_match`](#metrics-regex_match) | Check that the text matches every required pattern and no forbidden one. |
| [`keyword_check`](#metrics-keyword_check) | Check that the text mentions the required words and none of the forbidden ones. |
| [`contains`](#metrics-contains) | Check that the text contains the given substrings. |
| [`length_budget`](#metrics-length_budget) | Check that the reply stays inside a word and character range. |
| [`markdown_structure`](#metrics-markdown_structure) | Check the reply's Markdown: code fences, tables, headings and lists. |
| [`html_validity`](#metrics-html_validity) | Check that the HTML in the reply has balanced tags. |
| [`csv_validity`](#metrics-csv_validity) | Check that the reply is CSV with the same number of fields in every row. |
| [`toml_validity`](#metrics-toml_validity) | Check that the reply parses as TOML and has the keys you require. |
| [`sql_shape`](#metrics-sql_shape) | Check that generated SQL is only the kind of statement you allow. |
## `metrics.quality` {#metrics-quality}
Import path: `oodle_eval.v1.metrics.quality`
The `metrics` functions defined in `oodle_eval/v1/metrics/quality.py`. Import them from `oodle_eval.v1.metrics`.
| Function | Summary |
|---|---|
| [`readability`](#metrics-readability) | Score Flesch reading ease and check the Flesch-Kincaid grade. |
| [`detect_language`](#metrics-detect_language) | Return the language of a text and a confidence. |
| [`language_adherence`](#metrics-language_adherence) | Check that the reply is written in the language you expect. |
| [`tone`](#metrics-tone) | Flag a reply that shouts, piles on exclamation marks, reads as negative, or uses a banned phrase. |
| [`sentiment`](#metrics-sentiment) | Score the reply's sentiment from -1 (negative) to 1 (positive). |
## `metrics.similarity` {#metrics-similarity}
Import path: `oodle_eval.v1.metrics.similarity`
The `metrics` functions defined in `oodle_eval/v1/metrics/similarity.py`. Import them from `oodle_eval.v1.metrics`.
| Function | Summary |
|---|---|
| [`exact_match`](#metrics-exact_match) | Check that the reply equals a reference text. |
| [`levenshtein_ratio`](#metrics-levenshtein_ratio) | Score how close the reply is to a reference, by edit distance. |
| [`jaccard_similarity`](#metrics-jaccard_similarity) | Score the overlap of the reply's and the reference's word sets. |
| [`rouge`](#metrics-rouge) | Score ROUGE-L, ROUGE-1 and ROUGE-2 F1 against a reference. |
| [`bleu`](#metrics-bleu) | Score sentence BLEU against a reference. |
| [`numeric_diff`](#metrics-numeric_diff) | Score how close the first number in the reply is to a reference number. |
| [`json_diff`](#metrics-json_diff) | Score how close the output's JSON is to a reference JSON value. |
| [`bm25_relevance`](#metrics-bm25_relevance) | Score how relevant the reply is to the question or context, by BM25. |
| [`tfidf_similarity`](#metrics-tfidf_similarity) | Score the cosine similarity of the reply and the question or context, by TF-IDF. |
## `metrics.safety` {#metrics-safety}
Import path: `oodle_eval.v1.metrics.safety`
The `metrics` functions defined in `oodle_eval/v1/metrics/safety.py`. Import them from `oodle_eval.v1.metrics`.
| Function | Summary |
|---|---|
| [`pii_leak`](#metrics-pii_leak) | Check the reply for an email, phone, card number, national id, IP address or credential. |
| [`refusal`](#metrics-refusal) | Check whether the model declined to do what it was asked. |
| [`url_check`](#metrics-url_check) | Check the URLs in the text: well formed, allowed scheme and domain, not private. |
| [`prompt_injection`](#metrics-prompt_injection) | Flag text that tries to override the model's instructions. |
## `metrics.conversation` {#metrics-conversation}
Import path: `oodle_eval.v1.metrics.conversation`
The `metrics` functions defined in `oodle_eval/v1/metrics/conversation.py`. Import them from `oodle_eval.v1.metrics`.
| Function | Summary |
|---|---|
| [`conversation_degeneration`](#metrics-conversation_degeneration) | Check whether the assistant starts to repeat itself, in the reply or across turns. |
| [`knowledge_retention`](#metrics-knowledge_retention) | Check that the reply does not forget what the user already said. |
## `metrics.context` {#metrics-context}
Import path: `oodle_eval.v1.metrics.context`
The `metrics` functions defined in `oodle_eval/v1/metrics/context.py`. Import them from `oodle_eval.v1.metrics`.
| Function | Summary |
|---|---|
| [`grounding`](#metrics-grounding) | Score the share of the reply's sentences whose words appear in the context. |
| [`unsupported_numbers`](#metrics-unsupported_numbers) | Find numbers and names in the reply that the context does not have. |
| [`citation_check`](#metrics-citation_check) | Check that every citation in the reply points at a real source. |
## `metrics.agent` {#metrics-agent}
Import path: `oodle_eval.v1.metrics.agent`
The `metrics` functions defined in `oodle_eval/v1/metrics/agent.py`. Import them from `oodle_eval.v1.metrics`.
| Function | Summary |
|---|---|
| [`tool_call_validity`](#metrics-tool_call_validity) | Check that the tool calls are well formed, allowed and not stuck in a loop. |
| [`tools_used`](#metrics-tools_used) | Return the names of the tools the agent called, in order. |
| [`tool_trajectory`](#metrics-tool_trajectory) | Check the agent's tool calls against the tools you expect. |
| [`token_latency_budget`](#metrics-token_latency_budget) | Check that the call stays inside its token, duration and time to first token limits. |
## `metrics.trace` {#metrics-trace}
Import path: `oodle_eval.v1.metrics.trace`
The `metrics` functions defined in `oodle_eval/v1/metrics/trace.py`. Import them from `oodle_eval.v1.metrics`.
| Function | Summary |
|---|---|
| [`span_count`](#metrics-span_count) | Count the agent's steps in ctx.trace.spans. |
| [`error_spans`](#metrics-error_spans) | Count the agent's steps that failed, in ctx.trace.spans. |
| [`repeated_tool_calls`](#metrics-repeated_tool_calls) | Detect the agent calling the same tool with the same input again and again. |
| [`total_duration`](#metrics-total_duration) | Measure how long the agent ran, from its trace. |
---
## Shared Libraries
A shared library is a Python module that your team
writes once and imports from many code evaluators. Put
your own text cleaning, your product's rules, or a
score that several evaluators need in a library. When
you fix it, every evaluator that imports it gets the
fix.
```python
# In any code evaluator
from shared.acme_text import clean, is_polite
def evaluate(ctx):
reply = clean(str(ctx.observation.output or ""))
return EvaluationResult(scores=[
Score(name="polite", value=is_polite(reply), data_type="BOOLEAN"),
])
```
`import shared.acme_text as t` and
`from shared import acme_text` also work.
## Create a library
1. Go to **Agent Observability → Evaluators**
() and open
**Shared libraries**
2. Click **New Library**
3. Give it a name. This is the name that you import:
`acme_text` is `shared.acme_text`
4. Write the code and click **Save**
A library is plain Python: functions, classes and
constants. It does not define `evaluate`. The runtime
names (`Score`, `EvaluationResult`) are not in a
library's globals, so import them when a library makes
scores:
```python
# shared library "acme_text"
from oodle_eval.runtime import Score
from oodle_eval.v1 import text
_SPACE = re.compile(r"\s+")
POLITE = ("please", "thank you", "thanks")
def clean(s):
"""Lower-case the text and join runs of white space."""
return _SPACE.sub(" ", s).strip().lower()
def is_polite(s):
"""True when the text holds one of the polite phrases."""
s = clean(s)
return any(p in s for p in POLITE)
def politeness(ctx, name="polite"):
"""A BOOLEAN score for the reply."""
return [Score(
name=name,
value=is_polite(text.reply(ctx)),
data_type="BOOLEAN",
higher_is_better=True,
)]
```
### Rules for a library
| Rule | Why |
|------|-----|
| The name matches `^[a-z][a-z0-9_]{0,63}$`: lower case, digits and `_`, starting with a letter | It is a Python module name |
| The name is not a Python keyword, and not `oodle_eval` or `shared` | Python cannot import a keyword, and the other two names are the library and the package that hold shared libraries |
| The name is unique in your Oodle instance | Code imports a library by its name |
| The name has no dots and no folders: use `utils_text`, not `utils.text` | Each library is one module directly under `shared` |
| The name cannot change after you create the library | The code that imports the library names it |
| The source is at most 256 KB | |
| Imports are absolute: `from shared.other import x`, not `from .other import x` | The sandbox checks each import by its top-level name |
| A library can import the sandbox's standard-library modules, `oodle_eval` and other shared libraries | These are the modules in the [execution environment](./code-evaluators#execution-environment) |
A library runs in the same sandbox as the evaluator
that imports it, so its work counts toward that
evaluator's 5 second and 128 MB limits.
To give a library a different name, create a library
with the new name, change the imports in each template
and library that uses the old one, then delete the old
library.
One evaluator can use at most 20 shared libraries, with
at most 1 MB of library source in total. Libraries that
other libraries import count too. Past either limit, the
evaluator fails with an error that says which limit.
## Versions and pins
Each save that changes the source makes a new version:
1, 2, 3 and so on. Open a library to see its versions,
and who saved each one and when. You can read the
source of each version. To go back to an old version,
open it, click **Copy into the editor**, then click
**Save**. This adds a new version with the old source,
so no version is lost.
A code template runs the **latest** version of each
library that it imports. To keep a template on a known
version, **pin** the library on the template:
```json
{"libraryPins": {"acme_text": 3}}
```
The pins replace all the pins of the template. To
unpin one library, send the pins without it. To remove
all the pins, send `{}`. A pinned template runs that
version until you change the pin. A pin also applies
when the template loads the library through another
library. Pin a library when a change to it must not
move the scores of an evaluator until you have checked
the change.
Oodle finds the libraries that a template uses from
its `import shared.`, `from shared. import`
and `from shared import ` statements, and from the
imports in those libraries.
When an evaluator imports a library that does not
exist, or pins a version that does not exist, the run
fails with `LIBRARY_NOT_FOUND` and the evaluator writes
no score for that span.
A saved change to a library reaches live evaluators
within a minute.
### Try a change before you save it
A test run can use draft library source in place of
the saved version. Send it in `libraries`, a map of
library name to source. With MCP (`genai_evaluator_workbench`):
```json
{"action": "try_code", "sourceCode": "from shared.acme_text import is_polite ...",
"libraries": {"acme_text": "def is_polite(s): ..."}}
```
## Delete a library
You can delete a library only when no code template
and no other library imports it. The library page shows
**Used by**: the templates and libraries whose code
imports it. Remove the import from each of them, then
delete the library. A delete that Oodle refuses names
each of them.
Deleting a library also deletes its versions.
## With the CLI and MCP
```bash
oodle genai code-libraries list
oodle genai code-libraries get
oodle genai code-libraries create ...
oodle genai code-libraries update ...
oodle genai code-libraries versions
oodle genai code-libraries delete
```
Run `oodle genai code-libraries --help` for
the arguments of each command.
With MCP, `genai_evaluator_workbench` reads libraries
and `manage_genai_evaluators` changes them. An agent can
also read and search a library as a file, next to the
`oodle_eval` files:
```json
{"action": "library_files", "prefix": "shared/"}
{"action": "read_library_file", "path": "shared/acme_text.py", "version": 2}
{"action": "grep_library", "pattern": "def is_polite", "path_prefix": "shared/"}
```
```json
{"action": "list_code_libraries"}
{"action": "get_code_library", "name": "acme_text"}
{"action": "list_code_library_versions", "name": "acme_text"}
{"action": "get_code_library_version", "name": "acme_text", "version": 2}
```
```json
{"action": "create_code_library", "name": "acme_text", "description": "Text helpers",
"sourceCode": "def clean(s): ..."}
{"action": "update_code_library", "name": "acme_text", "sourceCode": "..."}
{"action": "update_code_library", "name": "acme_text", "restoreVersion": 2}
{"action": "update_template", "id": "", "libraryPins": {"acme_text": 3}}
{"action": "delete_code_library", "name": "acme_text"}
```
`restoreVersion` saves the source of that version as a
new version. `manage_genai_evaluators` does not save
source that is not valid Python, and its reply gives
warnings for imports that cannot load. For more, call
`{"action": "help", "topic": "shared_libraries"}`.
Through the API, the routes are `code-libraries` and
`code-libraries/{id}/versions` under the GenAI API. See
the [API reference](/api/gen-ai-evaluators) for the
request and response shapes.
---
## GPU Monitoring
Oodle's GPU Monitoring gives you full visibility into
your GPU fleet — utilization, memory allocation,
temperature, power draw, and per-process resource
consumption. Works with NVIDIA GPUs using either the
`nvidia_gpu_exporter` (nvidia-smi based) or
`dcgm-exporter`.
## Overview Tab
The Overview tab provides a high-level health summary
of your entire GPU fleet.
### Summary Cards
| Card | Description |
|------|-------------|
| **Total GPUs** | Number of monitored GPU devices |
| **Active GPUs** | GPUs with utilization > 5% |
| **Total Hosts** | Number of hosts with GPUs |
| **Avg Utilization** | Fleet-wide average GPU utilization |
### Alerts & Health
| Alert | Trigger |
|-------|---------|
| **Idle GPUs** | Devices with < 5% utilization |
| **Thermal Throttling** | Devices with active thermal throttle or temp ≥ 85°C |
| **ECC / XID Errors** | Devices reporting memory or XID errors |
| **PCIe Degradation** | Active devices with zero PCIe throughput |
## Hosts Tab
The Hosts tab lists every host that has at least one
GPU installed.
| Column | Description |
|--------|-------------|
| **Host** | Hostname (instance label) |
| **Device** | GPU model name |
| **Health** | Healthy, Throttled, or Error state |
| **Active** | Number of active / total GPUs |
| **CPU** | Host CPU utilization % |
| **Memory** | Host system memory utilization % |
| **GPU** | Average GPU compute utilization % |
| **GPU Mem** | Average GPU VRAM allocation % |
| **ECC** | ECC error count |
| **XID** | XID error count |
Click any host row to open a detail drawer with
devices, processes, and embedded Grafana dashboards.
## Devices Tab
The Devices tab lists every individual GPU device across
all hosts.
| Column | Description |
|--------|-------------|
| **UUID** | GPU device UUID |
| **Model** | GPU model name |
| **Host** | Host the GPU is installed in |
| **Health** | Health status |
| **GPU Util** | Compute utilization % |
| **GPU Mem** | VRAM allocation % |
| **Temp** | Current temperature in °C |
| **Power** | Current power draw in watts |
| **ECC** | ECC error count |
Click any device row to open a detail drawer with
GPU-specific Grafana dashboards and process information.
## Process Monitor
The process monitor shows per-process resource usage on
GPU hosts using `process_exporter` metrics.
| Metric | Description |
|--------|-------------|
| **CPU Rate** | CPU cores consumed |
| **Resident Memory** | Physical memory usage |
| **Read / Write Bytes** | Disk I/O rate |
| **Context Switches** | Rate of context switches |
| **FD Ratio** | File descriptor usage as % of limit |
## Setup
Navigate to **Integrations → GPU Monitoring** to access
the setup wizard, which guides you through:
1. **Choose your exporter** — `nvidia_gpu_exporter`
or `dcgm-exporter`
2. **Install the exporter** — Docker, systemd, or
binary commands provided
3. **Install process exporter** — for per-process
visibility
4. **Configure scraping** — Prometheus or VMAgent
configuration with correct instance labeling
5. **Verify data** — confirm metrics are flowing
### Supported Exporters
| Exporter | Metrics Prefix | Use Case |
|----------|----------------|----------|
| **nvidia_gpu_exporter** | `nvidia_smi_*` | Simple setup, covers most use cases |
| **dcgm-exporter** | `DCGM_FI_*` | Advanced profiling metrics |
### Instance Label
The GPU page identifies hosts by the `instance` label.
The setup wizard configures relabeling to strip the port
from the target address, so you get clean hostnames
(e.g. `gpu-train-01` instead of `gpu-train-01:9835`).
## Grafana Dashboards
Four built-in dashboards are embedded in the UI,
accessible from host and device detail drawers:
| Dashboard | Used In |
|-----------|---------|
| **GPU Host Overview** | Host drawer |
| **NVIDIA GPU Metrics** | Device drawer (nvidia_smi) |
| **DCGM GPU Metrics** | Device drawer (DCGM) |
| **GPU Process Monitor** | Process tab |
The NVIDIA GPU Metrics dashboard provides a deep dive
into a single GPU — real-time utilization, clock speeds,
memory allocation, power draw, fan speed, and throttle
reasons. It automatically filters to the selected device
when opened from the Devices tab.
## Best Practices
- **Use consistent instance labels** — strip ports so
the same host appears as one entity across all metrics.
- **Monitor VRAM allocation** — high usage (>90%) leads
to OOM kills.
- **Watch thermal throttling** — sustained temps above
80°C reduce performance.
- **Track idle GPUs** — idle GPUs waste expensive
compute; use the alert to right-size your fleet.
- **Enable process_exporter** — without it, you lose
visibility into which processes consume resources.
---
## Oodle
Oodle is a fast, fully managed, drop-in replacement for Prometheus and ELK stack at scale.
Oodle helps engineering, and devops teams resolve incidents 5 times faster using AI-powered dashboard-less debugging. It delivers enterprise-grade observability at 1/5th the cost of enterprise-grade offerings using a game changing serverless architecture built from ground up on top of S3.
Oodle combines the security and reliability of enterprise-grade offerings with simplicity and cost-effectiveness of open source products with full open source compatibility with OpenTelemetry, Prometheus, Grafana, ELK stack. Achieve zero management with infinitely scalability.
Make your observability simple, fast and cost-efficient.
---
## Claude Platform
Claude exports OpenTelemetry traces itself, in the
[GenAI semantic conventions](https://opentelemetry.io/docs/specs/semconv/gen-ai/),
so no third-party instrumentation is needed. There are two sources of
spans. Each works on its own, and with both on they form one trace.
| | API tracing | Python SDK tracing |
|---|---|---|
| Sent by | Anthropic's API, server side | The Claude SDK, in your process |
| Setup | An organization admin adds Oodle as a destination, once | Register a tracer provider before the first Claude call |
| Covers | Messages and Sessions requests from any client: SDKs, `curl`, other tools | Every SDK request, the tool runner and your custom tools |
| `service.name` | `claude-platform` | Your service |
| Span kind | `SERVER` | `CLIENT` |
| Model requests inside one call | `anthropic.model_request` | none |
| Server tools (web search, code execution) | `anthropic.tool_use ` | none |
| Managed Agents turns and sandbox tools | `anthropic.session.turn`, `anthropic.tool_use ` | none |
You will need:
- `OODLE_INSTANCE`: your Oodle instance ID ()
- `OODLE_API_KEY`: an Oodle API key ()
- `OTLP_ENDPOINT`: your Oodle OTLP endpoint, `-otlp.collector.oodle.ai`
Open the **Claude Platform** tile on the
page to get these filled in for you, or let an agent do the setup with
`/oodle-onboarding set up the claude_platform_observability integration`.
## API tracing
Anthropic sends a span for every request in the organization, in the
workspaces the destination covers, straight to Oodle. Nothing in your
application changes. Adding the destination needs an organization
**admin** (or owner).
### In the Claude Console
Go to **Settings > OpenTelemetry**
([platform.claude.com/settings/telemetry-destinations](https://platform.claude.com/settings/telemetry-destinations)),
click **Add destination**, select **Custom**, and enter:
| Field | Value |
|---|---|
| Endpoint URL | `https://` (the base URL: Anthropic appends `/v1/traces`) |
| Headers | `X-OODLE-INSTANCE: ` and `X-API-KEY: ` |
| Maximum content size | `750000` bytes |
| Content mode | `content` or `metadata_only` |
The **Delivery** column shows **Healthy** once spans arrive, about a
minute after the first request.
### With the ant CLI
The same destination, created with the
[`ant` CLI](https://docs.claude.com/en/api/sdks/cli)
(`brew install anthropics/tap/ant`) and `jq`:
```bash
# Once, as an organization admin. Approve the login in the browser.
ant auth login --profile admin --scope "org:admin"
export OODLE_API_KEY=""
# content: prompts and responses on the spans.
# metadata_only: ids, timing, status and token counts only.
jq -n '{headers: {
"X-OODLE-INSTANCE": "",
"X-API-KEY": env.OODLE_API_KEY
}}' | env -u ANTHROPIC_API_KEY -u ANTHROPIC_AUTH_TOKEN -u ANTHROPIC_BASE_URL \
ant --profile admin \
beta:organization:telemetry-destinations create \
--display-name "Oodle ()" \
--endpoint-url "https://" \
--traces '{"content_mode": "content", "max_content_bytes": 750000}' \
--workspaces '{"type": "all"}' \
--format json
```
The headers go in on stdin, so the Oodle key is not on a command line.
`env -u` keeps an API key or base URL in your shell from taking the
place of the admin login. Anthropic never returns header values: the
reply lists only `header_names`, which must include `X-API-KEY`. To
cover only some workspaces, pass
`--workspaces '{"type": "include", "workspace_ids": ["wrkspc_..."]}'`.
Check delivery: the destination is healthy when `state` is `enabled`
and `last_success_at` is set.
```bash
env -u ANTHROPIC_API_KEY -u ANTHROPIC_AUTH_TOKEN -u ANTHROPIC_BASE_URL \
ant --profile admin \
beta:organization:telemetry-destinations list --format jsonl |
jq '{display_name, state: .state.type,
last_success_at: .delivery_health.last_success_at,
last_error: .delivery_health.last_error}'
```
Run `ant auth logout --profile admin` when you are done.
### Content mode
`content` puts prompts and responses on the spans, which the
**Transcript** view reads. Oodle then stores that text under its
retention and access controls. Images and documents are sent as their
type only. `metadata_only` sends ids, timing, status and token counts.
### Joining your own trace
Anthropic makes its span of a request a child of the span named in the
W3C `traceparent` header of that request. The Claude SDKs send the
header for you. From any other client, send it yourself, with the
sampled flag on:
```bash
TRACE_ID=$(openssl rand -hex 16); SPAN_ID=$(openssl rand -hex 8)
curl https://api.anthropic.com/v1/messages \
-H "x-api-key: $ANTHROPIC_API_KEY" \
-H "anthropic-version: 2023-06-01" \
-H "content-type: application/json" \
-H "traceparent: 00-$TRACE_ID-$SPAN_ID-01" \
-d '{"model": "claude-opus-5-5", "max_tokens": 256,
"messages": [{"role": "user", "content": "Hello"}]}'
echo "Search Oodle for trace $TRACE_ID"
```
In an application with OpenTelemetry, inject the current span context
into the request headers instead, for example with
`TraceContextTextMapPropagator().inject(headers)` in Python.
## Python SDK tracing
The `anthropic` Python SDK emits a span for every request through the
tracer provider your application registers. No destination or admin is
needed.
### Install
```bash
pip install "anthropic>=1.14.0" \
opentelemetry-sdk \
opentelemetry-exporter-otlp-proto-http
```
### Instrument
```python
from opentelemetry import trace
from opentelemetry.exporter.otlp.proto.http.trace_exporter import OTLPSpanExporter
from opentelemetry.sdk.resources import Resource
from opentelemetry.sdk.trace import TracerProvider
from opentelemetry.sdk.trace.export import BatchSpanProcessor
# Register the tracer provider before the first Claude call.
provider = TracerProvider(
resource=Resource.create({"service.name": "my-llm-app"})
)
provider.add_span_processor(BatchSpanProcessor(OTLPSpanExporter()))
trace.set_tracer_provider(provider)
# Unchanged: every request it sends is now traced.
client = anthropic.Anthropic()
message = client.messages.create(
model="claude-opus-5-5",
max_tokens=1024,
messages=[{"role": "user", "content": "Hello!"}],
)
# Short-lived processes must flush before they exit.
provider.shutdown()
```
### Environment
Straight to Oodle:
```bash
# OTLP endpoint (points straight at Oodle)
export OTEL_EXPORTER_OTLP_ENDPOINT=https://
export OTEL_EXPORTER_OTLP_HEADERS="X-API-KEY=,X-OODLE-INSTANCE="
# Compress the export: prompt payloads are large
export OTEL_EXPORTER_OTLP_COMPRESSION=gzip
# Prompts and responses on the spans. The SDK default,
# metadata_only, sends ids, timing, status and token counts.
export ANTHROPIC_OPEN_TELEMETRY_TRACES_CONTENT_MODE=content
```
Or through an OpenTelemetry Collector, where redaction and sampling
belong:
```bash
# OTLP endpoint (points to your OTel Collector)
export OTEL_EXPORTER_OTLP_ENDPOINT=http://otel-collector:4318
# Prompts and responses on the spans. The SDK default,
# metadata_only, sends ids, timing, status and token counts.
export ANTHROPIC_OPEN_TELEMETRY_TRACES_CONTENT_MODE=content
```
```yaml
receivers:
otlp:
protocols:
http:
endpoint: "0.0.0.0:4318"
processors:
batch:
timeout: 5s
send_batch_size: 512
exporters:
otlphttp/oodle:
endpoint: "https://"
# GenAI spans carry whole prompts, and a batch is bounded
# by span count rather than bytes, so an uncompressed
# export can exceed the ingress body limit and be refused.
compression: gzip
headers:
"X-OODLE-INSTANCE": ""
"X-API-KEY": ""
service:
pipelines:
traces:
receivers: [otlp]
processors: [batch]
exporters: [otlphttp/oodle]
```
### SDK options
| Setting | Effect |
|---|---|
| `ANTHROPIC_OPEN_TELEMETRY_TRACES_CONTENT_MODE` | `content` or `metadata_only` (the default) |
| `ANTHROPIC_OPEN_TELEMETRY_TRACES_MAX_CONTENT_BYTES` | The content limit of one span (default `750000`). Past it, the oldest messages are dropped and the span carries `anthropic.content.truncated=true` |
| `ANTHROPIC_OPEN_TELEMETRY=false` | No SDK spans. Use it when another Anthropic instrumentation already traces the SDK |
| `Anthropic(open_telemetry={...})` | The same options in code. When given, the client reads none of the environment variables |
To group the requests of one conversation, set a conversation id:
`client.with_options(open_telemetry={**client.open_telemetry, "conversation_id": "..."})`.
Every span then carries `gen_ai.conversation.id`. `with_options`
replaces the whole option, so spread `client.open_telemetry` into it to
keep the content mode.
## Using both sources
With both on, the SDK's `CLIENT` span of a request is the parent of
Anthropic's `SERVER` span of the same request, and both have the same
name:
```
anthropic.messages.tool_runner my-llm-app
├─ anthropic.messages.create [CLIENT] my-llm-app
│ └─ anthropic.messages.create [SERVER] claude-platform
│ └─ anthropic.model_request claude-platform
├─ anthropic.custom_tool_use get_weather my-llm-app
└─ anthropic.messages.create [CLIENT] my-llm-app
└─ anthropic.messages.create [SERVER] claude-platform
└─ anthropic.model_request claude-platform
```
Both spans of a request carry token counts. Read token and cost totals
from one source: in , filter on service
`claude-platform`.
## Managed Agents
A Claude Managed Agents session uses both sources. The SDK sends an
`anthropic.sessions.*` span for each Sessions API request. Anthropic
sends what the agent does: an `anthropic.session.turn` span per turn,
its `anthropic.model_request` spans, and an `anthropic.tool_use `
span for each sandbox tool (`bash`, `write`, ...).
```
anthropic.sessions.events.send [CLIENT] my-llm-app
└─ anthropic.sessions.events.send [SERVER] claude-platform
└─ anthropic.session.turn claude-platform
├─ anthropic.model_request
├─ anthropic.tool_use write
├─ anthropic.tool_use bash
└─ anthropic.model_request
```
## Verify
Send a request to Claude, then open :
- Filter on service `claude-platform` for the spans Anthropic sends.
Each one shares a trace id with the span whose `traceparent` it
received.
- Filter on your own service for the SDK spans:
`anthropic.messages.create`, `anthropic.messages.tool_runner`,
`anthropic.custom_tool_use ` and `anthropic.messages.count_tokens`.
Click a trace for the Transcript, the waterfall and the cost breakdown.
## Demo application
[claude-opentelemetry-demo](https://github.com/oodle-ai/oodle-onboarding/tree/main/claude-opentelemetry-demo)
runs all three cases against Oodle: the Messages API over plain HTTP
traced by API tracing, the Python SDK (create, stream, tool runner,
count tokens, a conversation), and a Managed Agents session that runs
code in its sandbox.
## Troubleshooting
| Symptom | Check |
|---|---|
| `400 ... must include the anthropic-workspace-id header` | The Anthropic API key is not scoped to a workspace. Send the `anthropic-workspace-id` header, and make sure the destination covers that workspace |
| No `claude-platform` spans | List the destinations: the destination must be `enabled` and cover the workspace of the API key. Allow about a minute after creating it |
| Destination failing with 401 or 403 | The `X-API-KEY` or `X-OODLE-INSTANCE` header is wrong |
| `claude-platform` spans in traces of their own | The request had no `traceparent` header, or its sampled flag was off |
| No SDK spans | The tracer provider is registered before the first Claude call, and `ANTHROPIC_OPEN_TELEMETRY` is not `false` |
| Each request appears twice | Those are the `CLIENT` span and the `SERVER` span of one request. If a third-party Anthropic instrumentation is also installed, set `ANTHROPIC_OPEN_TELEMETRY=false` |
OpenTelemetry export from Claude is in beta, so span names and
attributes can change between SDK versions.
---
## CrewAI
The CrewAI instrumentation traces the crew, its tasks and its agents; the OpenAI instrumentation traces the model calls under them.
You will need:
- `OODLE_INSTANCE`: your Oodle instance ID ()
- `OODLE_API_KEY`: an Oodle API key ()
- `OTLP_ENDPOINT`: your OTLP collector domain, shown on the tile
Open the **CrewAI** tile on the page to
get these filled in for you, or let an agent do the setup with
`/oodle-onboarding set up the llm_observability_crewai integration`.
### Install
Install CrewAI with the CrewAI and OpenAI OTel instrumentations:
```bash
pip install crewai \
opentelemetry-instrumentation-crewai \
opentelemetry-instrumentation-openai \
opentelemetry-exporter-otlp-proto-http \
opentelemetry-sdk
```
### Instrument
Initialize OpenTelemetry and activate both instrumentors. The CrewAI one traces the crew, its tasks and agents; the OpenAI one traces the model calls underneath them:
```python
from crewai import Agent, Crew, Task
from opentelemetry.exporter.otlp.proto.http.trace_exporter import OTLPSpanExporter
from opentelemetry.instrumentation.crewai import CrewAIInstrumentor
from opentelemetry.instrumentation.openai import OpenAIInstrumentor
from opentelemetry.sdk.resources import Resource
from opentelemetry.sdk.trace import TracerProvider
from opentelemetry.sdk.trace.export import BatchSpanProcessor
from opentelemetry.trace import set_tracer_provider
def setup_opentelemetry():
resource = Resource.create({"service.name": "my-llm-app"})
tracer_provider = TracerProvider(resource=resource)
tracer_provider.add_span_processor(
BatchSpanProcessor(OTLPSpanExporter())
)
set_tracer_provider(tracer_provider)
setup_opentelemetry()
# The CrewAI instrumentor traces the crew, tasks and agents.
# The OpenAI instrumentor traces the model calls under them:
# without it the run arrives with no generations.
CrewAIInstrumentor().instrument()
OpenAIInstrumentor().instrument()
researcher = Agent(
role="Researcher",
goal="Answer the question in one sentence",
backstory="You answer briefly.",
llm="openai/gpt-4o-mini",
)
task = Task(
description="What is the capital of France?",
expected_output="One sentence.",
agent=researcher,
)
crew = Crew(agents=[researcher], tasks=[task])
print(crew.kickoff().raw)
```
### Environment
Point the application at Oodle:
```bash
# OTLP endpoint (points straight at Oodle)
export OTEL_EXPORTER_OTLP_ENDPOINT=https://
export OTEL_EXPORTER_OTLP_HEADERS="X-API-KEY=,X-OODLE-INSTANCE="
# Compress the export: prompt payloads are large
export OTEL_EXPORTER_OTLP_COMPRESSION=gzip
# Optional: disable prompt/response capture
# export TRACELOOP_TRACE_CONTENT=false
```
## Verify
Run your application, then open . Spans
carry `gen_ai.*` attributes: the model, token counts, and the prompt and
response content. Click a trace for the Transcript, the waterfall, and
the cost breakdown.
If nothing arrives, check that the exporter can reach
`https://` and that the instance and key are set: the
OTLP gateway answers `401` without them.
---
## ElevenLabs Agents
ElevenLabs Agents export every finished call as an OpenTelemetry trace in a post-call webhook. Point that webhook at Oodle and each voice or chat conversation arrives with its turns, LLM calls, tool calls, tokens and cost. There is no code to add to the agent.
You will need:
- `OODLE_INSTANCE`: your Oodle instance ID ()
- `OODLE_API_KEY`: an Oodle API key ()
- `OTLP_ENDPOINT`: your OTLP collector domain, shown on the tile
Open the **ElevenLabs Agents** tile on the page to
get these filled in for you, or let an agent do the setup with
`/oodle-onboarding set up the llm_observability_elevenlabs integration`.
## Python
### Install
Install the ElevenLabs SDK. ElevenLabs runs the agent and exports each conversation as an OpenTelemetry trace, so there is nothing to instrument:
```bash
pip install elevenlabs
```
### Instrument
Create a post-call webhook that sends each conversation as an OpenTelemetry trace, and attach it to your agent. Every call then arrives with its turns, LLM calls, tool calls, tokens and cost:
```python
# setup_webhook.py: run once
from elevenlabs import ElevenLabs
client = ElevenLabs(api_key=os.environ["ELEVENLABS_API_KEY"])
webhook = client.webhooks.create(
settings={
"auth_type": "hmac",
"name": "Oodle Agent Observability",
"webhook_url": "https:///v1/otlp/traces/elevenlabs",
# Sent with every delivery: Oodle authenticates with them.
"request_headers": {
"X-API-KEY": "",
"X-OODLE-INSTANCE": "",
},
}
)
# Retry a failed delivery, so that no call is lost.
client.webhooks.update(
webhook.webhook_id,
name="Oodle Agent Observability",
is_disabled=False,
retry_enabled=True,
)
# Send every conversation of the agent as an OpenTelemetry trace.
# For all agents, pass the same webhooks to
# client.conversational_ai.settings.update(webhooks=...).
client.conversational_ai.agents.update(
os.environ["ELEVENLABS_AGENT_ID"],
platform_settings={
"workspace_overrides": {
"webhooks": {
"post_call_webhook_id": webhook.webhook_id,
"events": ["transcript"],
"transcript_format": "opentelemetry",
}
}
},
)
```
### Environment
Set these for the setup script:
```bash
export ELEVENLABS_API_KEY=
export ELEVENLABS_AGENT_ID=
```
## TypeScript / JavaScript
### Install
Install the ElevenLabs SDK. ElevenLabs runs the agent and exports each conversation as an OpenTelemetry trace, so there is nothing to instrument:
```bash
npm install @elevenlabs/elevenlabs-js
```
### Instrument
Create a post-call webhook that sends each conversation as an OpenTelemetry trace, and attach it to your agent. Every call then arrives with its turns, LLM calls, tool calls, tokens and cost:
```typescript
// setup-webhook.ts: run once
const client = new ElevenLabsClient({
apiKey: process.env.ELEVENLABS_API_KEY,
});
const webhook = await client.webhooks.create({
settings: {
authType: 'hmac',
name: 'Oodle Agent Observability',
webhookUrl: 'https:///v1/otlp/traces/elevenlabs',
// Sent with every delivery: Oodle authenticates with them.
requestHeaders: {
'X-API-KEY': '',
'X-OODLE-INSTANCE': '',
},
},
});
// Retry a failed delivery, so that no call is lost.
await client.webhooks.update(webhook.webhookId, {
name: 'Oodle Agent Observability',
isDisabled: false,
retryEnabled: true,
});
// Send every conversation of the agent as an OpenTelemetry trace.
// For all agents, pass the same webhooks to
// client.conversationalAi.settings.update({ webhooks }).
await client.conversationalAi.agents.update(
process.env.ELEVENLABS_AGENT_ID!,
{
platformSettings: {
workspaceOverrides: {
webhooks: {
postCallWebhookId: webhook.webhookId,
events: ['transcript'],
transcriptFormat: 'opentelemetry',
},
},
},
}
);
```
### Environment
Set these for the setup script:
```bash
export ELEVENLABS_API_KEY=
export ELEVENLABS_AGENT_ID=
```
## Through your own service
To keep the Oodle API key out of ElevenLabs, or to redact the
transcript before it leaves your network, point the webhook at a
forwarder in your service instead. It checks the webhook signature
and posts the trace to your OpenTelemetry Collector as it is, and the
collector exports to Oodle as described on the
[OpenTelemetry](../opentelemetry) page.
### Python
```bash
pip install elevenlabs fastapi uvicorn requests
```
```python
# setup_webhook.py: run once
from elevenlabs import ElevenLabs
client = ElevenLabs(api_key=os.environ["ELEVENLABS_API_KEY"])
webhook = client.webhooks.create(
settings={
"auth_type": "hmac",
"name": "Oodle Agent Observability",
# Where you run forwarder.py (below), reachable from the internet.
"webhook_url": "https:///elevenlabs/post-call",
}
)
# Give this secret to the forwarder: it checks deliveries with it.
print("ELEVENLABS_WEBHOOK_SECRET=" + webhook.webhook_secret)
# Retry a failed delivery, so that no call is lost.
client.webhooks.update(
webhook.webhook_id,
name="Oodle Agent Observability",
is_disabled=False,
retry_enabled=True,
)
# Send every conversation of the agent as an OpenTelemetry trace.
# For all agents, pass the same webhooks to
# client.conversational_ai.settings.update(webhooks=...).
client.conversational_ai.agents.update(
os.environ["ELEVENLABS_AGENT_ID"],
platform_settings={
"workspace_overrides": {
"webhooks": {
"post_call_webhook_id": webhook.webhook_id,
"events": ["transcript"],
"transcript_format": "opentelemetry",
}
}
},
)
# forwarder.py: run it at the webhook URL above. It checks
# each delivery and posts the trace to your collector.
from elevenlabs import ElevenLabs
from fastapi import FastAPI, HTTPException, Request
client = ElevenLabs(api_key=os.environ["ELEVENLABS_API_KEY"])
app = FastAPI()
@app.post("/elevenlabs/post-call")
async def post_call(request: Request):
body = (await request.body()).decode()
try:
event = client.webhooks.construct_event(
rawBody=body,
sig_header=request.headers.get("elevenlabs-signature", ""),
secret=os.environ["ELEVENLABS_WEBHOOK_SECRET"],
)
except Exception:
raise HTTPException(status_code=401)
if event["type"] == "post_call_transcription_otel":
# The trace is OTLP/JSON already: post it as it is.
response = requests.post(
"http://otel-collector:4318/v1/traces",
json=event["data"]["otlp_traces"],
timeout=30,
)
if not response.ok:
# ElevenLabs retries a delivery that fails.
raise HTTPException(status_code=502)
return {"ok": True}
```
### TypeScript / JavaScript
```bash
npm install @elevenlabs/elevenlabs-js express
```
```typescript
// setup-webhook.ts: run once
const client = new ElevenLabsClient({
apiKey: process.env.ELEVENLABS_API_KEY,
});
const webhook = await client.webhooks.create({
settings: {
authType: 'hmac',
name: 'Oodle Agent Observability',
// Where you run forwarder.ts (below), reachable from the internet.
webhookUrl: 'https:///elevenlabs/post-call',
},
});
// Give this secret to the forwarder: it checks deliveries with it.
console.log(`ELEVENLABS_WEBHOOK_SECRET=${webhook.webhookSecret}`);
// Retry a failed delivery, so that no call is lost.
await client.webhooks.update(webhook.webhookId, {
name: 'Oodle Agent Observability',
isDisabled: false,
retryEnabled: true,
});
// Send every conversation of the agent as an OpenTelemetry trace.
// For all agents, pass the same webhooks to
// client.conversationalAi.settings.update({ webhooks }).
await client.conversationalAi.agents.update(
process.env.ELEVENLABS_AGENT_ID!,
{
platformSettings: {
workspaceOverrides: {
webhooks: {
postCallWebhookId: webhook.webhookId,
events: ['transcript'],
transcriptFormat: 'opentelemetry',
},
},
},
}
);
// forwarder.ts: run it at the webhook URL above. It checks
// each delivery and posts the trace to your collector.
const client = new ElevenLabsClient({
apiKey: process.env.ELEVENLABS_API_KEY,
});
const app = express();
// The signature covers the raw body, so read it as text.
app.post('/elevenlabs/post-call', express.text({ type: '*/*' }), async (req, res) => {
let event;
try {
event = await client.webhooks.constructEvent(
req.body,
req.header('elevenlabs-signature') ?? '',
process.env.ELEVENLABS_WEBHOOK_SECRET!
);
} catch {
return res.status(401).end();
}
if (event.type === 'post_call_transcription_otel') {
// The trace is OTLP/JSON already: post it as it is.
const response = await fetch('http://otel-collector:4318/v1/traces', {
method: 'POST',
headers: { 'Content-Type': 'application/json' },
body: JSON.stringify(event.data.otlp_traces),
});
// ElevenLabs retries a delivery that fails.
if (!response.ok) return res.status(502).end();
}
res.status(200).end();
});
app.listen(8787);
```
## What each call becomes
ElevenLabs describes a conversation with `elevenlabs.*` attributes, and
Oodle maps them onto the GenAI conventions when the trace arrives:
| ElevenLabs span | In Oodle |
|---|---|
| `elevenlabs.conversation` | The agent run, named after the agent, with the conversation id as the session |
| `elevenlabs.recv.agent_response` with LLM usage | An LLM call: the model, input, output and cached tokens, and the cost ElevenLabs reports. Its input is the conversation up to that turn, tool results included |
| `elevenlabs.tool.` | A tool call, with its parameters and result |
| `elevenlabs.recv.user_transcript` | The caller's words, shown in the transcript |
Each conversation is one trace, and the conversation id is its session,
so the Sessions view groups calls by conversation. Start a
conversation with a user id (the `user_id` option of the ElevenLabs
SDKs) to group calls by caller as well.
## An agent that already has a post-call webhook
An agent has one post-call webhook. If yours already goes to your own
service, keep it and forward the trace from there: the forwarder above
does that for the OpenTelemetry format. For the JSON format, fetch the
trace of each conversation with the ElevenLabs SDK
(`conversations.get(conversation_id, format="opentelemetry")`) and post
its `otlp_traces` to `https:///v1/traces` with the two
Oodle headers. Send each conversation once: ElevenLabs makes new span
ids on every export.
## Verify
Make a call to the agent, by phone, in the ElevenLabs dashboard or
with the widget. ElevenLabs sends the trace when its analysis of the
call is done, about a minute after the call ends. Then open
and click the call for the
Transcript, the waterfall and the cost breakdown.
If nothing arrives, open the webhook in the ElevenLabs dashboard: a
failed delivery shows the status Oodle answered. A `400` means the
transcript format is not OpenTelemetry, and a `401` means the
instance or the key in the webhook headers is wrong.
---
## eve
eve traces every turn of an agent session: the model calls, the steps between them, tool executions and subagent runs, with the session id on each span as `gen_ai.conversation.id`.
You will need:
- `OODLE_INSTANCE`: your Oodle instance ID ()
- `OODLE_API_KEY`: an Oodle API key ()
- `OTLP_ENDPOINT`: your OTLP collector domain, shown on the tile
Open the **eve** tile on the page to
get these filled in for you, or let an agent do the setup with
`/oodle-onboarding set up the llm_observability_eve integration`.
### Install
Add the Oodle destination from the eve registry (eve 0.62.0 or later). It installs `@vercel/otel` and writes `agent/instrumentation/oodle.ts`:
```bash
npx eve add instrumentation/oodle
```
### Instrument
Remove the `exportPolicy` from the generated `agent/instrumentation/oodle.ts`: it redacts every prompt and reply. Then add `otel.ts` to authorize content. eve owns the tracer provider, names the service after the agent, and traces every turn, step and tool call:
```typescript
// agent/instrumentation/otel.ts
export default otel({
// eve withholds the messages for every conversation its
// channel does not classify as public. Tokens, cost and the
// span tree arrive without this; the transcript does not.
tracePolicy: () => ({
emit: true,
recordInputs: true,
recordOutputs: true,
}),
});
// agent/instrumentation/oodle.ts
// The registry file also sets an exportPolicy that redacts
// every prompt and reply. Without it the Transcript is kept.
export default otelIntegration({
traceExporter: new OTLPHttpProtoTraceExporter({
url: `https://${process.env.OODLE_OTLP_ENDPOINT}/v1/traces`,
headers: {
'X-API-KEY': process.env.OODLE_API_KEY!,
'X-OODLE-INSTANCE': process.env.OODLE_INSTANCE!,
},
}),
});
```
### Environment
Point the application at Oodle:
```bash
# eve add puts these names in .env.local.
# The endpoint is the host only, without https://
export OODLE_OTLP_ENDPOINT=
export OODLE_API_KEY=
export OODLE_INSTANCE=
# Compress the export: prompt payloads are large
export OTEL_EXPORTER_OTLP_COMPRESSION=gzip
```
## Where the transcript comes from
eve withholds model messages for every conversation its channel does
not classify as `public`. The `tracePolicy` above authorizes both
directions, but it cannot exceed that ceiling: the base eve HTTP
channel, direct messages and private threads stay metadata-only, so
the spans carry the model, token counts, cost and the tool names with
no prompts or replies on them.
A channel classifies itself through its `metadata` projection:
```typescript
export default defineChannel({
metadata: () => ({ audience: 'public' as const }),
routes: [
/* ... */
],
});
```
Slack's public channels and Chat SDK workspace threads already
classify themselves this way, so they need no change. Set it only
where the conversation really is visible to a group, and only when
Oodle is approved to receive that content.
## Verify
Run your application, then open . Spans
carry `gen_ai.*` attributes: the model, token counts, and the prompt and
response content. Click a trace for the Transcript, the waterfall, and
the cost breakdown.
If nothing arrives, check that the exporter can reach
`https://` and that the instance and key are set: the
OTLP gateway answers `401` without them.
---
## Google Gemini
The OpenTelemetry GenAI instrumentation patches the google-genai SDK, so every Gemini call is traced.
You will need:
- `OODLE_INSTANCE`: your Oodle instance ID ()
- `OODLE_API_KEY`: an Oodle API key ()
- `OTLP_ENDPOINT`: your OTLP collector domain, shown on the tile
Open the **Google Gemini** tile on the page to
get these filled in for you, or let an agent do the setup with
`/oodle-onboarding set up the llm_observability_gemini integration`.
### Install
Install the OpenTelemetry GenAI instrumentation:
```bash
pip install opentelemetry-instrumentation-google-genai \
opentelemetry-exporter-otlp-proto-http \
opentelemetry-sdk \
google-genai
```
### Instrument
Initialize OpenTelemetry and activate the GenAI instrumentor. After this, all LLM SDK calls are automatically traced:
```python
from opentelemetry import _logs as otel_logs
from opentelemetry import trace as otel_trace
from opentelemetry.exporter.otlp.proto.http._log_exporter import OTLPLogExporter
from opentelemetry.exporter.otlp.proto.http.trace_exporter import OTLPSpanExporter
from opentelemetry.instrumentation.google_genai import GoogleGenAiSdkInstrumentor
from opentelemetry.sdk._logs import LoggerProvider
from opentelemetry.sdk._logs.export import BatchLogRecordProcessor
from opentelemetry.sdk.resources import Resource
from opentelemetry.sdk.trace import TracerProvider
from opentelemetry.sdk.trace.export import BatchSpanProcessor
def setup_opentelemetry():
resource = Resource.create({"service.name": "my-llm-app"})
tracer_provider = TracerProvider(resource=resource)
tracer_provider.add_span_processor(BatchSpanProcessor(OTLPSpanExporter()))
otel_trace.set_tracer_provider(tracer_provider)
logger_provider = LoggerProvider(resource=resource)
logger_provider.add_log_record_processor(
BatchLogRecordProcessor(OTLPLogExporter())
)
otel_logs.set_logger_provider(logger_provider)
setup_opentelemetry()
GoogleGenAiSdkInstrumentor().instrument()
```
### Environment
Point the application at Oodle:
```bash
# OTLP endpoint (points straight at Oodle)
export OTEL_EXPORTER_OTLP_ENDPOINT=https://
export OTEL_EXPORTER_OTLP_HEADERS="X-API-KEY=,X-OODLE-INSTANCE="
# Compress the export: prompt payloads are large
export OTEL_EXPORTER_OTLP_COMPRESSION=gzip
# Enable GenAI semantic conventions
export OTEL_SEMCONV_STABILITY_OPT_IN=gen_ai_latest_experimental
# Capture prompt/response content
export OTEL_INSTRUMENTATION_GENAI_CAPTURE_MESSAGE_CONTENT=span_and_event
```
## Verify
Run your application, then open . Spans
carry `gen_ai.*` attributes: the model, token counts, and the prompt and
response content. Click a trace for the Transcript, the waterfall, and
the cost breakdown.
If nothing arrives, check that the exporter can reach
`https://` and that the instance and key are set: the
OTLP gateway answers `401` without them.
---
## Haystack
Haystack's OpenTelemetry connector traces the pipeline and each component; the OpenAI instrumentation traces the model calls.
You will need:
- `OODLE_INSTANCE`: your Oodle instance ID ()
- `OODLE_API_KEY`: an Oodle API key ()
- `OTLP_ENDPOINT`: your OTLP collector domain, shown on the tile
Open the **Haystack** tile on the page to
get these filled in for you, or let an agent do the setup with
`/oodle-onboarding set up the llm_observability_haystack integration`.
### Install
Install Haystack with its OpenTelemetry integration and the OpenAI OTel instrumentation:
```bash
pip install haystack-ai opentelemetry-haystack \
opentelemetry-instrumentation-openai \
opentelemetry-exporter-otlp-proto-http \
opentelemetry-sdk
```
### Instrument
Initialize OpenTelemetry, activate the OpenAI instrumentor, and add the OpenTelemetry connector to the pipeline. Haystack then traces the pipeline and each component; the OpenAI instrumentor traces the model calls:
```python
from haystack import Pipeline
from haystack.components.builders import ChatPromptBuilder
from haystack.components.generators.chat import OpenAIChatGenerator
from haystack.dataclasses import ChatMessage
from haystack_integrations.components.connectors.opentelemetry import OpenTelemetryConnector
from opentelemetry.exporter.otlp.proto.http.trace_exporter import OTLPSpanExporter
from opentelemetry.instrumentation.openai import OpenAIInstrumentor
from opentelemetry.sdk.resources import Resource
from opentelemetry.sdk.trace import TracerProvider
from opentelemetry.sdk.trace.export import BatchSpanProcessor
from opentelemetry.trace import set_tracer_provider
def setup_opentelemetry():
resource = Resource.create({"service.name": "my-llm-app"})
tracer_provider = TracerProvider(resource=resource)
tracer_provider.add_span_processor(
BatchSpanProcessor(OTLPSpanExporter())
)
set_tracer_provider(tracer_provider)
setup_opentelemetry()
# Puts the prompt, completion and token counts on the model calls.
OpenAIInstrumentor().instrument()
pipeline = Pipeline()
# Traces the pipeline run and every component in it. It connects
# to nothing; adding it is enough.
pipeline.add_component("tracer", OpenTelemetryConnector("my-pipeline"))
pipeline.add_component(
"prompt",
ChatPromptBuilder(
template=[ChatMessage.from_user("Answer in one sentence: {{question}}")],
required_variables=["question"],
),
)
pipeline.add_component("llm", OpenAIChatGenerator(model="gpt-4o-mini"))
pipeline.connect("prompt.prompt", "llm.messages")
result = pipeline.run({"prompt": {"question": "What is the capital of France?"}})
print(result["llm"]["replies"][0].text)
```
### Environment
Point the application at Oodle:
```bash
# OTLP endpoint (points straight at Oodle)
export OTEL_EXPORTER_OTLP_ENDPOINT=https://
export OTEL_EXPORTER_OTLP_HEADERS="X-API-KEY=,X-OODLE-INSTANCE="
# Compress the export: prompt payloads are large
export OTEL_EXPORTER_OTLP_COMPRESSION=gzip
# Put component inputs and outputs on the Haystack spans
export HAYSTACK_CONTENT_TRACING_ENABLED=true
```
## Verify
Run your application, then open . Spans
carry `gen_ai.*` attributes: the model, token counts, and the prompt and
response content. Click a trace for the Transcript, the waterfall, and
the cost breakdown.
If nothing arrives, check that the exporter can reach
`https://` and that the instance and key are set: the
OTLP gateway answers `401` without them.
---
## Agent Observability(Agent-observability)
Oodle ingests LLM and agent traces that follow the
[OpenTelemetry GenAI semantic conventions](https://opentelemetry.io/docs/specs/semconv/gen-ai/),
and resolves the SDK-specific spellings onto them at ingest. Whichever
instrumentation you use, the result is the same: prompts, system
instructions, model output, token counts and cost, on one trace.
## Pick your instrumentation
Each page below is the setup for one SDK. Every snippet on them is the
snippet the matching tile on the page
shows, so the two cannot disagree.
| Instrumentation | Languages | Good for |
|---|---|---|
| [Langfuse](./langfuse) | Python, TypeScript | Prompt management alongside tracing |
| [Vercel AI SDK](./vercel) | TypeScript | Agents, steps and tool calls in the AI SDK |
| [eve](./eve) | TypeScript | Agents built on Vercel's eve framework |
| [OpenAI](./openai) | Python, TypeScript | Direct OpenAI SDK calls |
| [LangChain](./langchain) | Python, TypeScript | LangChain chains and LangGraph agents |
| [LangGraph](./langgraph) | Python, TypeScript | Graphs built on StateGraph: nodes, model calls and tool calls |
| [Pydantic AI](./pydantic) | Python | Pydantic AI agents |
| [Google Gemini](./gemini) | Python | The google-genai SDK |
| [LiteLLM](./litellm) | Python | One SDK or proxy in front of many providers |
| [Traceloop](./traceloop) | Python, TypeScript | OpenLLMetry across many SDKs |
| [OpenLIT](./openlit) | Python, TypeScript | LLMs plus vector DBs, MCP tools and GPU metrics |
| [OpenAI Agents SDK](./openai_agents) | Python | Agents, tool calls and handoffs in the Agents SDK |
| [CrewAI](./crewai) | Python | Crews, tasks and agents |
| [LlamaIndex](./llamaindex) | Python | LlamaIndex agents and workflows |
| [Haystack](./haystack) | Python | Haystack pipelines and components |
| [Mastra](./mastra) | TypeScript | Mastra agents, tools and workflows |
| [ElevenLabs Agents](./elevenlabs) | Any | ElevenLabs voice agents: every call, with no code |
| [OpenCode](./opencode) | Any | OpenCode sessions, through the Langfuse OpenCode plugin |
| [Claude Platform](./claude-platform) | Any, plus Python SDK | Claude API and Managed Agents requests, traced by Anthropic and by the Claude SDK |
Already exporting OpenTelemetry GenAI spans from something not listed
here? Point the exporter at Oodle and they are ingested the same way.
## Moving from another backend
Every instrumentation above exports over OTLP, so a move to Oodle is
an endpoint and a header change, with no change to the application
code:
```bash
export OTEL_EXPORTER_OTLP_ENDPOINT=https://
export OTEL_EXPORTER_OTLP_HEADERS="X-API-KEY=,X-OODLE-INSTANCE="
```
To compare before you switch, add Oodle as a second exporter in your
collector, or as a second span processor in the SDK, and remove the
old one when you are done. The SDK generates the trace IDs, so a trace
you find in one backend is the same trace in the other.
## Two ways to export
Every page offers the same choice, and it is only ever an endpoint
change:
- **Through a collector.** Your application exports to an
OpenTelemetry Collector you run, and the collector forwards to
Oodle. Redaction and sampling belong here.
- **Straight to Oodle.** No collector to run. There is no redaction
step in this path, so use the SDK options to limit what is
captured.
## Setup with an agent
Every integration on this page ships a machine-readable setup spec, so
a coding agent can do the work:
```bash
npx skills add oodle-ai/agent-skills -y
```
Then, in your agent:
```text
/oodle-onboarding set up the llm_observability_langfuse integration
```
Swap the last segment for the instrumentation you want, for example
`llm_observability_vercel`.
## What you get
- **Traces** with the full transcript, at
- **Token counts and cost**, per call and aggregated by model
- **Agent structure**: agent runs, steps, tool calls and handoffs, where
the SDK emits them
- **Signals**: model-free behavioural indicators computed at ingest, see
[Signals](/agent-observability/signals)
---
## LangChain
The LangChain instrumentation traces chains, LLM calls, tools and retrievers, including LangGraph agents.
You will need:
- `OODLE_INSTANCE`: your Oodle instance ID ()
- `OODLE_API_KEY`: an Oodle API key ()
- `OTLP_ENDPOINT`: your OTLP collector domain, shown on the tile
Open the **LangChain** tile on the page to
get these filled in for you, or let an agent do the setup with
`/oodle-onboarding set up the llm_observability_langchain integration`.
## Python
### Install
Install LangChain, LangGraph, and the LangChain OTel instrumentor:
```bash
pip install langchain langchain-openai langgraph \
opentelemetry-instrumentation-langchain \
opentelemetry-exporter-otlp-proto-http \
opentelemetry-sdk
```
### Instrument
Initialize OpenTelemetry and activate the LangChain instrumentor. It auto-instruments chains, LLM calls, tools, and retrievers:
```python
from langchain.agents import create_agent
from langchain_openai import ChatOpenAI
from opentelemetry.exporter.otlp.proto.http.trace_exporter import OTLPSpanExporter
from opentelemetry.instrumentation.langchain import LangchainInstrumentor
from opentelemetry.sdk.resources import Resource
from opentelemetry.sdk.trace import TracerProvider
from opentelemetry.sdk.trace.export import BatchSpanProcessor
from opentelemetry.trace import set_tracer_provider
def setup_opentelemetry():
resource = Resource.create({"service.name": "my-llm-app"})
tracer_provider = TracerProvider(resource=resource)
tracer_provider.add_span_processor(
BatchSpanProcessor(OTLPSpanExporter())
)
set_tracer_provider(tracer_provider)
setup_opentelemetry()
# Auto-instruments LangChain chains, LLM calls, tools,
# and retrievers. No manual spans required.
LangchainInstrumentor().instrument()
agent = create_agent(ChatOpenAI(model="gpt-4o-mini"), tools=[])
```
### Environment
Point the application at Oodle:
```bash
# OTLP endpoint (points straight at Oodle)
export OTEL_EXPORTER_OTLP_ENDPOINT=https://
export OTEL_EXPORTER_OTLP_HEADERS="X-API-KEY=,X-OODLE-INSTANCE="
# Compress the export: prompt payloads are large
export OTEL_EXPORTER_OTLP_COMPRESSION=gzip
# Optional: disable prompt/response capture
# export TRACELOOP_TRACE_CONTENT=false
```
## TypeScript / JavaScript
### Install
Install LangChain, LangGraph, and the LangChain OTel instrumentor:
```bash
npm install @traceloop/instrumentation-langchain \
@opentelemetry/api \
@opentelemetry/instrumentation \
@opentelemetry/exporter-trace-otlp-proto \
@opentelemetry/resources \
@opentelemetry/sdk-trace-base \
@opentelemetry/sdk-trace-node \
@opentelemetry/semantic-conventions \
langchain @langchain/openai @langchain/core zod
```
### Instrument
Initialize OpenTelemetry and activate the LangChain instrumentor. It auto-instruments chains, LLM calls, tools, and retrievers:
```typescript
// instrumentation.js
const { LangChainInstrumentation } = require('@traceloop/instrumentation-langchain');
const { registerInstrumentations } = require('@opentelemetry/instrumentation');
const { OTLPTraceExporter } = require('@opentelemetry/exporter-trace-otlp-proto');
const { resourceFromAttributes } = require('@opentelemetry/resources');
const { BatchSpanProcessor } = require('@opentelemetry/sdk-trace-base');
const { NodeTracerProvider } = require('@opentelemetry/sdk-trace-node');
const { ATTR_SERVICE_NAME } = require('@opentelemetry/semantic-conventions');
const provider = new NodeTracerProvider({
resource: resourceFromAttributes({ [ATTR_SERVICE_NAME]: 'my-llm-app' }),
spanProcessors: [new BatchSpanProcessor(new OTLPTraceExporter())],
});
provider.register();
// Auto-instruments chains, LLM calls, tools, and retrievers.
registerInstrumentations({ instrumentations: [new LangChainInstrumentation()] });
process.on('beforeExit', () => provider.shutdown());
// app.js
const { trace } = require('@opentelemetry/api');
const { createAgent } = require('langchain');
const { tool } = require('@langchain/core/tools');
const { z } = require('zod');
const tracer = trace.getTracer('my-llm-app');
const getWeather = tool(async ({ city }) => `Sunny in ${city}`, {
name: 'get_weather',
description: 'Return the weather for a city.',
schema: z.object({ city: z.string() }),
});
const agent = createAgent({ model: 'openai:gpt-4o-mini', tools: [getWeather] });
async function main() {
// The LangChain spans join the span that is active when they
// start. Open one per run so the model calls and tool calls
// arrive as one trace; under an instrumented HTTP server the
// request span already does this.
const result = await tracer.startActiveSpan(
'invoke_agent weather-agent',
{
attributes: {
'gen_ai.operation.name': 'invoke_agent',
'gen_ai.agent.name': 'weather-agent',
},
},
async (span) => {
try {
return await agent.invoke({
messages: [{ role: 'user', content: 'What is the weather in Paris?' }],
});
} finally {
span.end();
}
}
);
console.log(result.messages.at(-1).content);
}
main();
```
### Environment
Point the application at Oodle:
```bash
# OTLP endpoint (points straight at Oodle)
export OTEL_EXPORTER_OTLP_ENDPOINT=https://
export OTEL_EXPORTER_OTLP_HEADERS="X-API-KEY=,X-OODLE-INSTANCE="
# Compress the export: prompt payloads are large
export OTEL_EXPORTER_OTLP_COMPRESSION=gzip
# Load the instrumentation before your app, so LangChain is
# patched as it loads.
node --require ./instrumentation.js app.js
```
## Verify
Run your application, then open . Spans
carry `gen_ai.*` attributes: the model, token counts, and the prompt and
response content. Click a trace for the Transcript, the waterfall, and
the cost breakdown.
If nothing arrives, check that the exporter can reach
`https://` and that the instance and key are set: the
OTLP gateway answers `401` without them.
---
## Langfuse
The Langfuse SDK writes its spans into your application tracer provider, which exports to Oodle over OTLP.
You will need:
- `OODLE_INSTANCE`: your Oodle instance ID ()
- `OODLE_API_KEY`: an Oodle API key ()
- `OTLP_ENDPOINT`: your OTLP collector domain, shown on the tile
Open the **Langfuse** tile on the page to
get these filled in for you, or let an agent do the setup with
`/oodle-onboarding set up the llm_observability_langfuse integration`.
## Python
### Install
Install the Langfuse SDK alongside your LLM provider SDK:
```bash
pip install langfuse openai \
opentelemetry-exporter-otlp-proto-http \
opentelemetry-sdk
```
### Instrument
Import your LLM SDK through the Langfuse drop-in. Every call it makes is traced, and the observe wrapper groups related calls into one trace:
```python
from opentelemetry.exporter.otlp.proto.http.trace_exporter import OTLPSpanExporter
from opentelemetry.sdk.resources import Resource
from opentelemetry.sdk.trace import TracerProvider
from opentelemetry.sdk.trace.export import BatchSpanProcessor
from opentelemetry.trace import set_tracer_provider
from langfuse import Langfuse, get_client, observe
def setup_opentelemetry():
resource = Resource.create({"service.name": "my-llm-app"})
tracer_provider = TracerProvider(resource=resource)
tracer_provider.add_span_processor(
BatchSpanProcessor(OTLPSpanExporter())
)
set_tracer_provider(tracer_provider)
return tracer_provider
# Langfuse writes into the app tracer provider instead of
# owning one. Giving it its own exporter as well would send
# every Langfuse span twice.
Langfuse(
tracer_provider=setup_opentelemetry(),
# Langfuse adds its own processor even when it is
# handed a provider. The app provider already
# exports to Oodle, so refuse its export rather
# than sending every span to Langfuse too.
should_export_span=lambda span: False,
)
# The Langfuse OpenAI drop-in traces every call it makes.
# Import it after Langfuse() so it uses that client.
from langfuse.openai import openai
# Optional: group the LLM calls of one request under a
# single trace.
@observe()
def chat(message: str) -> str:
response = openai.chat.completions.create(
model="gpt-4o-mini",
messages=[{"role": "user", "content": message}],
)
return response.choices[0].message.content
chat("Hello!")
# Short-lived processes must flush before they exit.
get_client().flush()
```
### Environment
Point the application at Oodle:
```bash
# OTLP endpoint (points straight at Oodle)
export OTEL_EXPORTER_OTLP_ENDPOINT=https://
export OTEL_EXPORTER_OTLP_HEADERS="X-API-KEY=,X-OODLE-INSTANCE="
# Compress the export: prompt payloads are large
export OTEL_EXPORTER_OTLP_COMPRESSION=gzip
# Required even though the OTel exporter owns transport:
# without them the Langfuse client disables itself.
export LANGFUSE_PUBLIC_KEY="default"
export LANGFUSE_SECRET_KEY="unused"
```
## TypeScript / JavaScript
### Install
Install the Langfuse SDK alongside your LLM provider SDK:
```bash
npm install @langfuse/tracing @langfuse/openai \
@opentelemetry/exporter-trace-otlp-proto \
@opentelemetry/sdk-trace-base @opentelemetry/sdk-trace-node \
@opentelemetry/resources @opentelemetry/semantic-conventions openai
```
### Instrument
Import your LLM SDK through the Langfuse drop-in. Every call it makes is traced, and the observe wrapper groups related calls into one trace:
```typescript
// instrumentation.ts
// NodeTracerProvider does not read OTEL_SERVICE_NAME, so name
// the service here or every trace lands under
// unknown_service:node.
export const provider = new NodeTracerProvider({
resource: resourceFromAttributes({ [ATTR_SERVICE_NAME]: 'my-llm-app' }),
spanProcessors: [new BatchSpanProcessor(new OTLPTraceExporter())],
});
provider.register();
// Langfuse writes into this provider instead of owning one.
// Adding LangfuseSpanProcessor as well would send every
// Langfuse span twice.
setLangfuseTracerProvider(provider);
// index.ts - import the instrumentation first.
const openai = observeOpenAI(new OpenAI());
const chat = observe(
async (message: string) => {
const response = await openai.chat.completions.create({
model: 'gpt-4o-mini',
messages: [{ role: 'user', content: message }],
});
return response.choices[0].message.content;
},
{ name: 'chat' },
);
async function main() {
await chat('Hello!');
// Short-lived processes must flush before they exit.
await provider.forceFlush();
}
main();
```
### Environment
Point the application at Oodle:
```bash
# OTLP endpoint (points straight at Oodle)
export OTEL_EXPORTER_OTLP_ENDPOINT=https://
export OTEL_EXPORTER_OTLP_HEADERS="X-API-KEY=,X-OODLE-INSTANCE="
# Compress the export: prompt payloads are large
export OTEL_EXPORTER_OTLP_COMPRESSION=gzip
# Required even though the OTel exporter owns transport:
# without them the Langfuse client disables itself.
export LANGFUSE_PUBLIC_KEY="default"
export LANGFUSE_SECRET_KEY="unused"
```
## Native Langfuse export
Oodle serves the Langfuse ingest API, so the Langfuse SDK can keep its
own exporter and be pointed at Oodle with no OpenTelemetry SDK in the
app and no collector. An app already on Langfuse moves by changing its
environment variables and nothing in code. Only the spans the SDK
writes are sent; spans from other instrumentation in the app (HTTP,
database, queue) need the OpenTelemetry setup above.
You will also need `API_DOMAIN`, the Oodle API domain shown on the
tile (for example `us1.oodle.ai`).
### Python
#### Install
Install the Langfuse SDK alongside your LLM provider SDK:
```bash
pip install langfuse openai
```
#### Instrument
Instrument the application as the Langfuse docs show. Nothing in the code names Oodle; the environment variables in the next step point the SDK at it:
```python
# The client reads LANGFUSE_BASE_URL, LANGFUSE_PUBLIC_KEY
# and LANGFUSE_SECRET_KEY from the environment.
from langfuse import get_client, observe
# The Langfuse OpenAI drop-in traces every call it makes.
from langfuse.openai import openai
# Optional: group the LLM calls of one request under a
# single trace.
@observe()
def chat(message: str) -> str:
response = openai.chat.completions.create(
model="gpt-4o-mini",
messages=[{"role": "user", "content": message}],
)
return response.choices[0].message.content
chat("Hello!")
# Short-lived processes must flush before they exit.
get_client().flush()
```
#### Environment
Point the Langfuse SDK at Oodle:
```bash
# The Langfuse SDK exports to this URL with its own exporter.
export LANGFUSE_BASE_URL="https:///v1/api/instance//langfuse"
export LANGFUSE_PUBLIC_KEY="default"
export LANGFUSE_SECRET_KEY=""
# Optional: the service name and environment the traces carry.
export OTEL_SERVICE_NAME="my-llm-app"
export LANGFUSE_TRACING_ENVIRONMENT="production"
```
### TypeScript / JavaScript
#### Install
Install the Langfuse SDK alongside your LLM provider SDK:
```bash
npm install @langfuse/tracing @langfuse/otel @langfuse/openai \
@opentelemetry/sdk-node openai
```
#### Instrument
Instrument the application as the Langfuse docs show. Nothing in the code names Oodle; the environment variables in the next step point the SDK at it:
```typescript
// instrumentation.ts
// The processor reads LANGFUSE_BASE_URL, LANGFUSE_PUBLIC_KEY
// and LANGFUSE_SECRET_KEY from the environment.
export const sdk = new NodeSDK({
spanProcessors: [new LangfuseSpanProcessor()],
});
sdk.start();
// index.ts - import the instrumentation first.
const openai = observeOpenAI(new OpenAI());
const chat = observe(
async (message: string) => {
const response = await openai.chat.completions.create({
model: 'gpt-4o-mini',
messages: [{ role: 'user', content: message }],
});
return response.choices[0].message.content;
},
{ name: 'chat' },
);
async function main() {
await chat('Hello!');
// Short-lived processes must flush before they exit.
await sdk.shutdown();
}
main();
```
#### Environment
Point the Langfuse SDK at Oodle:
```bash
# The Langfuse SDK exports to this URL with its own exporter.
export LANGFUSE_BASE_URL="https:///v1/api/instance//langfuse"
export LANGFUSE_PUBLIC_KEY="default"
export LANGFUSE_SECRET_KEY=""
# Optional: the service name and environment the traces carry.
export OTEL_SERVICE_NAME="my-llm-app"
export LANGFUSE_TRACING_ENVIRONMENT="production"
```
## Verify
Run your application, then open . Spans
carry `gen_ai.*` attributes: the model, token counts, and the prompt and
response content. Click a trace for the Transcript, the waterfall, and
the cost breakdown.
If nothing arrives, check that the exporter can reach
`https://` and that the instance and key are set: the
OTLP gateway answers `401` without them.
---
## LangGraph
LangGraph runs every node through the LangChain callback system, so the LangChain instrumentation traces the graph run, each node, every model call and every tool call.
You will need:
- `OODLE_INSTANCE`: your Oodle instance ID ()
- `OODLE_API_KEY`: an Oodle API key ()
- `OTLP_ENDPOINT`: your OTLP collector domain, shown on the tile
Open the **LangGraph** tile on the page to
get these filled in for you, or let an agent do the setup with
`/oodle-onboarding set up the llm_observability_langgraph integration`.
## Python
### Install
Install LangGraph with the LangChain OTel instrumentor:
```bash
pip install langgraph langchain-openai \
opentelemetry-instrumentation-langchain \
opentelemetry-exporter-otlp-proto-http \
opentelemetry-sdk
```
### Instrument
Initialize OpenTelemetry and activate the LangChain instrumentor. LangGraph runs every node through the LangChain callback system, so the graph, each node, every model call and every tool call is traced:
```python
from langchain_core.messages import HumanMessage
from langchain_core.tools import tool
from langchain_openai import ChatOpenAI
from langgraph.graph import START, MessagesState, StateGraph
from langgraph.prebuilt import ToolNode, tools_condition
from opentelemetry.exporter.otlp.proto.http.trace_exporter import OTLPSpanExporter
from opentelemetry.instrumentation.langchain import LangchainInstrumentor
from opentelemetry.sdk.resources import Resource
from opentelemetry.sdk.trace import TracerProvider
from opentelemetry.sdk.trace.export import BatchSpanProcessor
from opentelemetry.trace import set_tracer_provider
def setup_opentelemetry():
resource = Resource.create({"service.name": "my-llm-app"})
tracer_provider = TracerProvider(resource=resource)
tracer_provider.add_span_processor(
BatchSpanProcessor(OTLPSpanExporter())
)
set_tracer_provider(tracer_provider)
setup_opentelemetry()
# LangGraph runs its nodes through the LangChain callback
# system, so this traces the graph, each node, every model
# call and every tool call. No manual spans required.
LangchainInstrumentor().instrument()
@tool
def get_weather(city: str) -> str:
"""Return the weather for a city."""
return f"Sunny in {city}"
llm = ChatOpenAI(model="gpt-4o-mini").bind_tools([get_weather])
def call_model(state: MessagesState):
return {"messages": [llm.invoke(state["messages"])]}
# A ReAct loop: model -> tools while the model asks for them.
graph = StateGraph(MessagesState)
graph.add_node("model", call_model)
graph.add_node("tools", ToolNode([get_weather]))
graph.add_edge(START, "model")
graph.add_conditional_edges("model", tools_condition)
graph.add_edge("tools", "model")
agent = graph.compile()
result = agent.invoke(
{"messages": [HumanMessage("What is the weather in Paris?")]}
)
print(result["messages"][-1].content)
```
### Environment
Point the application at Oodle:
```bash
# OTLP endpoint (points straight at Oodle)
export OTEL_EXPORTER_OTLP_ENDPOINT=https://
export OTEL_EXPORTER_OTLP_HEADERS="X-API-KEY=,X-OODLE-INSTANCE="
# Compress the export: prompt payloads are large
export OTEL_EXPORTER_OTLP_COMPRESSION=gzip
# Optional: disable prompt/response capture
# export TRACELOOP_TRACE_CONTENT=false
```
## TypeScript / JavaScript
### Install
Install LangGraph with the LangChain OTel instrumentor:
```bash
npm install @traceloop/instrumentation-langchain \
@opentelemetry/api \
@opentelemetry/instrumentation \
@opentelemetry/exporter-trace-otlp-proto \
@opentelemetry/resources \
@opentelemetry/sdk-trace-base \
@opentelemetry/sdk-trace-node \
@opentelemetry/semantic-conventions \
@langchain/langgraph @langchain/openai @langchain/core zod
```
### Instrument
Initialize OpenTelemetry and activate the LangChain instrumentor. LangGraph runs every node through the LangChain callback system, so the graph, each node, every model call and every tool call is traced:
```typescript
// instrumentation.js
const { LangChainInstrumentation } = require('@traceloop/instrumentation-langchain');
const { registerInstrumentations } = require('@opentelemetry/instrumentation');
const { OTLPTraceExporter } = require('@opentelemetry/exporter-trace-otlp-proto');
const { resourceFromAttributes } = require('@opentelemetry/resources');
const { BatchSpanProcessor } = require('@opentelemetry/sdk-trace-base');
const { NodeTracerProvider } = require('@opentelemetry/sdk-trace-node');
const { ATTR_SERVICE_NAME } = require('@opentelemetry/semantic-conventions');
const provider = new NodeTracerProvider({
resource: resourceFromAttributes({ [ATTR_SERVICE_NAME]: 'my-llm-app' }),
spanProcessors: [new BatchSpanProcessor(new OTLPTraceExporter())],
});
provider.register();
// LangGraph runs its nodes through the LangChain callback
// manager, so this traces each node, every model call and
// every tool call.
registerInstrumentations({ instrumentations: [new LangChainInstrumentation()] });
process.on('beforeExit', () => provider.shutdown());
// app.js
const { trace } = require('@opentelemetry/api');
const { HumanMessage } = require('@langchain/core/messages');
const { tool } = require('@langchain/core/tools');
const { StateGraph, MessagesAnnotation, START } = require('@langchain/langgraph');
const { ToolNode, toolsCondition } = require('@langchain/langgraph/prebuilt');
const { ChatOpenAI } = require('@langchain/openai');
const { z } = require('zod');
const tracer = trace.getTracer('my-llm-app');
const getWeather = tool(async ({ city }) => `Sunny in ${city}`, {
name: 'get_weather',
description: 'Return the weather for a city.',
schema: z.object({ city: z.string() }),
});
const llm = new ChatOpenAI({ model: 'gpt-4o-mini' }).bindTools([getWeather]);
// A ReAct loop: model -> tools while the model asks for them.
const agent = new StateGraph(MessagesAnnotation)
.addNode('model', async (state) => ({
messages: [await llm.invoke(state.messages)],
}))
.addNode('tools', new ToolNode([getWeather]))
.addEdge(START, 'model')
.addConditionalEdges('model', toolsCondition)
.addEdge('tools', 'model')
.compile();
async function main() {
// The LangChain spans join the span that is active when they
// start. Open one per run so the nodes, model calls and tool
// calls arrive as one trace; under an instrumented HTTP server
// the request span already does this.
const result = await tracer.startActiveSpan(
'invoke_agent weather-agent',
{
attributes: {
'gen_ai.operation.name': 'invoke_agent',
'gen_ai.agent.name': 'weather-agent',
},
},
async (span) => {
try {
return await agent.invoke({
messages: [new HumanMessage('What is the weather in Paris?')],
});
} finally {
span.end();
}
}
);
console.log(result.messages.at(-1).content);
}
main();
```
### Environment
Point the application at Oodle:
```bash
# OTLP endpoint (points straight at Oodle)
export OTEL_EXPORTER_OTLP_ENDPOINT=https://
export OTEL_EXPORTER_OTLP_HEADERS="X-API-KEY=,X-OODLE-INSTANCE="
# Compress the export: prompt payloads are large
export OTEL_EXPORTER_OTLP_COMPRESSION=gzip
# Load the instrumentation before your app, so LangChain is
# patched as it loads.
node --require ./instrumentation.js app.js
```
## Verify
Run your application, then open . Spans
carry `gen_ai.*` attributes: the model, token counts, and the prompt and
response content. Click a trace for the Transcript, the waterfall, and
the cost breakdown.
If nothing arrives, check that the exporter can reach
`https://` and that the instance and key are set: the
OTLP gateway answers `401` without them.
---
## LiteLLM
LiteLLM emits GenAI spans for every model call it routes, from the SDK or the Proxy, across all its providers.
You will need:
- `OODLE_INSTANCE`: your Oodle instance ID ()
- `OODLE_API_KEY`: an Oodle API key ()
- `OTLP_ENDPOINT`: your OTLP collector domain, shown on the tile
Open the **LiteLLM** tile on the page to
get these filled in for you, or let an agent do the setup with
`/oodle-onboarding set up the llm_observability_litellm integration`.
### Install
Install LiteLLM with the OpenTelemetry SDK and the OTLP exporter:
```bash
pip install litellm \
opentelemetry-exporter-otlp-proto-http \
opentelemetry-sdk
```
### Instrument
Turn on the OTel callback. LiteLLM then traces every call it routes, whichever provider serves it:
```python
# LiteLLM builds its own tracer provider from the
# OTEL_EXPORTER_OTLP_* variables below, so there is no SDK
# setup to write here.
litellm.callbacks = ["otel"]
response = litellm.completion(
model="gpt-4o-mini",
messages=[{"role": "user", "content": "Hello!"}],
)
# LiteLLM Proxy takes the same callback in config.yaml:
# litellm_settings:
# callbacks: ["otel"]
```
### Environment
Point the application at Oodle:
```bash
# OTLP endpoint (points straight at Oodle)
export OTEL_EXPORTER_OTLP_ENDPOINT=https://
export OTEL_EXPORTER_OTLP_HEADERS="X-API-KEY=,X-OODLE-INSTANCE="
# Compress the export: prompt payloads are large
export OTEL_EXPORTER_OTLP_COMPRESSION=gzip
# Required. Without it LiteLLM names the span litellm_request
# and writes no gen_ai.operation.name, and Agent Observability
# lists nothing.
export OTEL_SEMCONV_STABILITY_OPT_IN=gen_ai_latest_experimental
# Capture prompt/response content. `true` here means events
# only, which leaves the span attributes empty.
export OTEL_INSTRUMENTATION_GENAI_CAPTURE_MESSAGE_CONTENT=span_and_event
# LiteLLM has no code hook for the resource, so the service
# name comes from the environment. It defaults to "litellm".
export OTEL_SERVICE_NAME=my-llm-app
```
## Sessions, users and tool spans
The callback traces the model call and nothing around it. Each call is
its own trace, and a `session_id` or `user_id` passed in `metadata` is
not written to the span. To group calls into sessions and name the
user, open a span of your own around the turn and set `session.id` and
`user.id` on it, or add a span processor that stamps them from a
context variable. Oodle reads either from any span of the trace.
Tool executions are the same: LiteLLM records the calls the model asked
for and the tools it was offered, and the trace shows both on the
generation, but the execution itself is a span only if your code opens
one, with `gen_ai.operation.name=execute_tool` and `gen_ai.tool.name`.
## Verify
Run your application, then open . Spans
carry `gen_ai.*` attributes: the model, token counts, and the prompt and
response content. Click a trace for the Transcript, the waterfall, and
the cost breakdown.
If nothing arrives, check that the exporter can reach
`https://` and that the instance and key are set: the
OTLP gateway answers `401` without them.
---
## LlamaIndex
LlamaIndex's OpenTelemetry package traces every workflow step and tool call; the OpenAI instrumentation puts the prompt, completion and token counts on the model calls.
You will need:
- `OODLE_INSTANCE`: your Oodle instance ID ()
- `OODLE_API_KEY`: an Oodle API key ()
- `OTLP_ENDPOINT`: your OTLP collector domain, shown on the tile
Open the **LlamaIndex** tile on the page to
get these filled in for you, or let an agent do the setup with
`/oodle-onboarding set up the llm_observability_llamaindex integration`.
### Install
Install LlamaIndex with its OpenTelemetry package and the OpenAI OTel instrumentation:
```bash
pip install llama-index-core llama-index-llms-openai \
llama-index-observability-otel \
opentelemetry-instrumentation-openai \
opentelemetry-exporter-otlp-proto-http \
opentelemetry-sdk
```
### Instrument
Register the LlamaIndex OpenTelemetry integration and activate the OpenAI instrumentor. LlamaIndex traces every workflow step and tool call; the OpenAI instrumentor puts the prompt, completion and token counts on the model calls:
```python
from llama_index.core.agent.workflow import FunctionAgent
from llama_index.core.tools import FunctionTool
from llama_index.llms.openai import OpenAI
from llama_index.observability.otel import LlamaIndexOpenTelemetry
from opentelemetry.exporter.otlp.proto.http.trace_exporter import OTLPSpanExporter
from opentelemetry.instrumentation.openai import OpenAIInstrumentor
from opentelemetry.sdk.resources import Resource
# Owns the tracer provider and traces every workflow step,
# tool call and LLM dispatch.
otel = LlamaIndexOpenTelemetry(
service_name_or_resource=Resource.create({"service.name": "my-llm-app"}),
span_exporter=OTLPSpanExporter(),
)
otel.start_registering()
# Puts the prompt, completion and token counts on the model calls.
OpenAIInstrumentor().instrument()
def get_weather(city: str) -> str:
"""Return the weather for a city."""
return f"Sunny in {city}"
agent = FunctionAgent(
name="weather-agent",
tools=[FunctionTool.from_defaults(get_weather)],
llm=OpenAI(model="gpt-4o-mini"),
system_prompt="Use tools when asked about the weather.",
)
async def main():
result = await agent.run("What is the weather in Paris?")
print(str(result))
asyncio.run(main())
```
### Environment
Point the application at Oodle:
```bash
# OTLP endpoint (points straight at Oodle)
export OTEL_EXPORTER_OTLP_ENDPOINT=https://
export OTEL_EXPORTER_OTLP_HEADERS="X-API-KEY=,X-OODLE-INSTANCE="
# Compress the export: prompt payloads are large
export OTEL_EXPORTER_OTLP_COMPRESSION=gzip
```
## Verify
Run your application, then open . Spans
carry `gen_ai.*` attributes: the model, token counts, and the prompt and
response content. Click a trace for the Transcript, the waterfall, and
the cost breakdown.
If nothing arrives, check that the exporter can reach
`https://` and that the instance and key are set: the
OTLP gateway answers `401` without them.
---
## Mastra
Mastra traces every agent run, model call and tool call in GenAI semantic conventions through its OpenTelemetry exporter.
You will need:
- `OODLE_INSTANCE`: your Oodle instance ID ()
- `OODLE_API_KEY`: an Oodle API key ()
- `OTLP_ENDPOINT`: your OTLP collector domain, shown on the tile
Open the **Mastra** tile on the page to
get these filled in for you, or let an agent do the setup with
`/oodle-onboarding set up the llm_observability_mastra integration`.
### Install
Install the Mastra OTel exporter alongside the OTLP transport:
```bash
npm install @mastra/core @mastra/observability @mastra/otel-exporter \
@opentelemetry/exporter-trace-otlp-proto @ai-sdk/openai zod
```
### Instrument
Add the OTel exporter to the Mastra observability config. Mastra then traces every agent run, model call and tool call in GenAI semantic conventions:
```typescript
// src/mastra/index.ts
const getWeather = createTool({
id: 'get_weather',
description: 'Return the weather for a city.',
inputSchema: z.object({ city: z.string() }),
execute: async ({ city }) => `Sunny in ${city}`,
});
const weatherAgent = new Agent({
id: 'weather-agent',
name: 'weather-agent',
instructions: 'Use tools when asked about the weather.',
model: openai('gpt-4o-mini'),
tools: { getWeather },
});
export const mastra = new Mastra({
agents: { weatherAgent },
observability: new Observability({
configs: {
default: {
serviceName: 'my-llm-app',
exporters: [
new OtelExporter({
provider: {
custom: {
endpoint: 'https://',
protocol: 'http/protobuf',
headers: {
'X-API-KEY': '',
'X-OODLE-INSTANCE': '',
},
},
},
}),
],
},
},
}),
});
// Every agent.generate() / agent.stream() call is then traced:
// const result = await mastra.getAgent('weatherAgent').generate(
// 'What is the weather in Paris?',
// );
```
### Environment
Point the application at Oodle:
```bash
# Compress the export: prompt payloads are large
export OTEL_EXPORTER_OTLP_COMPRESSION=gzip
```
## Verify
Run your application, then open . Spans
carry `gen_ai.*` attributes: the model, token counts, and the prompt and
response content. Click a trace for the Transcript, the waterfall, and
the cost breakdown.
If nothing arrives, check that the exporter can reach
`https://` and that the instance and key are set: the
OTLP gateway answers `401` without them.
---
## OpenAI
The OpenTelemetry GenAI instrumentation patches the OpenAI SDK, so every model call is traced with no code change at the call site.
You will need:
- `OODLE_INSTANCE`: your Oodle instance ID ()
- `OODLE_API_KEY`: an Oodle API key ()
- `OTLP_ENDPOINT`: your OTLP collector domain, shown on the tile
Open the **OpenAI** tile on the page to
get these filled in for you, or let an agent do the setup with
`/oodle-onboarding set up the llm_observability_openai integration`.
## Python
### Install
Install the OpenTelemetry GenAI instrumentation:
```bash
pip install opentelemetry-instrumentation-openai-v2 \
opentelemetry-exporter-otlp-proto-http \
opentelemetry-sdk \
httpx \
openai
```
### Instrument
Initialize OpenTelemetry and activate the GenAI instrumentor. After this, all LLM SDK calls are automatically traced:
```python
from opentelemetry import _logs as otel_logs
from opentelemetry import trace as otel_trace
from opentelemetry.exporter.otlp.proto.http._log_exporter import OTLPLogExporter
from opentelemetry.exporter.otlp.proto.http.trace_exporter import OTLPSpanExporter
from opentelemetry.instrumentation.openai_v2 import OpenAIInstrumentor
from opentelemetry.sdk._logs import LoggerProvider
from opentelemetry.sdk._logs.export import BatchLogRecordProcessor
from opentelemetry.sdk.resources import Resource
from opentelemetry.sdk.trace import TracerProvider
from opentelemetry.sdk.trace.export import BatchSpanProcessor
def setup_opentelemetry():
resource = Resource.create({"service.name": "my-llm-app"})
tracer_provider = TracerProvider(resource=resource)
tracer_provider.add_span_processor(BatchSpanProcessor(OTLPSpanExporter()))
otel_trace.set_tracer_provider(tracer_provider)
logger_provider = LoggerProvider(resource=resource)
logger_provider.add_log_record_processor(
BatchLogRecordProcessor(OTLPLogExporter())
)
otel_logs.set_logger_provider(logger_provider)
setup_opentelemetry()
OpenAIInstrumentor().instrument()
```
### Environment
Point the application at Oodle:
```bash
# OTLP endpoint (points straight at Oodle)
export OTEL_EXPORTER_OTLP_ENDPOINT=https://
export OTEL_EXPORTER_OTLP_HEADERS="X-API-KEY=,X-OODLE-INSTANCE="
# Compress the export: prompt payloads are large
export OTEL_EXPORTER_OTLP_COMPRESSION=gzip
# Enable GenAI semantic conventions
export OTEL_SEMCONV_STABILITY_OPT_IN=gen_ai_latest_experimental
# Capture prompt/response content
export OTEL_INSTRUMENTATION_GENAI_CAPTURE_MESSAGE_CONTENT=span_and_event
```
## TypeScript / JavaScript
### Install
Install the OpenTelemetry GenAI instrumentation:
```bash
npm install @opentelemetry/instrumentation-openai \
@opentelemetry/instrumentation \
@opentelemetry/exporter-trace-otlp-proto \
@opentelemetry/exporter-logs-otlp-proto \
@opentelemetry/resources \
@opentelemetry/sdk-trace-base \
@opentelemetry/sdk-trace-node \
@opentelemetry/sdk-logs \
@opentelemetry/semantic-conventions \
"openai@^6"
```
### Instrument
Initialize OpenTelemetry and activate the GenAI instrumentor. After this, all LLM SDK calls are automatically traced:
```typescript
// instrumentation.js
const { OpenAIInstrumentation } = require('@opentelemetry/instrumentation-openai');
const { registerInstrumentations } = require('@opentelemetry/instrumentation');
const { OTLPTraceExporter } = require('@opentelemetry/exporter-trace-otlp-proto');
const { resourceFromAttributes } = require('@opentelemetry/resources');
const { BatchSpanProcessor } = require('@opentelemetry/sdk-trace-base');
const { NodeTracerProvider } = require('@opentelemetry/sdk-trace-node');
const { ATTR_SERVICE_NAME } = require('@opentelemetry/semantic-conventions');
const { OTLPLogExporter } = require('@opentelemetry/exporter-logs-otlp-proto');
const { BatchLogRecordProcessor, LoggerProvider } = require('@opentelemetry/sdk-logs');
const provider = new NodeTracerProvider({
resource: resourceFromAttributes({ [ATTR_SERVICE_NAME]: 'my-llm-app' }),
spanProcessors: [new BatchSpanProcessor(new OTLPTraceExporter())],
});
provider.register();
// The instrumentation writes prompts and responses as log
// records. Registering it without a logger provider yields
// spans that carry no content.
const loggerProvider = new LoggerProvider({
resource: resourceFromAttributes({ [ATTR_SERVICE_NAME]: 'my-llm-app' }),
processors: [
new BatchLogRecordProcessor({ exporter: new OTLPLogExporter() }),
],
});
registerInstrumentations({
instrumentations: [new OpenAIInstrumentation()],
loggerProvider,
});
process.on('beforeExit', async () => {
await provider.shutdown();
await loggerProvider.shutdown();
});
```
### Environment
Point the application at Oodle:
```bash
# OTLP endpoint (points straight at Oodle)
export OTEL_EXPORTER_OTLP_ENDPOINT=https://
export OTEL_EXPORTER_OTLP_HEADERS="X-API-KEY=,X-OODLE-INSTANCE="
# Compress the export: prompt payloads are large
export OTEL_EXPORTER_OTLP_COMPRESSION=gzip
# Capture prompt/response content
export OTEL_INSTRUMENTATION_GENAI_CAPTURE_MESSAGE_CONTENT=true
# Load the instrumentation before your app, so the OpenAI
# SDK is patched as it loads.
node --require ./instrumentation.js app.js
```
## Verify
Run your application, then open . Spans
carry `gen_ai.*` attributes: the model, token counts, and the prompt and
response content. Click a trace for the Transcript, the waterfall, and
the cost breakdown.
If nothing arrives, check that the exporter can reach
`https://` and that the instance and key are set: the
OTLP gateway answers `401` without them.
---
## OpenAI Agents SDK
The OpenAI Agents SDK instrumentation traces every agent run, model call, tool call and handoff.
You will need:
- `OODLE_INSTANCE`: your Oodle instance ID ()
- `OODLE_API_KEY`: an Oodle API key ()
- `OTLP_ENDPOINT`: your OTLP collector domain, shown on the tile
Open the **OpenAI Agents SDK** tile on the page to
get these filled in for you, or let an agent do the setup with
`/oodle-onboarding set up the llm_observability_openai_agents integration`.
### Install
Install the OpenAI Agents SDK OTel instrumentation:
```bash
pip install openai-agents \
opentelemetry-instrumentation-openai-agents \
opentelemetry-exporter-otlp-proto-http \
opentelemetry-sdk
```
### Instrument
Initialize OpenTelemetry and activate the Agents SDK instrumentor. Every agent run, model call, tool call and handoff is then traced:
```python
from agents import Agent, Runner, function_tool
from opentelemetry.exporter.otlp.proto.http.trace_exporter import OTLPSpanExporter
from opentelemetry.instrumentation.openai_agents import OpenAIAgentsInstrumentor
from opentelemetry.sdk.resources import Resource
from opentelemetry.sdk.trace import TracerProvider
from opentelemetry.sdk.trace.export import BatchSpanProcessor
from opentelemetry.trace import set_tracer_provider
def setup_opentelemetry():
resource = Resource.create({"service.name": "my-llm-app"})
tracer_provider = TracerProvider(resource=resource)
tracer_provider.add_span_processor(
BatchSpanProcessor(OTLPSpanExporter())
)
set_tracer_provider(tracer_provider)
setup_opentelemetry()
# Traces agent runs, model calls, tool calls and handoffs.
OpenAIAgentsInstrumentor().instrument()
@function_tool
def get_weather(city: str) -> str:
"""Return the weather for a city."""
return f"Sunny in {city}"
agent = Agent(
name="weather-agent",
instructions="Use tools when asked about the weather.",
model="gpt-4o-mini",
tools=[get_weather],
)
result = asyncio.run(Runner.run(agent, "What is the weather in Paris?"))
print(result.final_output)
```
### Environment
Point the application at Oodle:
```bash
# OTLP endpoint (points straight at Oodle)
export OTEL_EXPORTER_OTLP_ENDPOINT=https://
export OTEL_EXPORTER_OTLP_HEADERS="X-API-KEY=,X-OODLE-INSTANCE="
# Compress the export: prompt payloads are large
export OTEL_EXPORTER_OTLP_COMPRESSION=gzip
```
## Verify
Run your application, then open . Spans
carry `gen_ai.*` attributes: the model, token counts, and the prompt and
response content. Click a trace for the Transcript, the waterfall, and
the cost breakdown.
If nothing arrives, check that the exporter can reach
`https://` and that the instance and key are set: the
OTLP gateway answers `401` without them.
---
## OpenCode
[OpenCode](https://opencode.ai) is traced through the
[Langfuse OpenCode plugin](https://langfuse.com/integrations/developer-tools/opencode),
pointed at the Langfuse-compatible endpoint Oodle serves. The plugin
rebuilds each turn from OpenCode's own events: one trace per user
message, a generation per model step with tokens and cost, a tool
observation per tool call, and events for retries, compaction and
reasoning. No collector, no code change.
You will need:
- `OODLE_INSTANCE`: your Oodle instance ID ()
- `OODLE_API_KEY`: an Oodle API key ()
- `API_DOMAIN`: your Oodle API domain, shown on the tile
Open the **OpenCode** tile on the page to
get these filled in for you, or let an agent do the setup with
`/oodle-onboarding set up the opencode_observability integration`.
## Enable the plugin
Add to `~/.config/opencode/opencode.json`, or to a project-level
`opencode.json` / `opencode.jsonc`:
```json
{
"$schema": "https://opencode.ai/config.json",
"experimental": {
"openTelemetry": true
},
"plugin": ["@langfuse/opencode-observability-plugin@latest"]
}
```
OpenCode installs the plugin from npm on its next start.
Keep `experimental.openTelemetry` on. It is part of the plugin's setup,
and the plugin warns `[Tracing disabled]` in the OpenCode log without
it.
## Give the plugin the Oodle credentials
Either as environment variables, in the shell that runs `opencode` or
the environment of the OpenCode server:
```bash
export LANGFUSE_BASE_URL="https:///v1/api/instance//langfuse"
export LANGFUSE_PUBLIC_KEY="default"
export LANGFUSE_SECRET_KEY=""
export LANGFUSE_SERVICE_NAME="opencode"
export LANGFUSE_ENVIRONMENT="production"
# Optional: who ran the session, for the Users page
export LANGFUSE_USER_ID="$(git config user.email)"
```
Or as the plugin's config file, `~/.config/opencode/opencode-langfuse.json`:
```json
{
"publicKey": "default",
"secretKey": "",
"baseUrl": "https:///v1/api/instance//langfuse",
"serviceName": "opencode",
"environment": "production",
"userId": "your-user-id"
}
```
Only the public key, the secret key and the base URL are required.
The public key is always `default`; the secret key is your Oodle API
key. Environment variables, when both keys are set, take precedence
over the file.
The service name is where the traces are filed. Without it they land
under `unknown_service:opencode`. The user id is what the Users page
groups on.
## Verify
Restart OpenCode and run a session. Then:
1. lists one trace per user message,
filtered on service `opencode`. Open one: the **Transcript** tab has
the prompt and the reply, and the tree has an `opencode.generation`
per model step with model, tokens and cost, and one span per tool
call named after the tool.
2. **Sessions** groups the turns of one OpenCode session.
3. **Agent Graph** draws the OpenCode agent (`build`, `plan`, or the
custom agent that ran the turn), its model calls and its tools.
## What is sent
The plugin sends prompts, assistant messages, reasoning and tool
inputs and outputs straight to Oodle. There is no collector in the
path to redact them, so do not enable it for sessions whose content
must not leave the machine.
## Why the plugin
OpenCode can also export over `OTEL_EXPORTER_OTLP_ENDPOINT` when
`experimental.openTelemetry` is set. This integration uses the plugin
instead because the plugin traces the conversation: one trace per user
turn, every tool call as a span with its arguments and result, the
session id on every span, the agent that ran the turn, and a flush at
the end of each turn so a one-shot `opencode run` arrives whole.
## Troubleshooting
- **No traces at all**: check the plugin is listed in `opencode.json`
and restart OpenCode. The OpenCode log
(`~/.local/share/opencode/log/`) shows
`OTEL tracing initialized → ` when the plugin is running.
- **`Missing langfuse credentials`** in the log: both
`LANGFUSE_PUBLIC_KEY` and `LANGFUSE_SECRET_KEY` must be set, or the
config file must hold both keys.
- **Traces under `unknown_service:opencode`**: set
`LANGFUSE_SERVICE_NAME`, or `serviceName` in the file.
- **No cost on a model**: OpenCode reports the cost it computes from
its own model list. A custom provider or model it does not price
arrives with no cost, and Oodle then prices it from its model list,
which may not carry it either.
---
## OpenLIT
OpenLIT auto-instruments supported LLM providers, vector databases, MCP tools and GPU metrics from one init call.
You will need:
- `OODLE_INSTANCE`: your Oodle instance ID ()
- `OODLE_API_KEY`: an Oodle API key ()
- `OTLP_ENDPOINT`: your OTLP collector domain, shown on the tile
Open the **OpenLIT** tile on the page to
get these filled in for you, or let an agent do the setup with
`/oodle-onboarding set up the llm_observability_openlit integration`.
## Python
### Install
Install the OpenLIT SDK:
```bash
pip install openlit
```
### Instrument
Initialize OpenLIT in your application. This single call auto-instruments supported LLM providers, vector databases, MCP tools, and GPU metrics:
```python
openlit.init(
service_name="my-llm-app",
otlp_endpoint="https://",
otlp_headers={
"X-API-KEY": "",
"X-OODLE-INSTANCE": "",
},
capture_message_content=True,
)
# Import your LLM SDK after openlit.init so it gets patched.
```
### Environment
Point the application at Oodle:
```bash
# Compress the export: prompt payloads are large
export OTEL_EXPORTER_OTLP_COMPRESSION=gzip
```
## TypeScript / JavaScript
### Install
Install the OpenLIT SDK:
```bash
npm install openlit
```
### Instrument
Initialize OpenLIT in your application. This single call auto-instruments supported LLM providers, vector databases, MCP tools, and GPU metrics:
```typescript
const Openlit = require('openlit').default;
Openlit.init({
applicationName: 'my-llm-app',
otlpEndpoint: 'https://',
otlpHeaders: {
'X-API-KEY': '',
'X-OODLE-INSTANCE': '',
},
captureMessageContent: true,
});
// Require your LLM SDK after Openlit.init: auto-instrumentation
// patches modules as they load, so requiring it first yields no spans.
const OpenAI = require('openai');
```
### Environment
Point the application at Oodle:
```bash
# Compress the export: prompt payloads are large
export OTEL_EXPORTER_OTLP_COMPRESSION=gzip
```
## Verify
Run your application, then open . Spans
carry `gen_ai.*` attributes: the model, token counts, and the prompt and
response content. Click a trace for the Transcript, the waterfall, and
the cost breakdown.
If nothing arrives, check that the exporter can reach
`https://` and that the instance and key are set: the
OTLP gateway answers `401` without them.
---
## Pydantic AI
Pydantic AI emits GenAI spans for agent runs and every model call underneath them.
You will need:
- `OODLE_INSTANCE`: your Oodle instance ID ()
- `OODLE_API_KEY`: an Oodle API key ()
- `OTLP_ENDPOINT`: your OTLP collector domain, shown on the tile
Open the **Pydantic AI** tile on the page to
get these filled in for you, or let an agent do the setup with
`/oodle-onboarding set up the llm_observability_pydantic integration`.
### Install
Install the OpenTelemetry GenAI instrumentation:
```bash
pip install pydantic-ai \
opentelemetry-exporter-otlp-proto-http \
opentelemetry-sdk
```
### Instrument
Initialize OpenTelemetry and activate the GenAI instrumentor. After this, all LLM SDK calls are automatically traced:
```python
from opentelemetry.exporter.otlp.proto.http.trace_exporter import OTLPSpanExporter
from opentelemetry.sdk.resources import Resource
from opentelemetry.sdk.trace import TracerProvider
from opentelemetry.sdk.trace.export import BatchSpanProcessor
from opentelemetry.trace import set_tracer_provider
from pydantic_ai import Agent, InstrumentationSettings
def setup_opentelemetry():
resource = Resource.create({"service.name": "my-llm-app"})
tracer_provider = TracerProvider(resource=resource)
tracer_provider.add_span_processor(
BatchSpanProcessor(OTLPSpanExporter())
)
set_tracer_provider(tracer_provider)
setup_opentelemetry()
# use_aggregated_usage_attribute_names=False emits the standard
# gen_ai.* usage attributes instead of aggregated ones.
Agent.instrument_all(InstrumentationSettings(
use_aggregated_usage_attribute_names=False,
))
```
### Environment
Point the application at Oodle:
```bash
# OTLP endpoint (points straight at Oodle)
export OTEL_EXPORTER_OTLP_ENDPOINT=https://
export OTEL_EXPORTER_OTLP_HEADERS="X-API-KEY=,X-OODLE-INSTANCE="
# Compress the export: prompt payloads are large
export OTEL_EXPORTER_OTLP_COMPRESSION=gzip
```
## Verify
Run your application, then open . Spans
carry `gen_ai.*` attributes: the model, token counts, and the prompt and
response content. Click a trace for the Transcript, the waterfall, and
the cost breakdown.
If nothing arrives, check that the exporter can reach
`https://` and that the instance and key are set: the
OTLP gateway answers `401` without them.
---
## Traceloop
The Traceloop SDK (OpenLLMetry) auto-instruments supported LLM SDKs and groups related calls into named workflows.
You will need:
- `OODLE_INSTANCE`: your Oodle instance ID ()
- `OODLE_API_KEY`: an Oodle API key ()
- `OTLP_ENDPOINT`: your OTLP collector domain, shown on the tile
Open the **Traceloop** tile on the page to
get these filled in for you, or let an agent do the setup with
`/oodle-onboarding set up the llm_observability_traceloop integration`.
## Python
### Install
Install the Traceloop SDK alongside your LLM provider SDK:
```bash
pip install traceloop-sdk \
google-genai
```
### Instrument
Initialize the Traceloop SDK. It auto-instruments your LLM SDK calls, so every request is traced automatically:
```python
from google import genai
from traceloop.sdk import Traceloop
from traceloop.sdk.decorators import workflow
# Auto-instruments supported LLM SDK calls (Gemini, OpenAI,
# Anthropic, LangChain, and more). No manual spans required.
Traceloop.init(app_name="my-llm-app")
client = genai.Client()
# Optional: group related LLM calls under a named workflow span.
@workflow(name="chat")
def chat(message: str) -> str:
response = client.models.generate_content(
model="gemini-flash-latest",
contents=message,
)
return response.text
```
### Environment
Point the application at Oodle:
```bash
# The Traceloop SDK appends /v1/traces to this base URL.
export TRACELOOP_BASE_URL=https://
export TRACELOOP_HEADERS="X-API-KEY=,X-OODLE-INSTANCE=