Monitors
Monitors allow you to define metric queries that trigger alerts based on specific conditions. The system periodically evaluates these queries and generates alerts when the results violate the defined conditions.
Key Components of a Monitor
Alert Name
A descriptive name that identifies the monitor. You can use template variables in the name using Prometheus templates syntax.
Query
A PromQL query that the system evaluates periodically. You can use any valid PromQL query syntax.
Conditions
Conditions specify the threshold values that trigger alerts. There are two severity levels:
CriticalWarning
You must define at least one condition, and you can set different thresholds for each severity level. The following operators are available for conditions:
- Equal to
- Not equal to
- Above
- Above or Equal to
- Below
- Below or Equal to
Message
A customizable message that accompanies alert notifications. You can enhance messages using template variables with Prometheus templates syntax.
For example, with a query like max by (job) (up), you can access the job name in your message using
the template variable {{ $labels.job }}.
Oodle notifications automatically include the following information, so you don't need to add them to your message:
- Alert name
- Severity
- Threshold
- Metric Value (the current value when the alert fires)
- Labels and Annotations
Notification Policy
Notification policies determine where alert notifications are sent. You can configure multiple notifiers as destinations for your alerts.
Each rule specifies which notifiers to trigger and can optionally be scoped by label conditions and severity.
How Routing Rules Work
Notification rules are evaluated top to bottom on a first-match basis. The first rule whose conditions match the alert fires its notifiers; subsequent rules are skipped. The last rule without any label conditions acts as the fallback and catches everything that didn't match an earlier rule.
Rules follow an If / Else If / Else pattern:
| Position | Prefix | Description |
|---|---|---|
| First rule (with conditions) | If | Evaluated first |
| Additional rules (with conditions) | Else If | Evaluated only when preceding rules don't match |
| Last rule (no conditions) | Always / Else | Fallback — matches all remaining alerts |
You can drag and drop rules to reorder them.
Label-Based Routing
Each rule can include one or more label conditions to match alerts. Conditions within a single rule are combined with AND logic. Available operators are:
is— exact matchis not— negated matchmatches regex— regex matchdoes not match regex— negated regex match
Label values are auto-suggested from the monitor's query results, so you can pick from labels that actually appear in your data.
Example — Team-based routing:
Route alerts to the owning team's channel based on a
team label:
| Rule | Condition | Notifier |
|---|---|---|
| If | team is backend | Slack #backend-alerts |
| Else If | team is frontend | Slack #frontend-alerts |
| Else | (none — fallback) | Slack #ops-alerts |
Example — Environment-based routing:
Escalate production alerts to your incident management tool while keeping non-production alerts in Slack:
| Rule | Condition | Notifier |
|---|---|---|
| If | environment is production | OpsGenie |
| Else | (none — fallback) | Slack #dev-alerts |
Example — Combined conditions:
Conditions within a rule are AND'd together, so you can be very specific:
| Rule | Conditions | Notifier |
|---|---|---|
| If | team is payments AND environment is production | PagerDuty |
| Else If | environment is production | OpsGenie |
| Else | (none — fallback) | Slack #alerts |
Severity-Based Routing
Within each rule, you can filter by alert severity using the for dropdown. The options are:
| Option | Matches |
|---|---|
| all | Critical, Warning, and No Data alerts |
| critical | Only Critical alerts |
| warning | Only Warning alerts |
| no data | Only No Data alerts |
When you select a specific severity, you can add
additional severity rows within the same rule to send
different severities to different notifiers. For example,
within a single rule you can send critical alerts to
PagerDuty and warning alerts to Slack.
Notification Policies vs. Direct Notifiers
Each rule supports two action types, selectable via the dropdown next to the rule:
- notify on — Send directly to one or more notifiers (Slack, OpsGenie, PagerDuty, etc.)
- trigger policy — Delegate to a reusable Notification Policy that defines its own routing, grouping, and timing
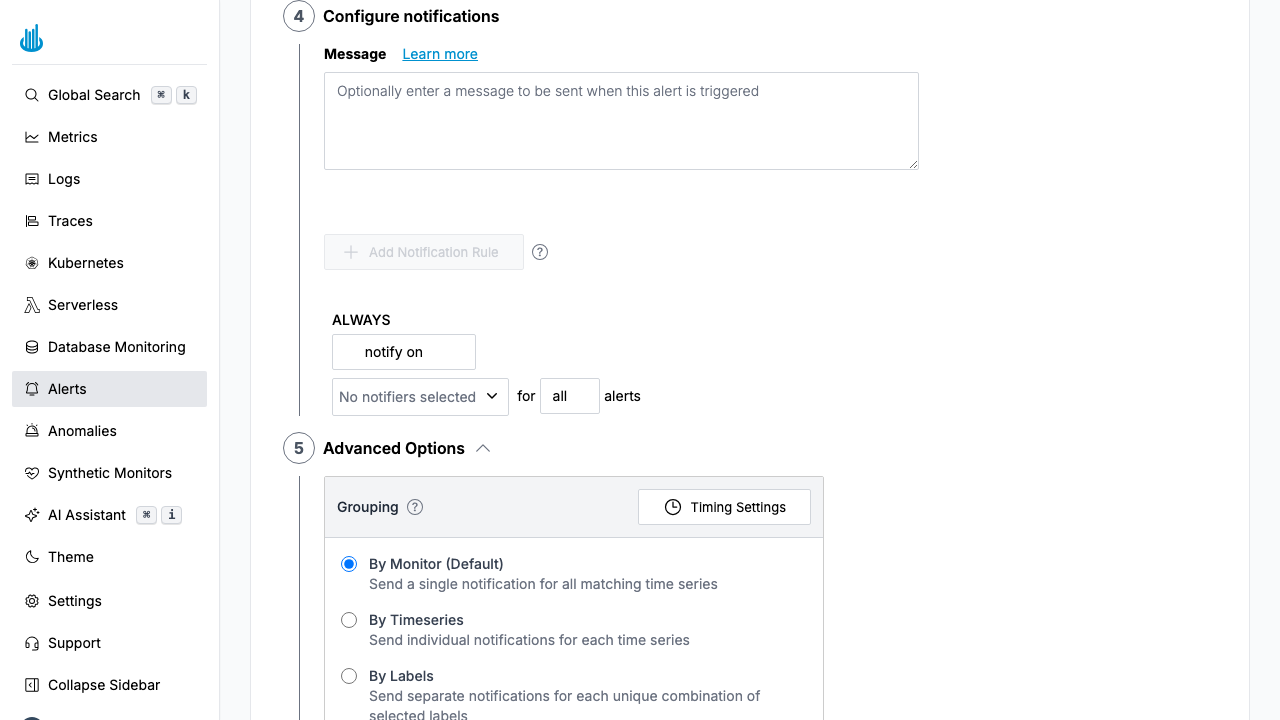
Grouping
Grouping controls how notifications are consolidated. You can choose from three options:
- By Monitor: Receive a single notification per monitor (default behavior)
- By Labels: Receive a notification for each unique set of specified labels
- Disabled: Receive a notification for each individual timeseries
For example, consider a monitor with this query that alerts when the up metric for any job is 0:
max by (job, instance) (up{})
Here's how different grouping options affect notifications:
- By Monitor: You receive one notification that includes all affected jobs and instances
- By Labels (with
jobspecified): You receive one notification per affected job - Disabled: You receive one notification per affected timeseries (job-instance combination)
Notification Timings
These parameters control the timing of grouped notifications:
Group Wait
Group Wait defines how long to wait before sending the first notification for a new group of alerts. The default is 30 seconds.
Group Interval
Group Interval defines how long to wait before sending a notification for new alerts added to a group that has already sent notifications. The default is 5 minutes.
Repeat Interval
The repeat interval specifies how often notifications are resent for active alerts. For example, if you have an active alert
for the timeseries up with job=foo and instance=bar, setting a repeat interval of 10 minutes means the notification
will be sent every 10 minutes until the alert is resolved.
For example, with the up metric monitor grouped "By Monitor", consider a group wait of 30 seconds and a group interval of 5 minutes:
If two jobs go down within the first 30 seconds, you'll receive one notification covering both jobs. If a third job goes down a minute later,
its notification will be delayed by the 5-minute group interval.
Labels
Labels add metadata to alerts. You can use Prometheus templates syntax to create dynamic labels.
A common use case is tagging monitors with owner teams to identify responsible teams for each monitor.
Annotations
Annotations provide additional context for alerts, such as descriptions or runbook links. Like labels, annotations support Prometheus templates syntax.
Creating a Monitor with AI
The quickest way to create a monitor is to ask the AI Assistant. Open the sidebar assistant (Cmd + I) or AI Canvas and describe the alert you need:
Create an alert to notify me when container memory usage is above 90%Alert me when the error rate on api-server exceeds 5%Create an alert for container restarts in the last 10 minutes
The AI will build the PromQL query, set the threshold, and save the monitor. You can review and adjust it from the alerts page afterwards.
Creating a Monitor Manually
- Navigate to Alerts (Bell icon in sidebar)
- Click New Alert
- Configure the following settings:
- Name: Enter a descriptive name for your monitor
- Query: Specify the PromQL query to evaluate
- Conditions: Define the alerting conditions
- Message: (Optional) Add a message for alert notifications
- Notification Policy: (Optional) Select routing rules for alerts
- Grouping: (Optional) Configure how you want to group alerts. Additionally, you can configure various timing parameters by clicking on the Clock icon.
- Labels: (Optional) Add metadata labels to the alerts
- Annotations: (Optional) Include additional contextual information
- Click Save to create the monitor
Support
If you need assistance or have any questions, please reach out to us through:
- Email at [email protected]