Java Zero-Code Instrumentation
Zero-code instrumentation with Java uses a Java agent JAR attached to any Java 8+ application. It dynamically injects bytecode to capture telemetry from many popular libraries and frameworks automatically, without requiring code changes.
Overview
The OpenTelemetry Java agent can capture telemetry data at the "edges" of your application, such as:
- Inbound HTTP requests
- Outbound HTTP calls
- Database calls
- Messaging operations
- And many other popular frameworks and libraries
Prerequisites
- Java 8 or higher
- Your Oodle metrics endpoint and API key
Getting Started
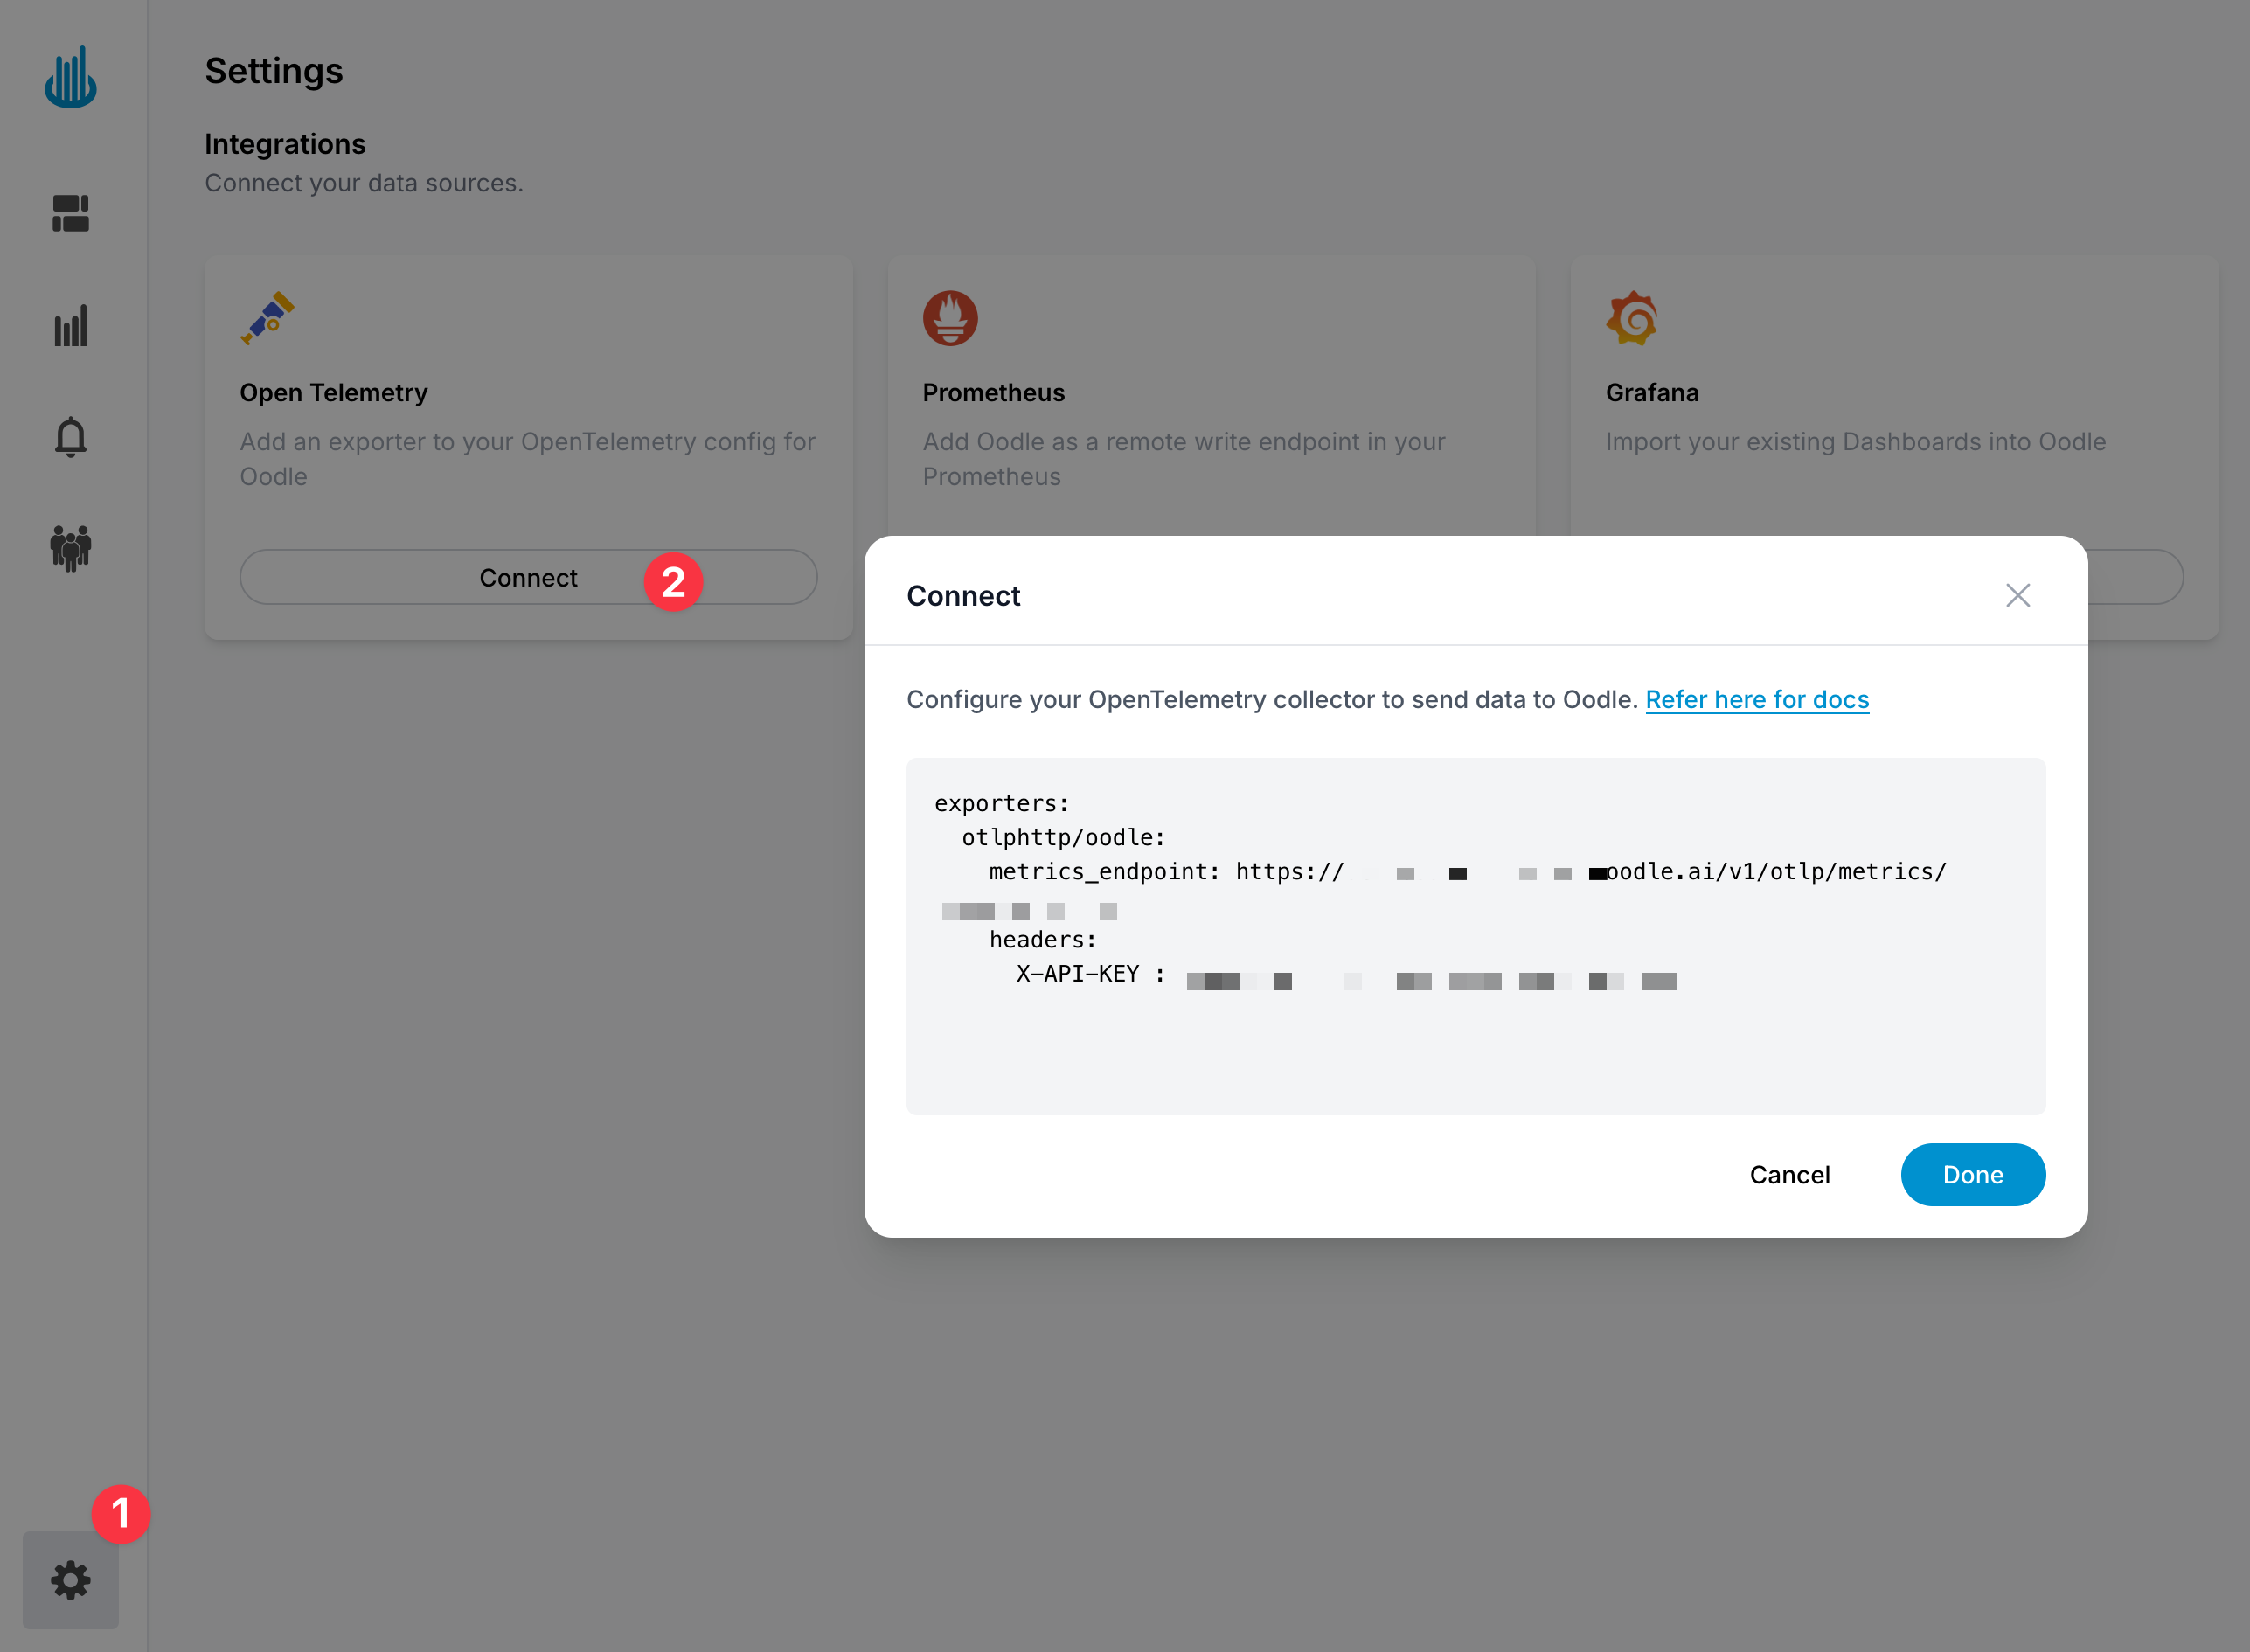
Step 1: Get Your Oodle Configuration
In the Oodle UI, navigate to the Settings page and click on Connect in the Open Telemetry tile and copy the provided configuration snippet which includes your metrics endpoint and API key
Step 2: Download the Java Agent
Download the latest OpenTelemetry Java agent from the official releases:
wget https://github.com/open-telemetry/opentelemetry-java-instrumentation/releases/latest/download/opentelemetry-javaagent.jar
Step 3: Configure Environment Variables
Set the following environment variables for your Java application:
# OpenTelemetry Configuration
export OTEL_SERVICE_NAME=<YOUR_SERVICE_NAME>
export OTEL_EXPORTER_OTLP_ENDPOINT=https://<OTLP_ENDPOINT>
export OTEL_EXPORTER_OTLP_HEADERS=X-API-KEY=<OODLE_API_KEY>,X-OODLE-INSTANCE=<OODLE_INSTANCE>
export OTEL_EXPORTER_OTLP_METRICS_TEMPORALITY_PREFERENCE=delta

# Optional: Service identification
export OTEL_RESOURCE_ATTRIBUTES=service.name=<YOUR_SERVICE_NAME>
Step 4: Run Your Application with the Agent
Add the Java agent to your application startup command:
java -javaagent:opentelemetry-javaagent.jar -jar your-application.jar
Configure using Integration tile
- Login to the Oodle UI, then navigate to Settings page
- Click on the Prometheus tile
- Choose an appropriate API key from the list on top of the drawer
- Click on Setup OpenTelemetry for Java
Follow the steps in the drawer to complete the OpenTelemetry setup for Java
Docker Configuration
If you're running your Java application in Docker, add the agent to your Dockerfile:
# Download the OpenTelemetry Java agent
RUN wget https://github.com/open-telemetry/opentelemetry-java-instrumentation/releases/latest/download/opentelemetry-javaagent.jar

# Set environment variables
ENV OTEL_EXPORTER_OTLP_ENDPOINT=https://<OTLP_ENDPOINT>
ENV OTEL_EXPORTER_OTLP_HEADERS=X-API-KEY=<OODLE_API_KEY>,X-OODLE-INSTANCE=<OODLE_INSTANCE>
ENV OTEL_EXPORTER_OTLP_METRICS_TEMPORALITY_PREFERENCE=delta

# Run your application with the agent
CMD ["java", "-javaagent:opentelemetry-javaagent.jar", "-jar", "your-application.jar"]
Supported Instrumentations
The Java agent automatically instruments many popular libraries and frameworks. For a complete list, see the OpenTelemetry Java Instrumentation documentation.
Configuration Options
Suppressing Specific Instrumentations
You can disable specific instrumentations using environment variables:
export OTEL_INSTRUMENTATION_COMMON_DEFAULT_ENABLED=false
export OTEL_INSTRUMENTATION_HTTP_ENABLED=false
export OTEL_INSTRUMENTATION_JDBC_ENABLED=false
Performance Considerations
For detailed information about the performance impact and overhead of using the OpenTelemetry Java agent, please refer to the official OpenTelemetry Java agent performance documentation.
Troubleshooting
Common Issues
- Agent not loading: Ensure the
-javaagentflag is correctly specified - No metrics appearing: Verify your Oodle endpoint and API key are correct
- Performance issues: Check if you have too many instrumentations enabled
Debug Mode
Enable debug logging to troubleshoot issues (not recommended for production as it generates a large volume of logs):
export OTEL_LOG_LEVEL=DEBUG
Support
If you need assistance or have any questions, please reach out to us through:
- Email at [email protected]