Fluent Bit
Oodle provides a seamless integration with Fluent Bit. By adding Oodle as an output destination in your Fluent Bit configuration, you can start sending logs directly to your Oodle instance.
Configuration
To configure Fluent Bit to send logs to Oodle, you'll need the following values:
OODLE_INSTANCE: Your Oodle instance ID. Go toSettingsicon ->API Keyspage in your Oodle UI to find out. (Oodle UI links: ap1, us1)OODLE_API_KEY: Your Oodle API key for authentication. Go toSettingsicon ->API Keysin your Oodle UI to choose an appropriate key. (Oodle UI links: ap1, us1)OODLE_ENDPOINT: The Oodle endpoint URL for log ingestion
Add the following configuration to your Fluent Bit configuration file:
# If a log line is getting split into multiple log lines, FluentBit can
# concatenate them with the "multiline" filter.
# Note that this needs to be first filter in the pipeline so that all remaining
# filters operate on concatenated log lines.
[FILTER]
    name                  multiline
    match                 *
    multiline.key_content log
    mode                  partial_message

[OUTPUT]
    Name        http
    Match       *
    Host        <OODLE_ENDPOINT>
    Port        443
    URI         /ingest/v1/logs
    Header      X-OODLE-INSTANCE <OODLE_INSTANCE>
    Header      X-API-KEY <OODLE_API_KEY>
    Format      json
    Compress    gzip
    Json_date_key    timestamp
    Json_date_format iso8601
    TLS         On
Setup
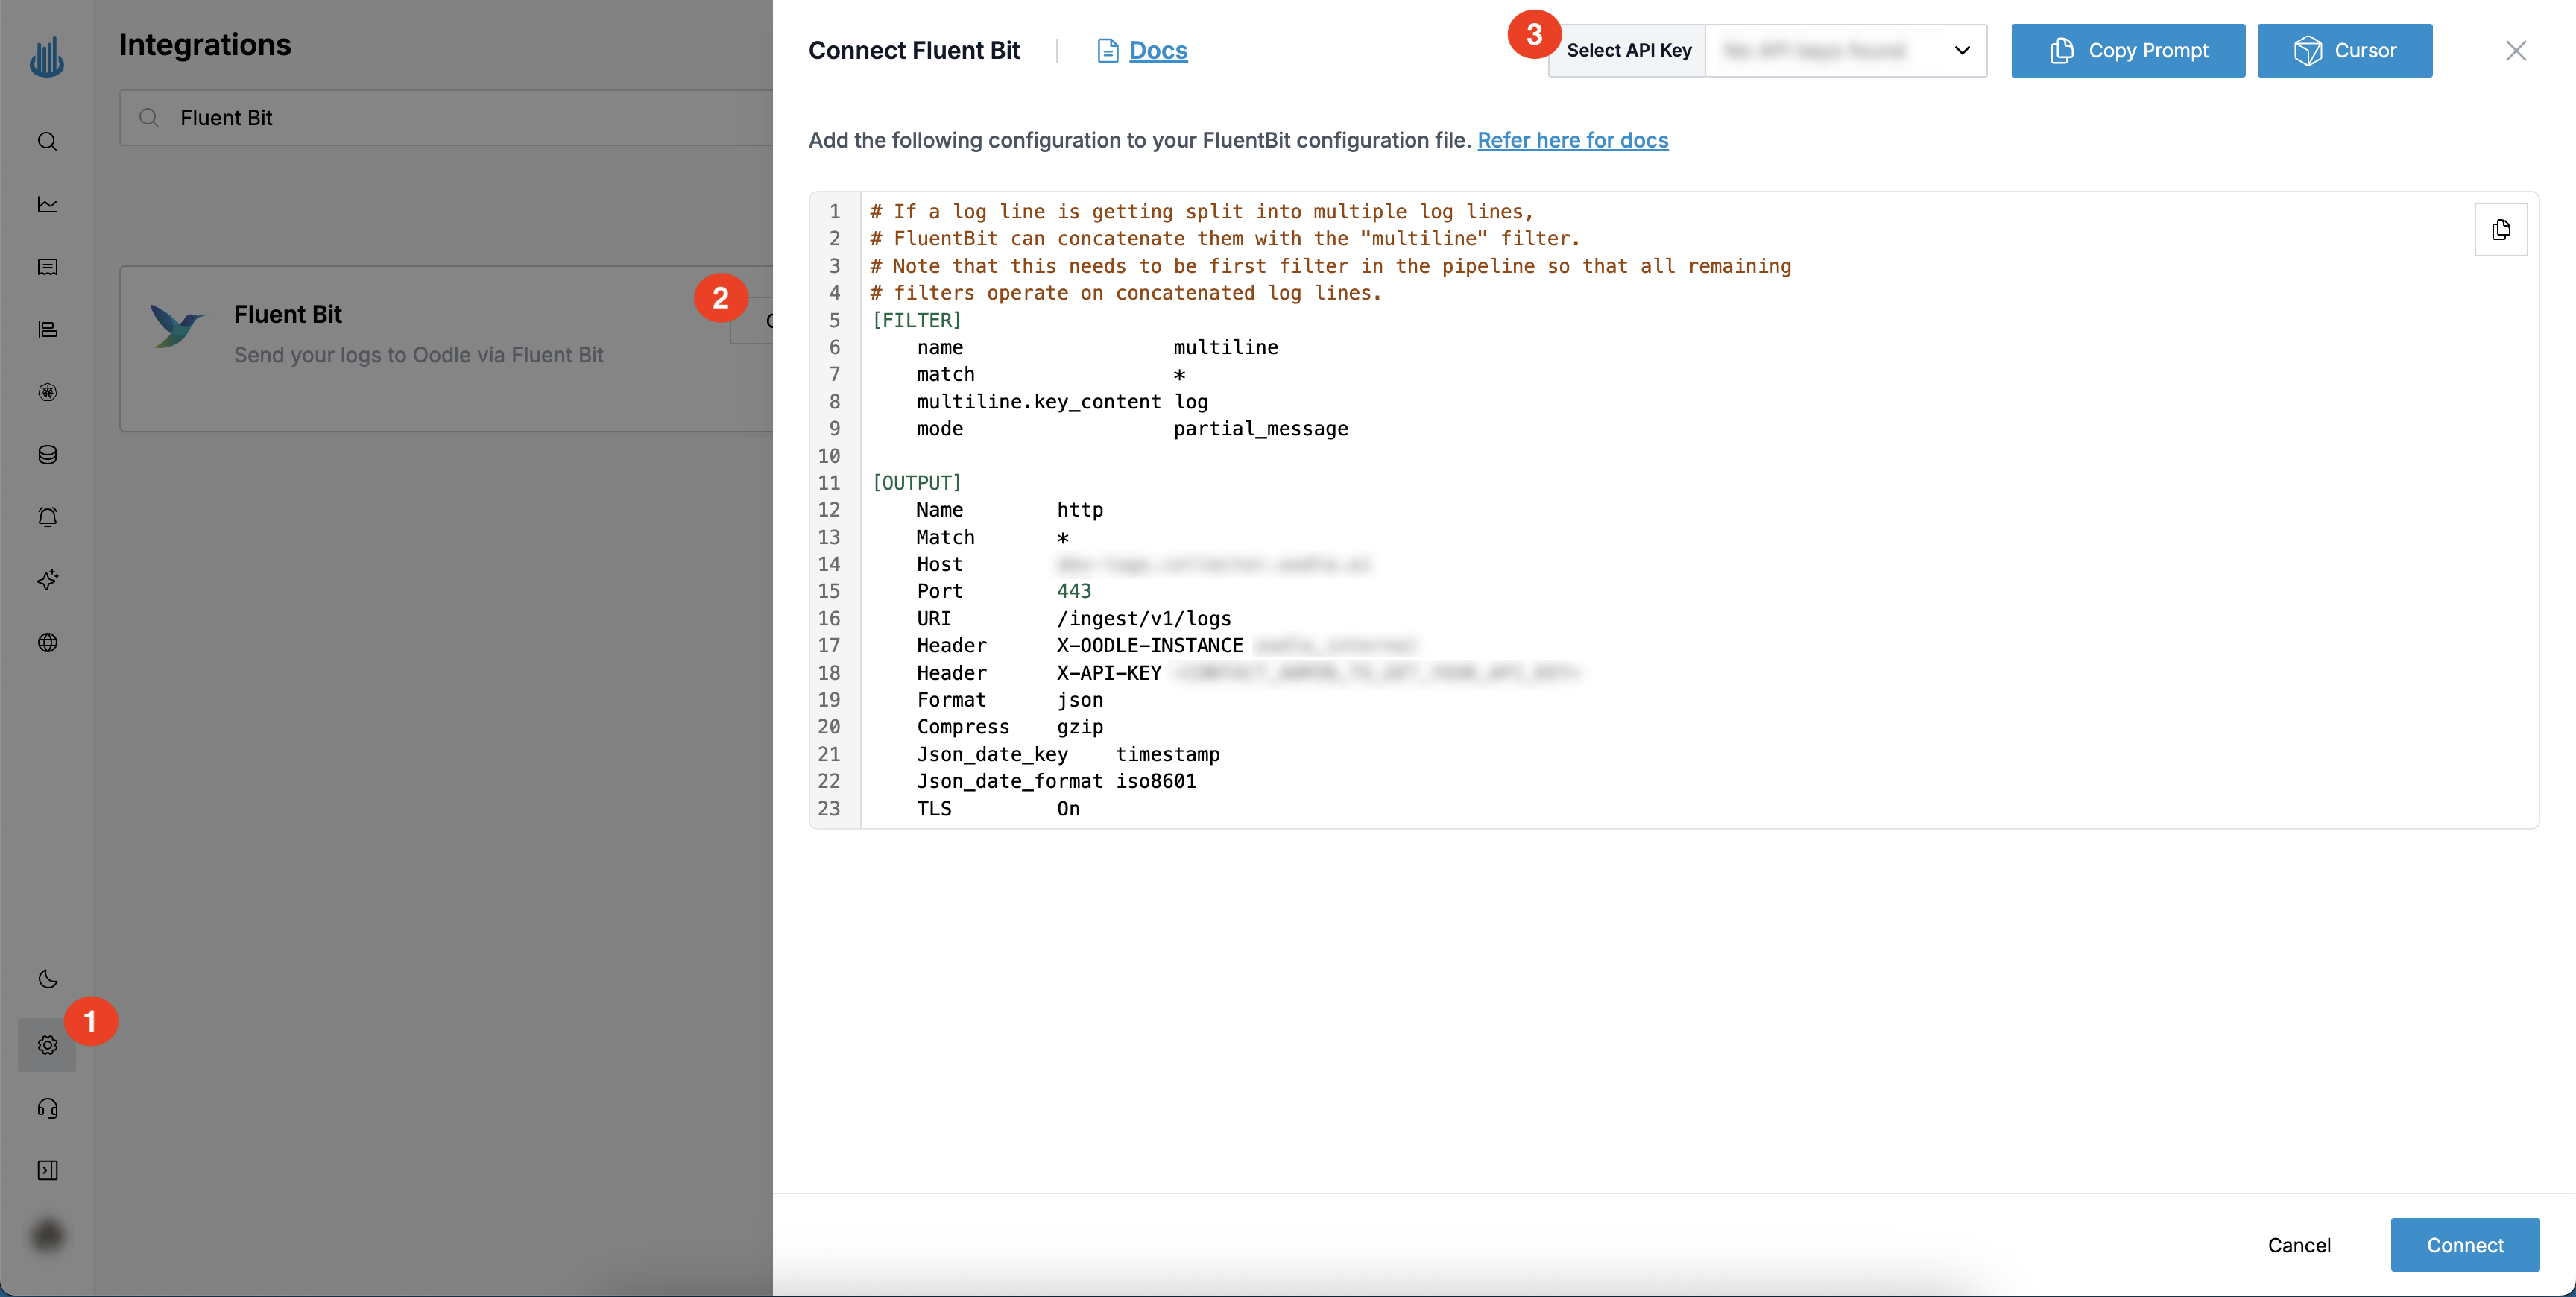
You can find the required Fluent Bit configuration changes by doing the following:
- Login to the Oodle UI, then navigate to the Integrations page
- Click on the Fluent Bit tile
- Choose an appropriate API key from the list on top of the drawer
Add the configuration specified in the drawer to your Fluent Bit configuration file
Collect Fluent Bit internal metrics (optional)
Monitor Fluent Bit itself (records processed, retries, output errors) by
collecting its internal metrics. The fluentbit_metrics input gathers them.
Push them straight to Oodle, or expose a /metrics endpoint for your own
Prometheus scraper to pull. Internal metrics flow through a separate pipeline
from logs, so your log filters do not touch them. See the
Fluent Bit metrics docs.
- Push to Oodle
- Expose for scraping
The prometheus_remote_write output pushes straight to Oodle.
[INPUT]
    Name             fluentbit_metrics
    Tag              internal_metrics
    Scrape_Interval  30

[OUTPUT]
    Name             prometheus_remote_write
    Match            internal_metrics
    Host             <OODLE_INSTANCE>.collector.oodle.ai
    Port             443
    Uri              /v1/prometheus/<OODLE_INSTANCE>/write
    Header           X-API-KEY <OODLE_API_KEY>
    Tls              On
    Tls.verify       On
The prometheus_exporter output serves metrics at
http://<fluent-bit-host>:2021/metrics. Point your Prometheus compatible
scraper there and remote-write to Oodle.
[INPUT]
    Name             fluentbit_metrics
    Tag              internal_metrics
    Scrape_Interval  30

[OUTPUT]
    Name             prometheus_exporter
    Match            internal_metrics
    Host             0.0.0.0
    Port             2021
Support
If you need assistance or have any questions, please reach out to us through:
- Email at [email protected]