AWS Lambda
Oodle's Serverless monitoring gives you visibility into your AWS Lambda functions, including invocation counts, latency, error rates, and cold starts — all in a single unified view.
Getting Started
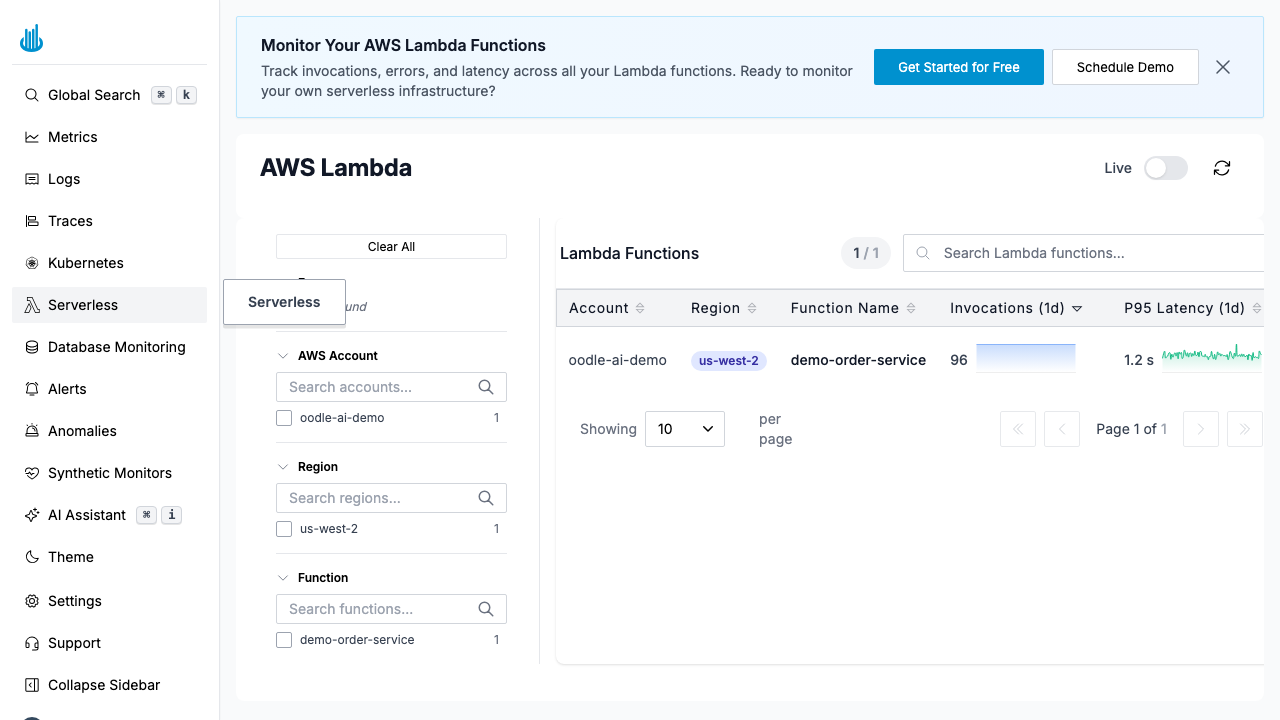
Navigate to Serverless in the sidebar. The page displays a table of all discovered Lambda functions across your connected AWS accounts.
Lambda Functions Table
| Column | Description |
|---|---|
| Account | AWS account name. |
| Region | AWS region, shown as a color-coded badge. |
| Function Name | Lambda function name. |
| Invocations (1d) | Total invocations over the last 24 hours, with a sparkline trend. |
| Errors (1d) | Total errors over the last 24 hours, with a sparkline trend. Values above zero are highlighted in red. |
| P95 Latency (1d) | 95th-percentile execution duration over the last 24 hours, with a sparkline trend. |
Filters
The left-hand filter panel lets you narrow the view:
- Errors — Show only functions that have errors.
- AWS Account — Filter by one or more AWS accounts.
- Region — Filter by one or more AWS regions.
- Function — Filter by specific function names.
Features
- Search — Full-text search across function names, accounts, and regions.
- Sorting — Click any column header to sort ascending or descending.
- Sparklines — Inline trend charts in the Invocations, Errors, and Latency columns show 24-hour trends at a glance.
- Click a row to open a detail drawer with two tabs:
- Metrics — A Grafana dashboard showing invocation timeline, duration distribution, error count, cold start ratio, and more.
- Logs — Recent log events for the selected function, filterable by index pattern.
Use Cases
- Monitor invocation volume — Spot sudden spikes or drops in function usage.
- Track latency — Identify functions with high P95 latency that may need optimization.
- Debug errors — Drill into functions with elevated error rates.
- Cold start analysis — Detect functions with frequent cold starts that impact user experience.
Best Practices
- Connect all accounts — Add all your AWS accounts to get full cross-account visibility.
- Review latency trends — Use the sparkline to spot gradual performance degradation before it becomes critical.
- Set alerts — Create alerts on Lambda metrics (invocation errors, duration) to get notified proactively.
Related Pages
- Kubernetes — Monitor Kubernetes clusters, workloads, and pods.
- Database Monitoring — Monitor database query performance and host health.
Support
If you need assistance or have any questions, please reach out to us through:
- Email at [email protected]