Python Zero-Code Instrumentation
Zero-code instrumentation for Python uses the
opentelemetry-instrument CLI wrapper to automatically
capture telemetry from popular libraries and frameworks
— without modifying your application code.
Overview
The OpenTelemetry Python zero-code instrumentation can automatically capture telemetry at the "edges" of your application, such as:
- Inbound HTTP requests (Django, Flask, FastAPI)
- Outbound HTTP calls (urllib3, requests, httpx)
- Database calls (psycopg, SQLAlchemy, pymysql)
- Messaging operations (Celery, Kafka, RabbitMQ)
- Logging (standard library
loggingmodule)
Prerequisites
- Python 3.8 or higher
pippackage manager- Your Oodle metrics endpoint and API key
Getting Started
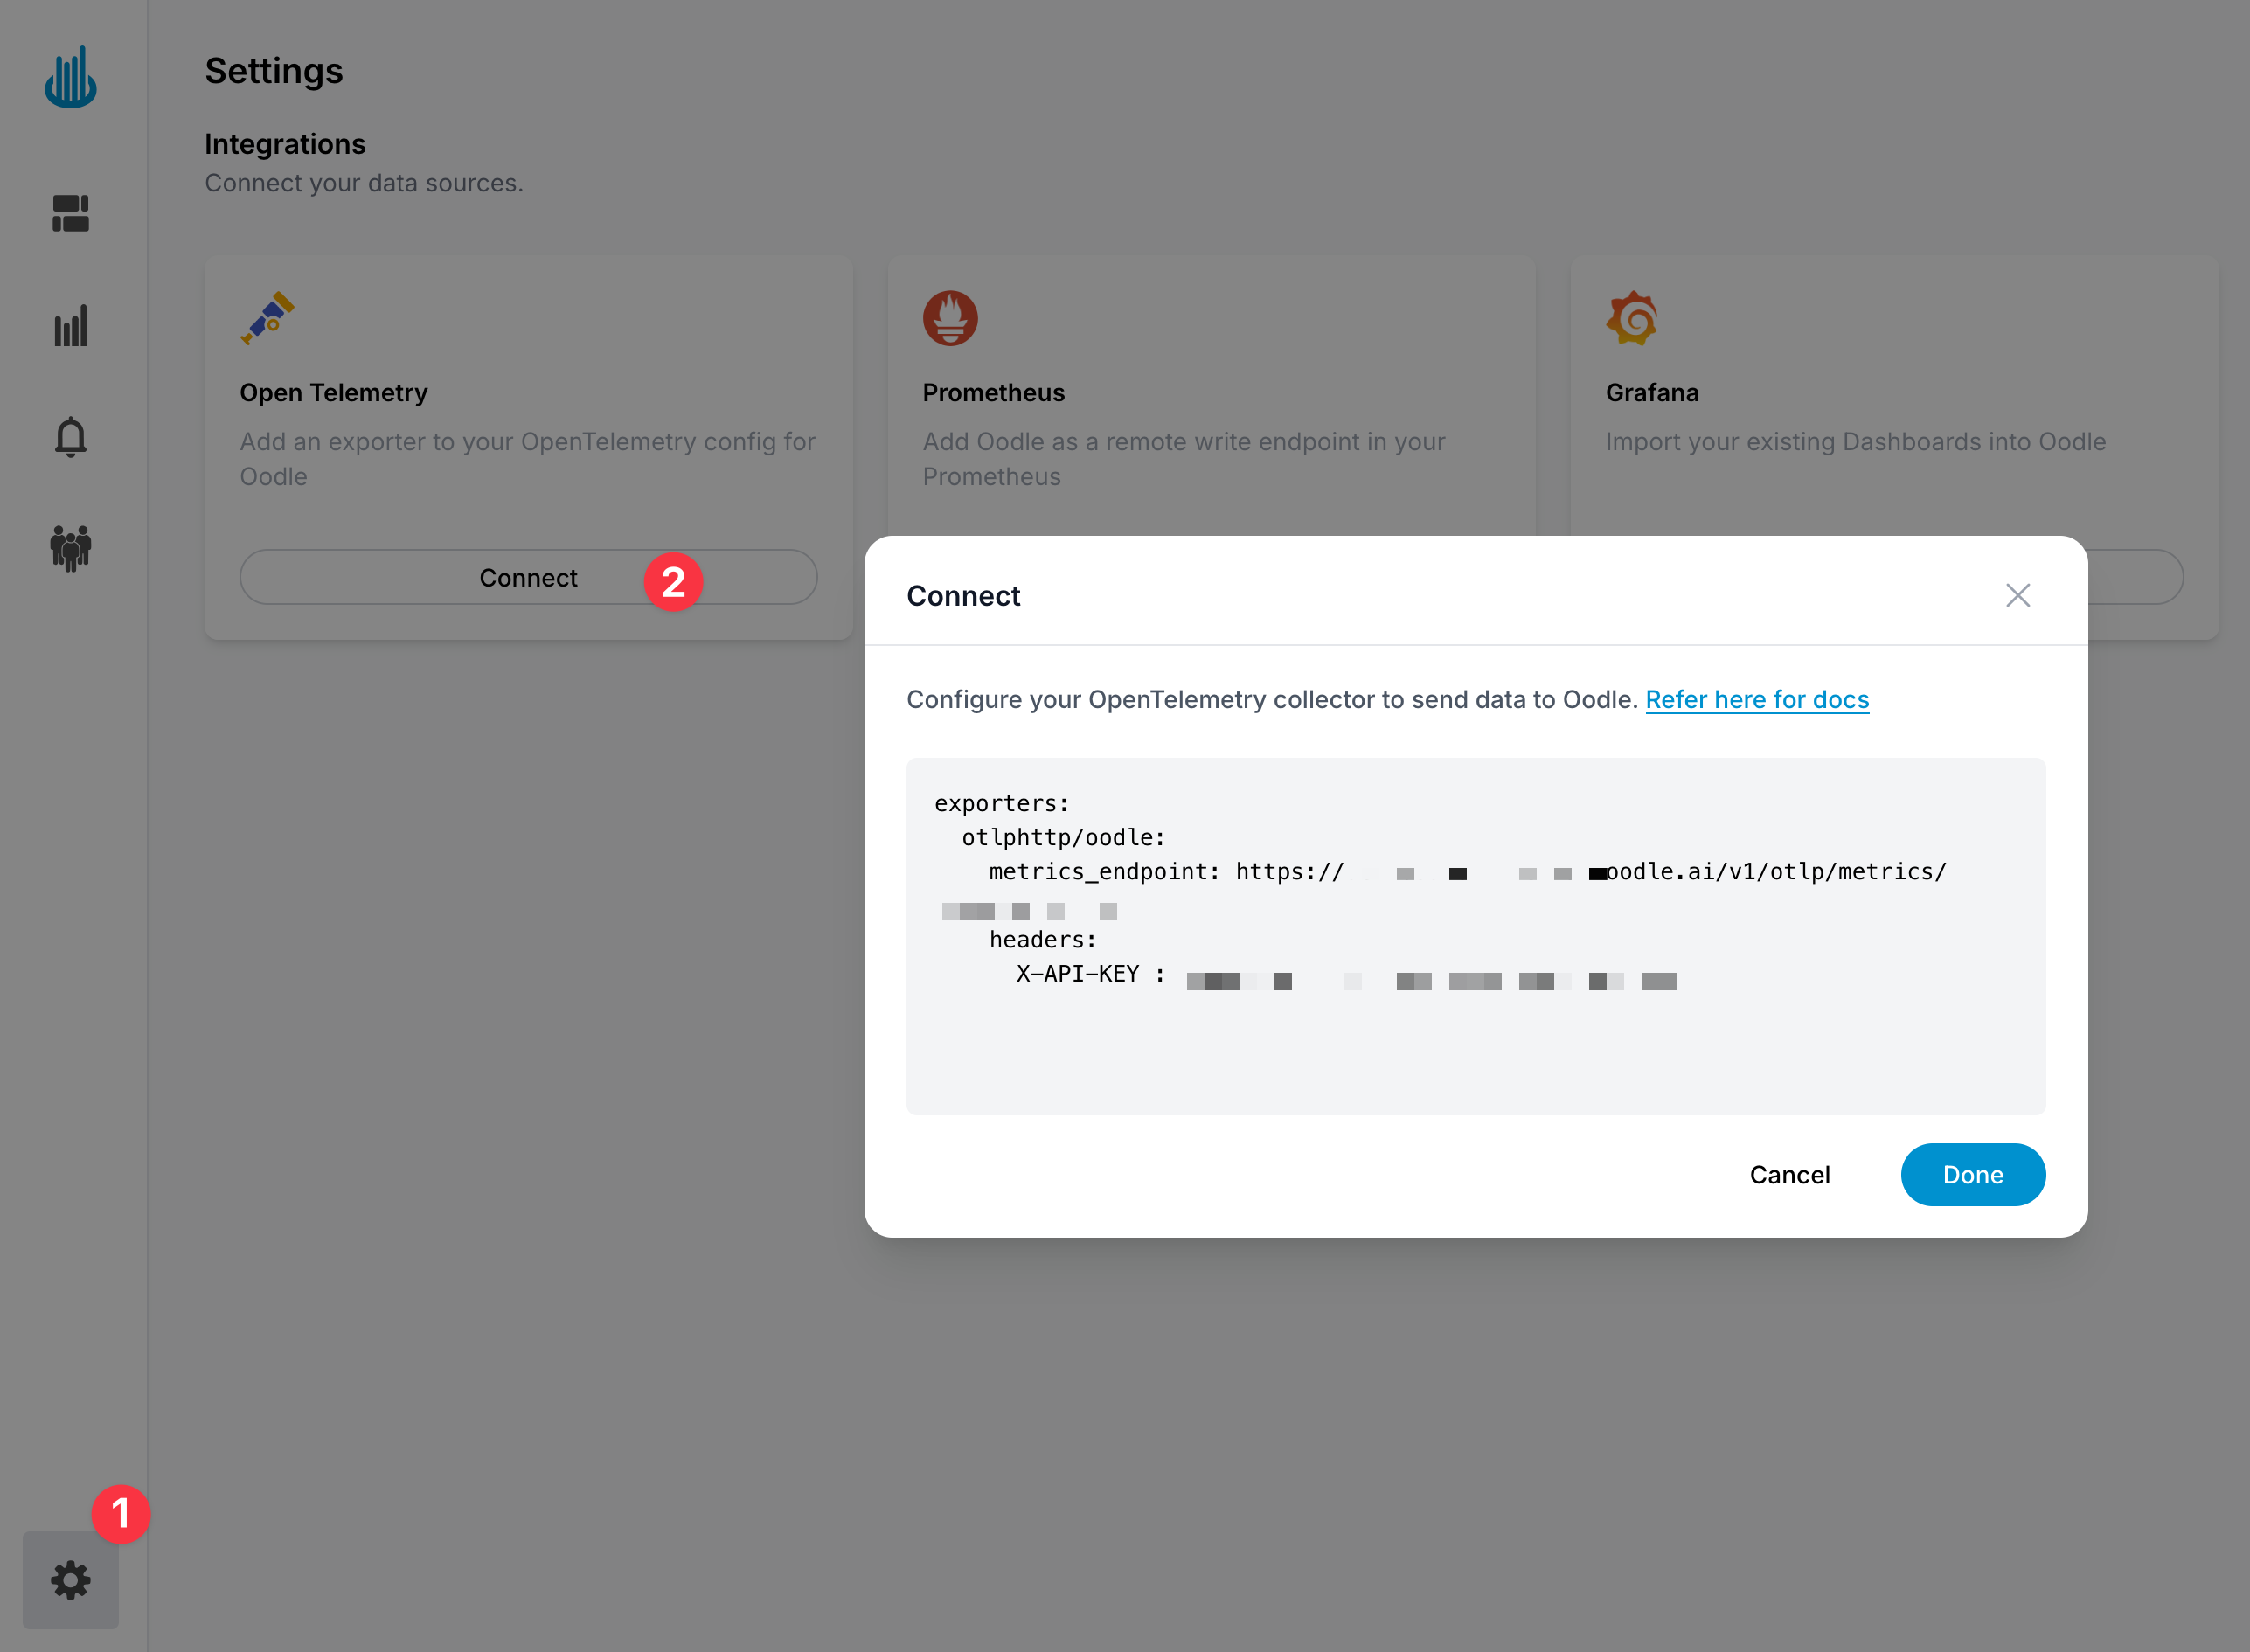
Step 1: Get Your Oodle Configuration
In the Oodle UI, navigate to the Settings page and
click on Connect in the Open Telemetry tile and copy
the provided configuration snippet which includes your
metrics endpoint and API key.
Step 2: Install the OpenTelemetry Packages
Install the core distro and OTLP exporter:
pip install opentelemetry-distro \
            opentelemetry-exporter-otlp
Then run the bootstrap command to auto-detect and install instrumentation packages for your application's dependencies (e.g. Django, Flask, psycopg):
opentelemetry-bootstrap -a install
Step 3: Configure Environment Variables
Set the following environment variables for your application:
export OTEL_SERVICE_NAME=<YOUR_SERVICE_NAME>
export OTEL_EXPORTER_OTLP_ENDPOINT=<OODLE_OTEL_ENDPOINT>
export OTEL_EXPORTER_OTLP_PROTOCOL=http/protobuf
export OTEL_TRACES_EXPORTER=otlp
export OTEL_METRICS_EXPORTER=otlp
export OTEL_LOGS_EXPORTER=otlp
export OTEL_EXPORTER_OTLP_HEADERS="X-API-KEY=<OODLE_API_KEY>"

# Auto-instrument Python logging
export OTEL_PYTHON_LOGGING_AUTO_INSTRUMENTATION_ENABLED=true

# Optional: resource attributes
export OTEL_RESOURCE_ATTRIBUTES=deployment.environment=<ENV>,service.version=<VERSION>
Step 4: Run Your Application
Wrap your normal startup command with
opentelemetry-instrument:
opentelemetry-instrument python manage.py runserver
This works with any Python entrypoint — Django, Flask, FastAPI, Gunicorn, or a plain script:
# Django
opentelemetry-instrument python manage.py runserver

# Flask / FastAPI with Gunicorn
opentelemetry-instrument gunicorn app:app

# Plain script
opentelemetry-instrument python my_script.py
Configure using Integration tile
- Login to the Oodle UI, then navigate to Settings page
- Click on the Prometheus tile
- Choose an appropriate API key from the list on top of the drawer
- Click on Setup OpenTelemetry for Python
Follow the steps in the drawer to complete the OpenTelemetry setup for Python.
Docker Configuration
When running in Docker, use an OpenTelemetry Collector sidecar to receive telemetry from your application and export it to Oodle.
Dockerfile
FROM python:3.12-slim
WORKDIR /app

COPY requirements.txt .
RUN pip install --no-cache-dir -r requirements.txt \
    && opentelemetry-bootstrap -a install

COPY . .

CMD ["opentelemetry-instrument", \
     "python", "manage.py", "runserver", \
     "0.0.0.0:8000"]
Your requirements.txt should include:
opentelemetry-distro>=0.48b0
opentelemetry-exporter-otlp>=1.27.0
Docker Compose with OTel Collector
Use Docker Compose to run your app alongside an OTel Collector that forwards telemetry to Oodle:
services:
  otel-collector:
    image: otel/opentelemetry-collector-contrib:0.96.0
    command: ["--config=/etc/otel-config.yaml"]
    volumes:
      - ./otel-collector-config.yaml:/etc/otel-config.yaml
    environment:
      - OODLE_API_KEY=${OODLE_API_KEY}
      - OODLE_METRICS_ENDPOINT=${OODLE_METRICS_ENDPOINT}
      - OODLE_TRACES_ENDPOINT=${OODLE_TRACES_ENDPOINT}
      - OODLE_LOGS_ENDPOINT=${OODLE_LOGS_ENDPOINT}
    ports:
      - "4317:4317"
      - "4318:4318"

  app:
    build: .
    environment:
      - OTEL_SERVICE_NAME=my-python-app
      - OTEL_EXPORTER_OTLP_ENDPOINT=http://otel-collector:4318
      - OTEL_EXPORTER_OTLP_PROTOCOL=http/protobuf
      - OTEL_TRACES_EXPORTER=otlp
      - OTEL_METRICS_EXPORTER=otlp
      - OTEL_LOGS_EXPORTER=otlp
      - OTEL_PYTHON_LOGGING_AUTO_INSTRUMENTATION_ENABLED=true
    depends_on:
      - otel-collector
OTel Collector Config
Configure the collector to export to Oodle:
receivers:
  otlp:
    protocols:
      grpc:
        endpoint: 0.0.0.0:4317
      http:
        endpoint: 0.0.0.0:4318

processors:
  batch:
    timeout: 10s
    send_batch_size: 1024

exporters:
  otlphttp/oodle-metrics:
    metrics_endpoint: ${env:OODLE_METRICS_ENDPOINT}
    headers:
      X-API-KEY: ${env:OODLE_API_KEY}

  otlphttp/oodle-traces:
    traces_endpoint: ${env:OODLE_TRACES_ENDPOINT}
    headers:
      X-API-KEY: ${env:OODLE_API_KEY}

  otlphttp/oodle-logs:
    logs_endpoint: ${env:OODLE_LOGS_ENDPOINT}
    headers:
      X-API-KEY: ${env:OODLE_API_KEY}

service:
  pipelines:
    metrics:
      receivers: [otlp]
      processors: [batch]
      exporters: [otlphttp/oodle-metrics]
    traces:
      receivers: [otlp]
      processors: [batch]
      exporters: [otlphttp/oodle-traces]
    logs:
      receivers: [otlp]
      processors: [batch]
      exporters: [otlphttp/oodle-logs]
Supported Instrumentations
The bootstrap command auto-detects and installs instrumentation for many popular Python libraries. For a complete list, see the OpenTelemetry Python Instrumentation documentation.
Common auto-detected libraries include:
| Library | Telemetry |
|---|---|
| Django | Traces, metrics |
| Flask | Traces, metrics |
| FastAPI | Traces, metrics |
| psycopg / psycopg2 | Traces |
| SQLAlchemy | Traces |
| requests / urllib3 | Traces |
| Celery | Traces |
| logging | Logs |
Configuration Options
Suppressing Specific Instrumentations
Disable specific auto-instrumentations using environment variables:
export OTEL_PYTHON_DISABLED_INSTRUMENTATIONS=flask,urllib3
Adjusting Metrics Export Interval
Control how frequently metrics are exported (default is 60 seconds):
export OTEL_METRIC_EXPORT_INTERVAL=10000
Recording Exceptions in Traces
Zero-code instrumentation captures basic request-level traces automatically, but application-level exceptions caught in your own code won't appear in traces unless you record them explicitly.
Use the OTel Trace SDK to attach error status and exception details to the current span:
from opentelemetry import trace
from opentelemetry.trace import StatusCode

try:
    process(data)
except Exception as exc:
    span = trace.get_current_span()
    span.set_status(StatusCode.ERROR, str(exc))
    span.record_exception(exc)
    # ... handle exception ...
    raise
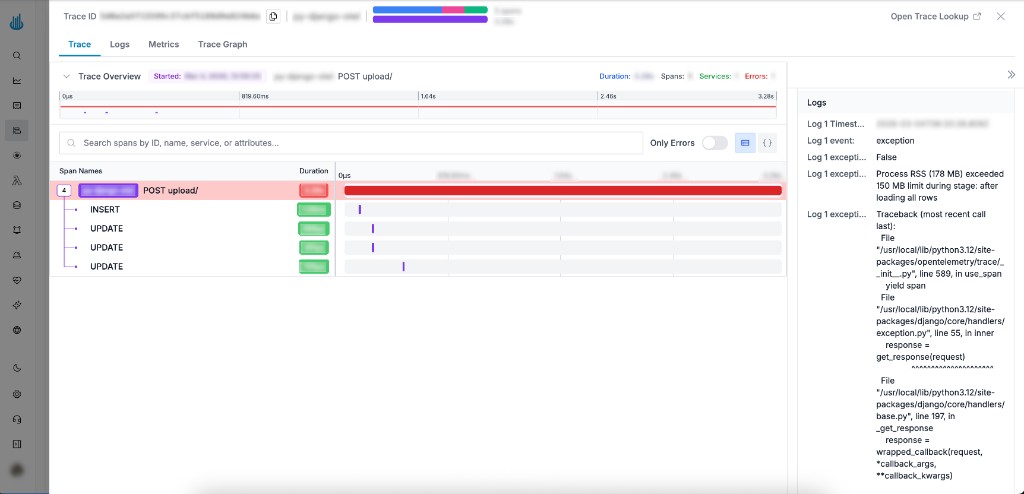
set_statusmarks the span as an error so it surfaces in Oodle's trace error filters.record_exceptionadds the exception type, message, and stack trace as a span event, visible in the trace's Events tab.
This requires no additional dependencies — the
opentelemetry-api package is already installed as part
of the zero-code instrumentation setup.
The screenshot below shows how a recorded exception appears in the Oodle Trace UI — the span is marked as an error, and the full stack trace is visible in the Logs panel on the right.
Troubleshooting
Common Issues
- No telemetry appearing: Verify your Oodle endpoint and API key are correct
- Missing library instrumentation: Re-run
opentelemetry-bootstrap -a installafter adding new dependencies - Logs not captured: Ensure
OTEL_PYTHON_LOGGING_AUTO_INSTRUMENTATION_ENABLEDis set totrue
Debug Mode
Enable debug logging to troubleshoot issues (not recommended for production):
export OTEL_LOG_LEVEL=DEBUG
Support
If you need assistance or have any questions, please reach out to us through:
- Email at [email protected]