Synthetic Monitoring
Synthetic monitoring allows you to proactively monitor the availability and performance of your services by running automated checks from multiple locations. Unlike traditional monitoring that relies on metrics from your infrastructure, synthetic monitoring tests your services from the outside, simulating real user interactions.
Supported Check Types
Oodle supports several types of synthetic checks:
| Check Type | Description |
|---|---|
| HTTP | Monitor web endpoints for availability, response time, and status codes |
| DNS | Verify DNS resolution and response times |
| TCP | Test TCP connectivity to hosts and ports |
| SSL Certificate | Monitor SSL/TLS certificate expiration and validity |
| Ping | Check host availability using ICMP ping |
| Traceroute | Analyze network paths and identify routing issues |
| Multi-step API | Chain multiple HTTP requests, passing values (tokens, IDs) between them |
Creating a Synthetic Monitor
- Navigate to Synthetic Monitors in the sidebar
- Click the Create Monitor button (or the + button)
- Configure your monitor:
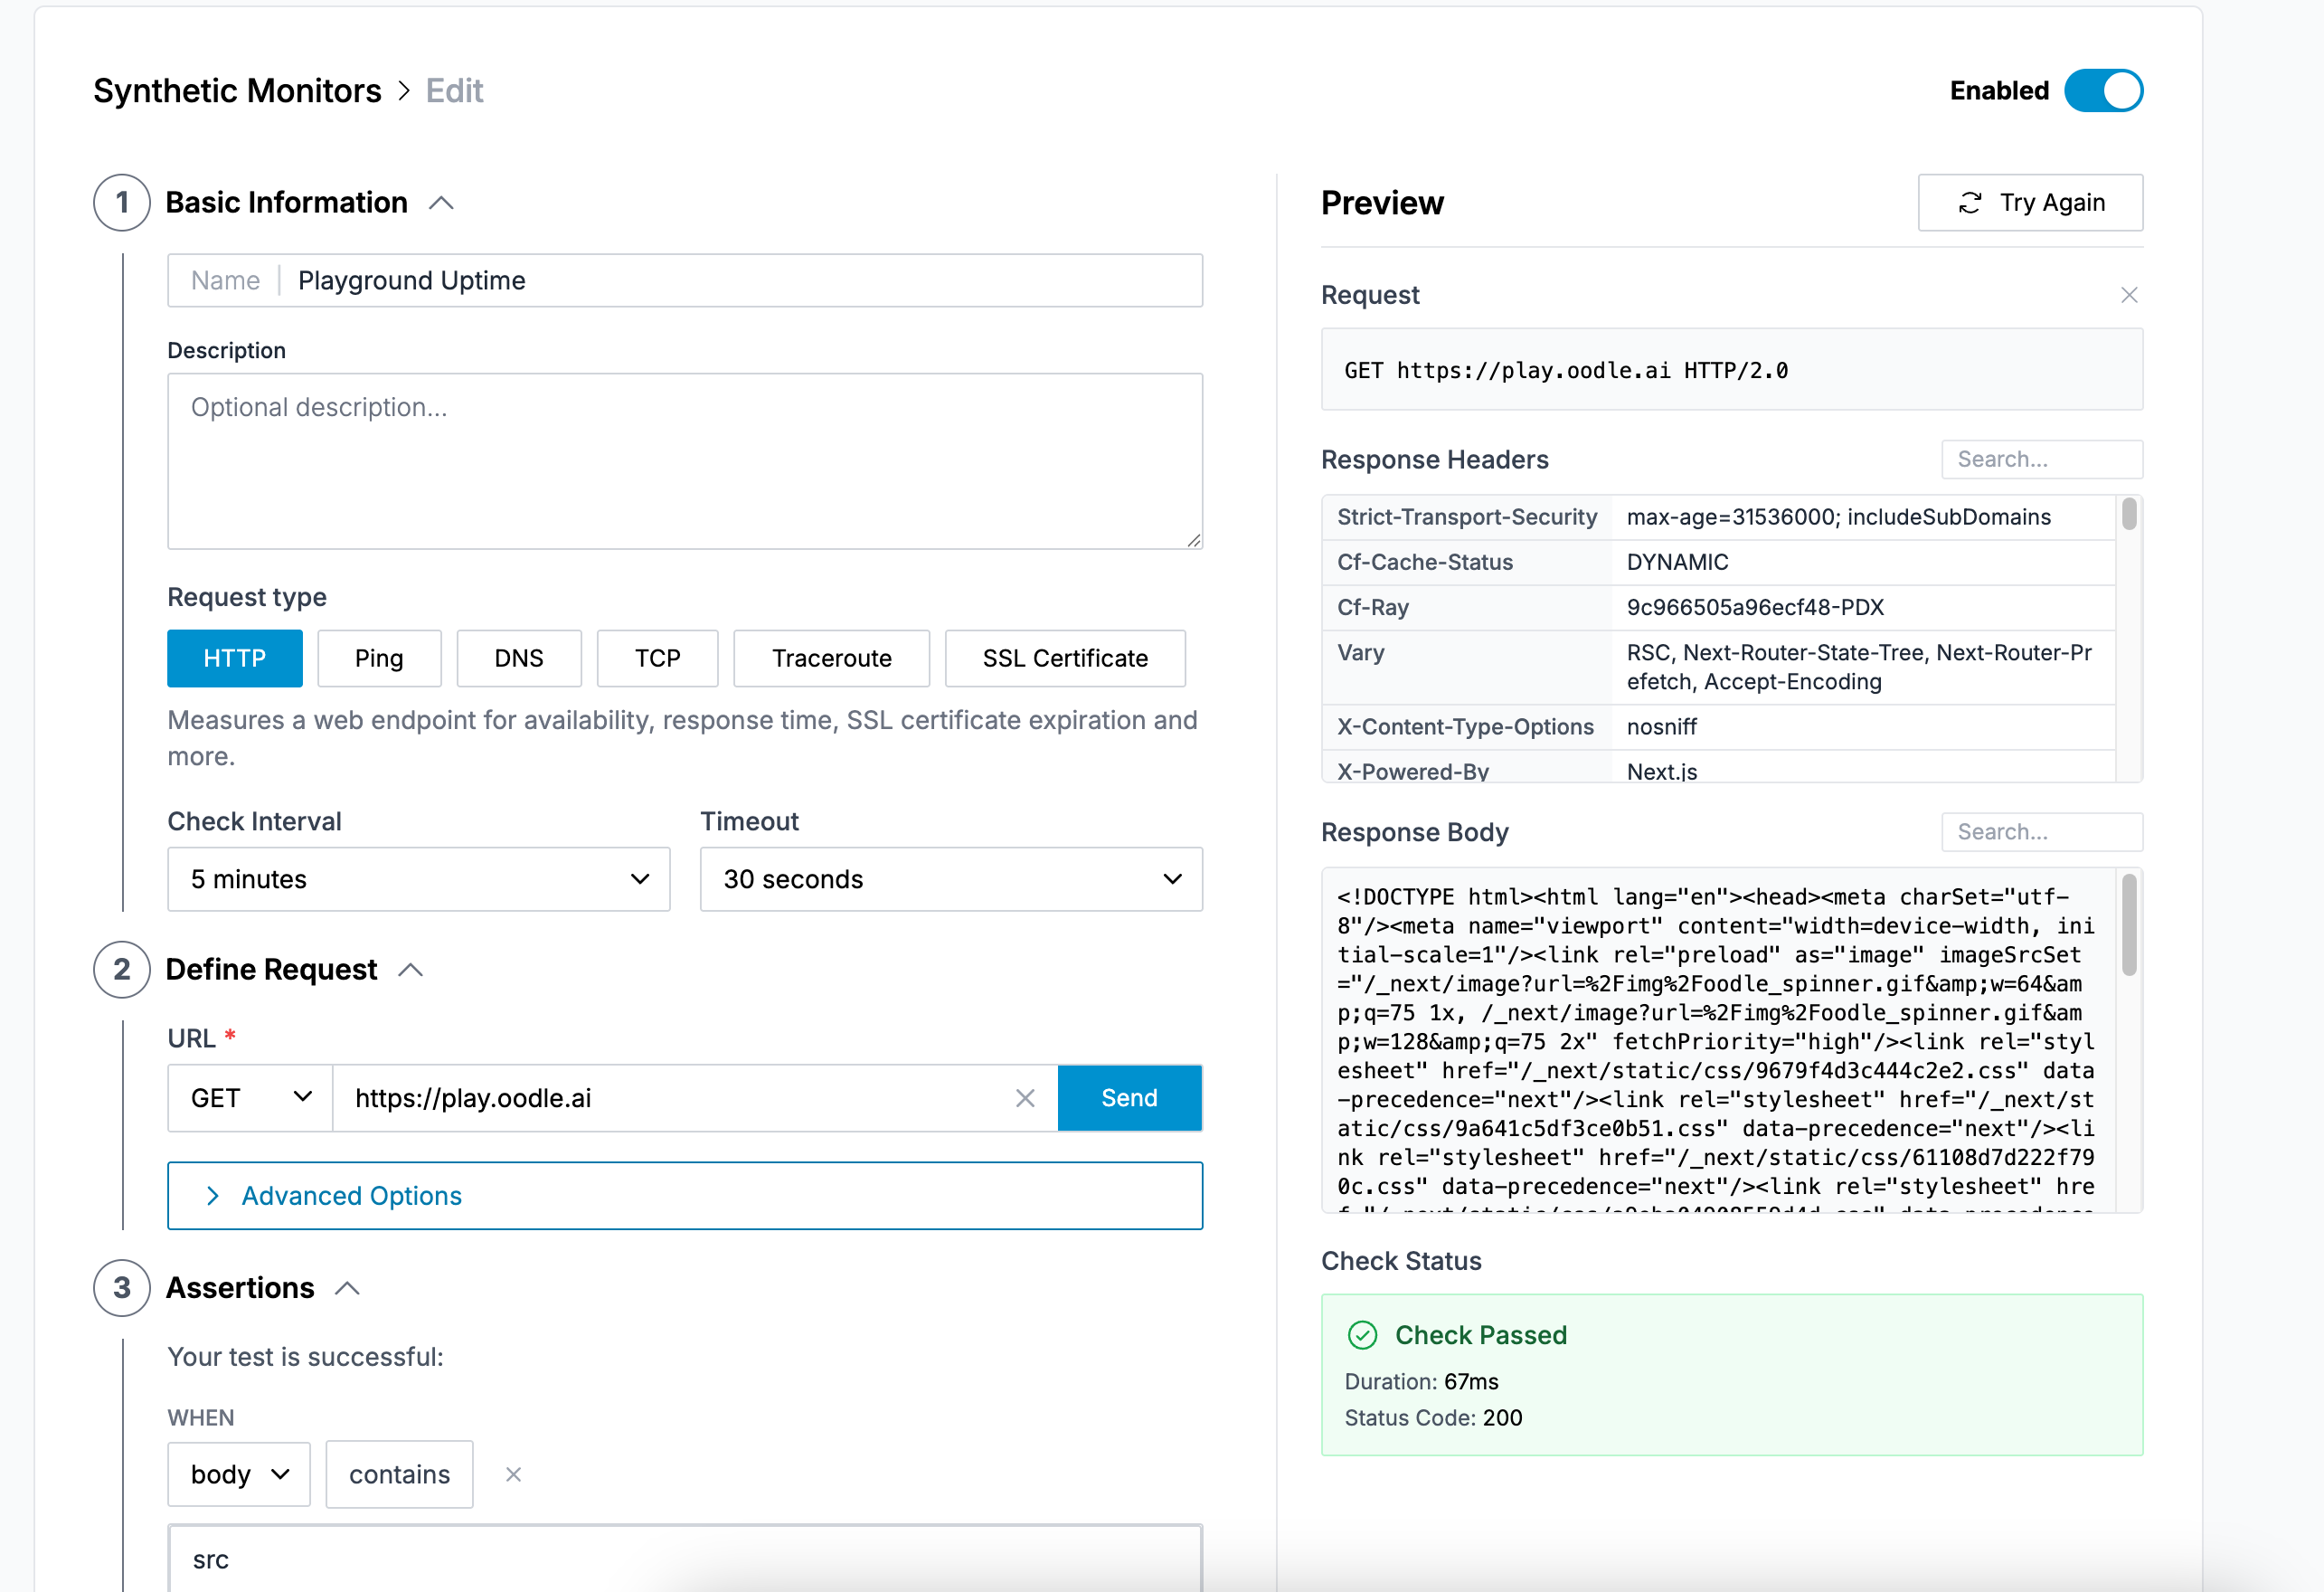
Step 1: Basic Configuration
- Name: Enter a descriptive name for your monitor
- Description: (Optional) Add details about what this monitor checks
- Request Type: Select the type of check (HTTP, DNS, TCP, etc.)
- Check Interval: How often the check runs (e.g., 5 minutes)
- Timeout: Maximum time to wait for a response (e.g., 30 seconds)
Step 2: Request Configuration
The configuration options vary based on the check type:
HTTP Checks
- URL: The endpoint to monitor
- Method: HTTP method (GET, POST, PUT, DELETE, etc.)
- Advanced Options:
- Custom headers
- Request body
- Authentication
- Expected status codes
- Response validation
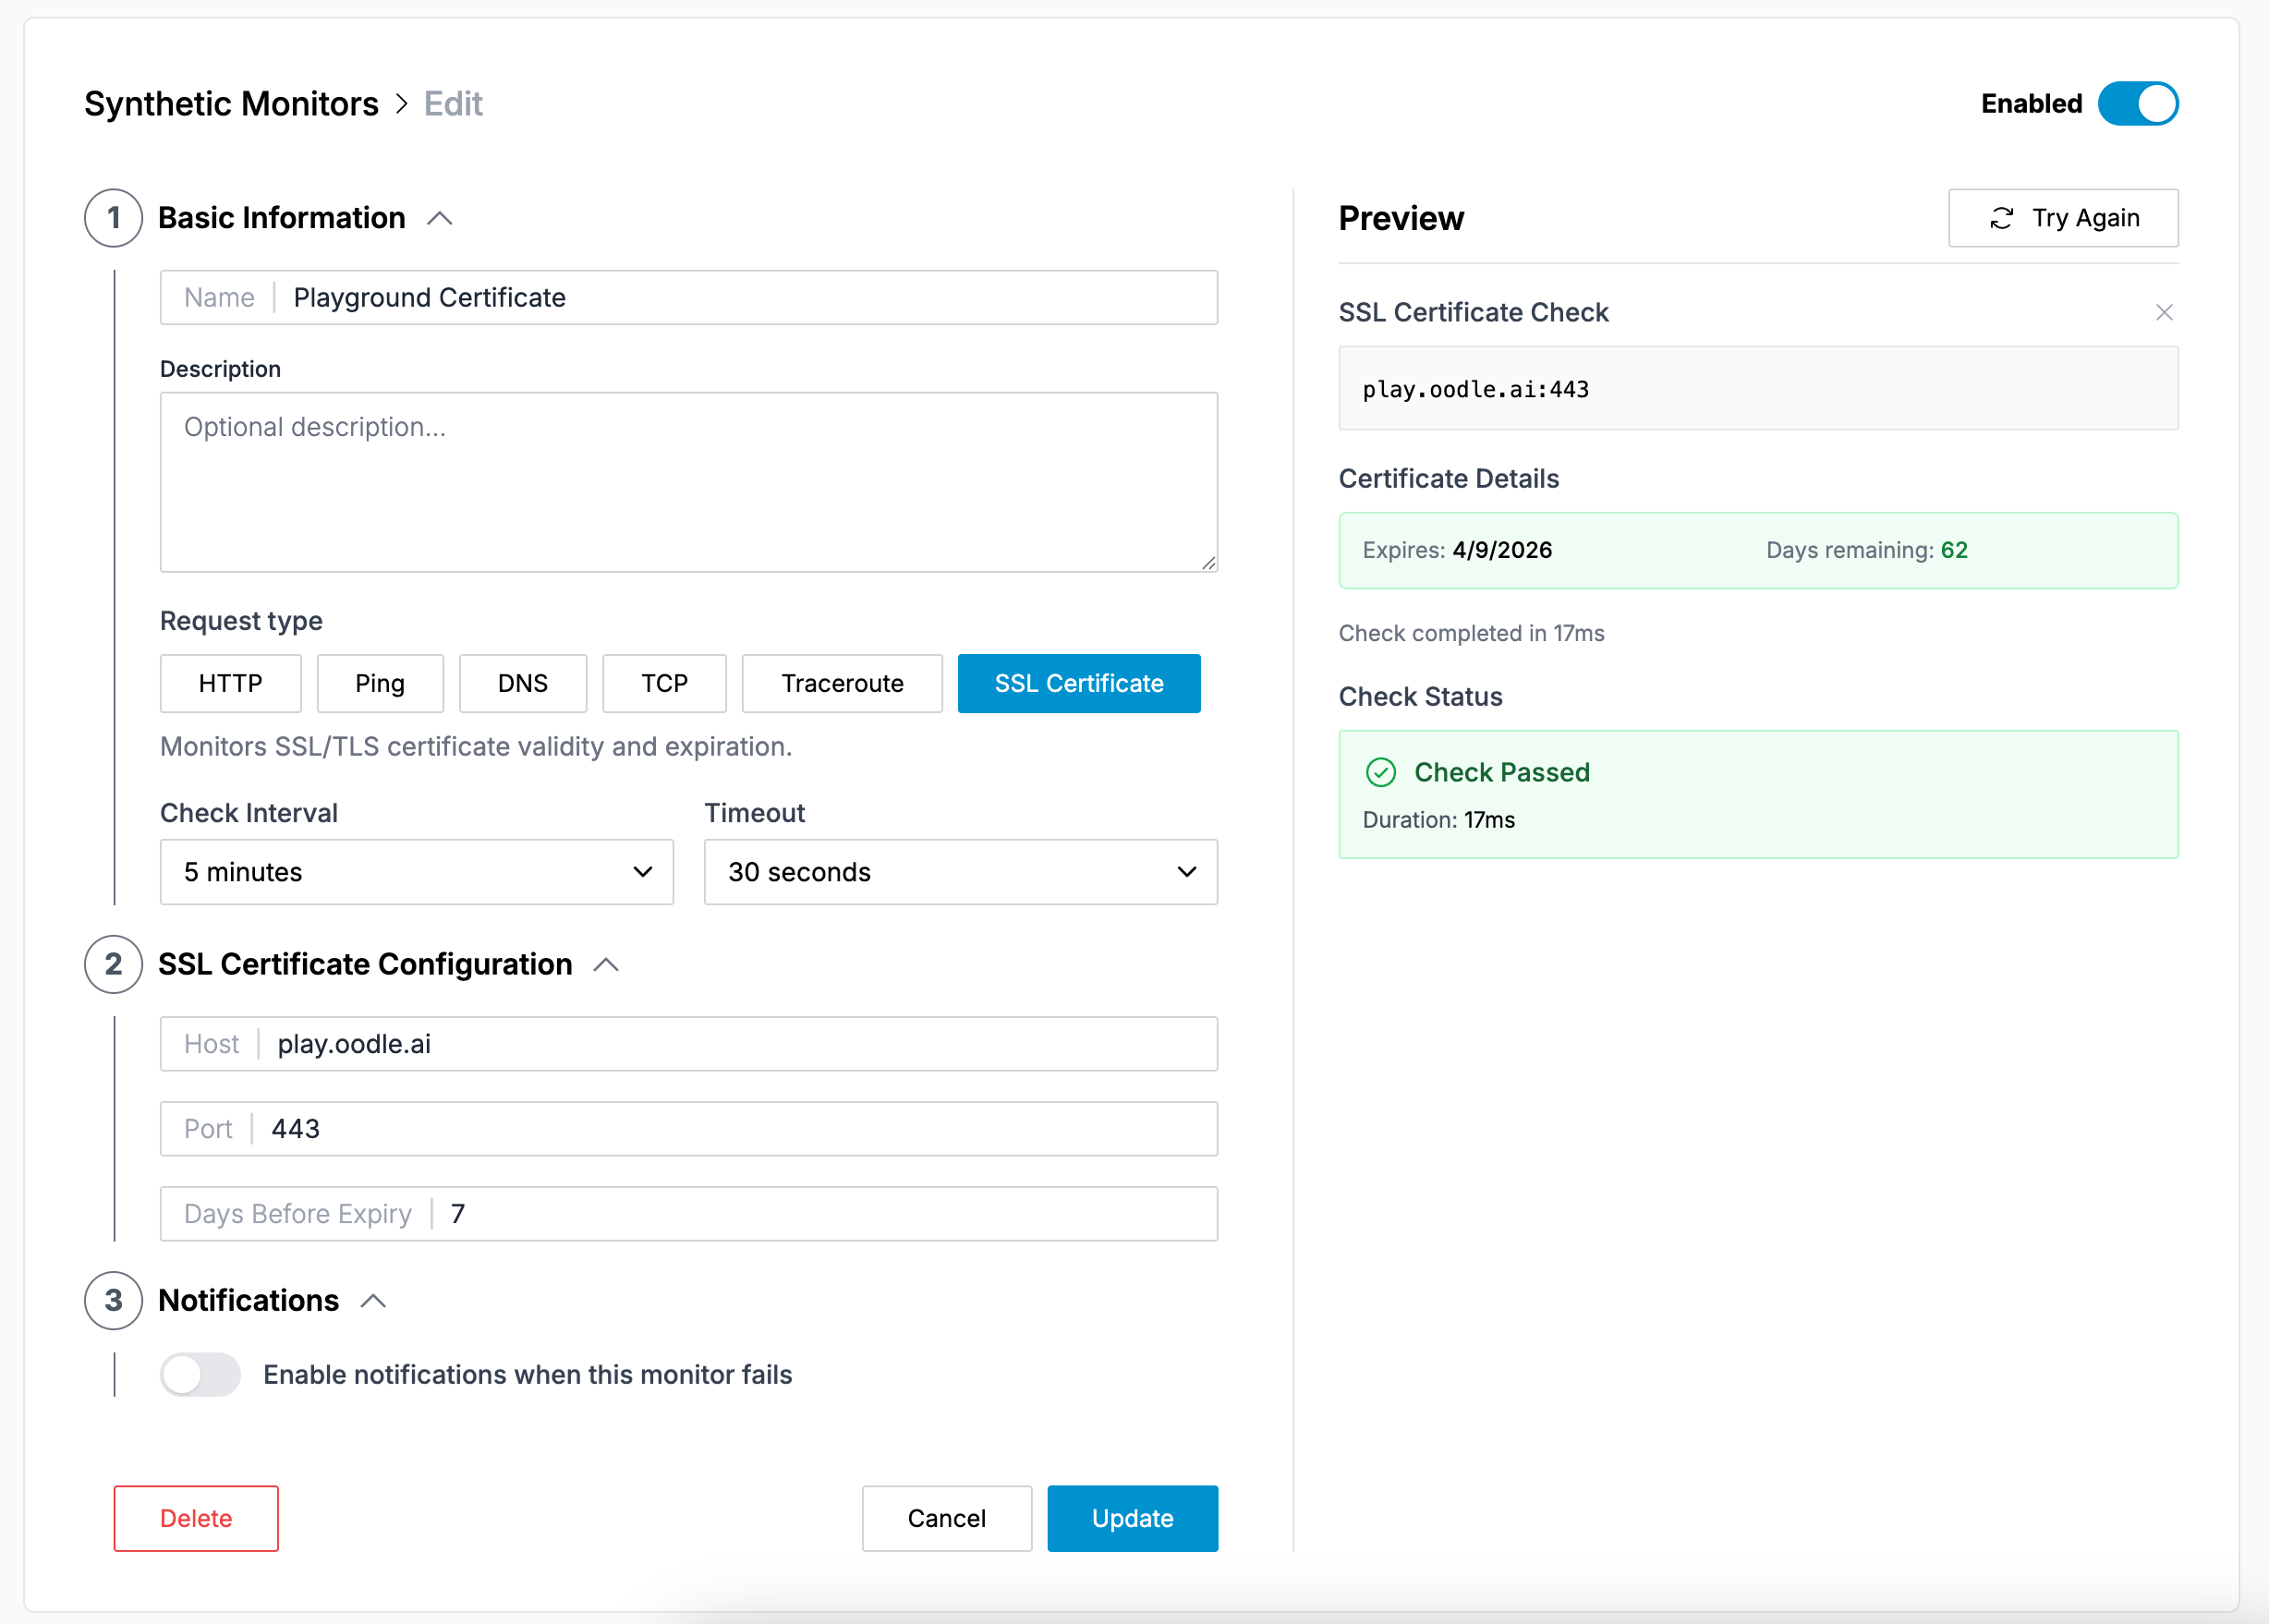
SSL Certificate Checks
- Hostname: Domain to check certificate for
- Port: HTTPS port (default: 443)
- Expiration Warning: Days before expiration to alert
DNS Checks
- Hostname: Domain name to resolve
- Record Type: DNS record type (A, AAAA, CNAME, MX, etc.)
- Expected Values: (Optional) Validate DNS responses
TCP Checks
- Host: Target hostname or IP
- Port: TCP port to connect to
Ping Checks
- Host: Target hostname or IP to ping
Multi-step API Checks
A multi-step monitor runs an ordered chain of HTTP requests in a single
check. Each step is configured like a standalone HTTP check (URL, method,
headers, auth, body, assertions). Later steps can reuse values captured
from earlier responses - for example, request a token in step 1 and
attach it as Authorization: Bearer {{ACCESS_TOKEN}} in step 2.
See Multi-step API Checks below for the full configuration reference.
Step 3: Alerting Configuration
Configure how you want to be notified when checks fail:
- Notification Policy: Select which notification policy to use for routing alerts to your configured notifiers (Slack, PagerDuty, etc.)
- Labels: Add metadata labels for filtering and organization
Oodle automatically handles alert generation when checks fail - you just need to configure where notifications should be sent.
Step 4: Preview and Save
Use the Run Check button to test your configuration before saving. This runs an immediate check and shows you the results.
Click Save to create the monitor.
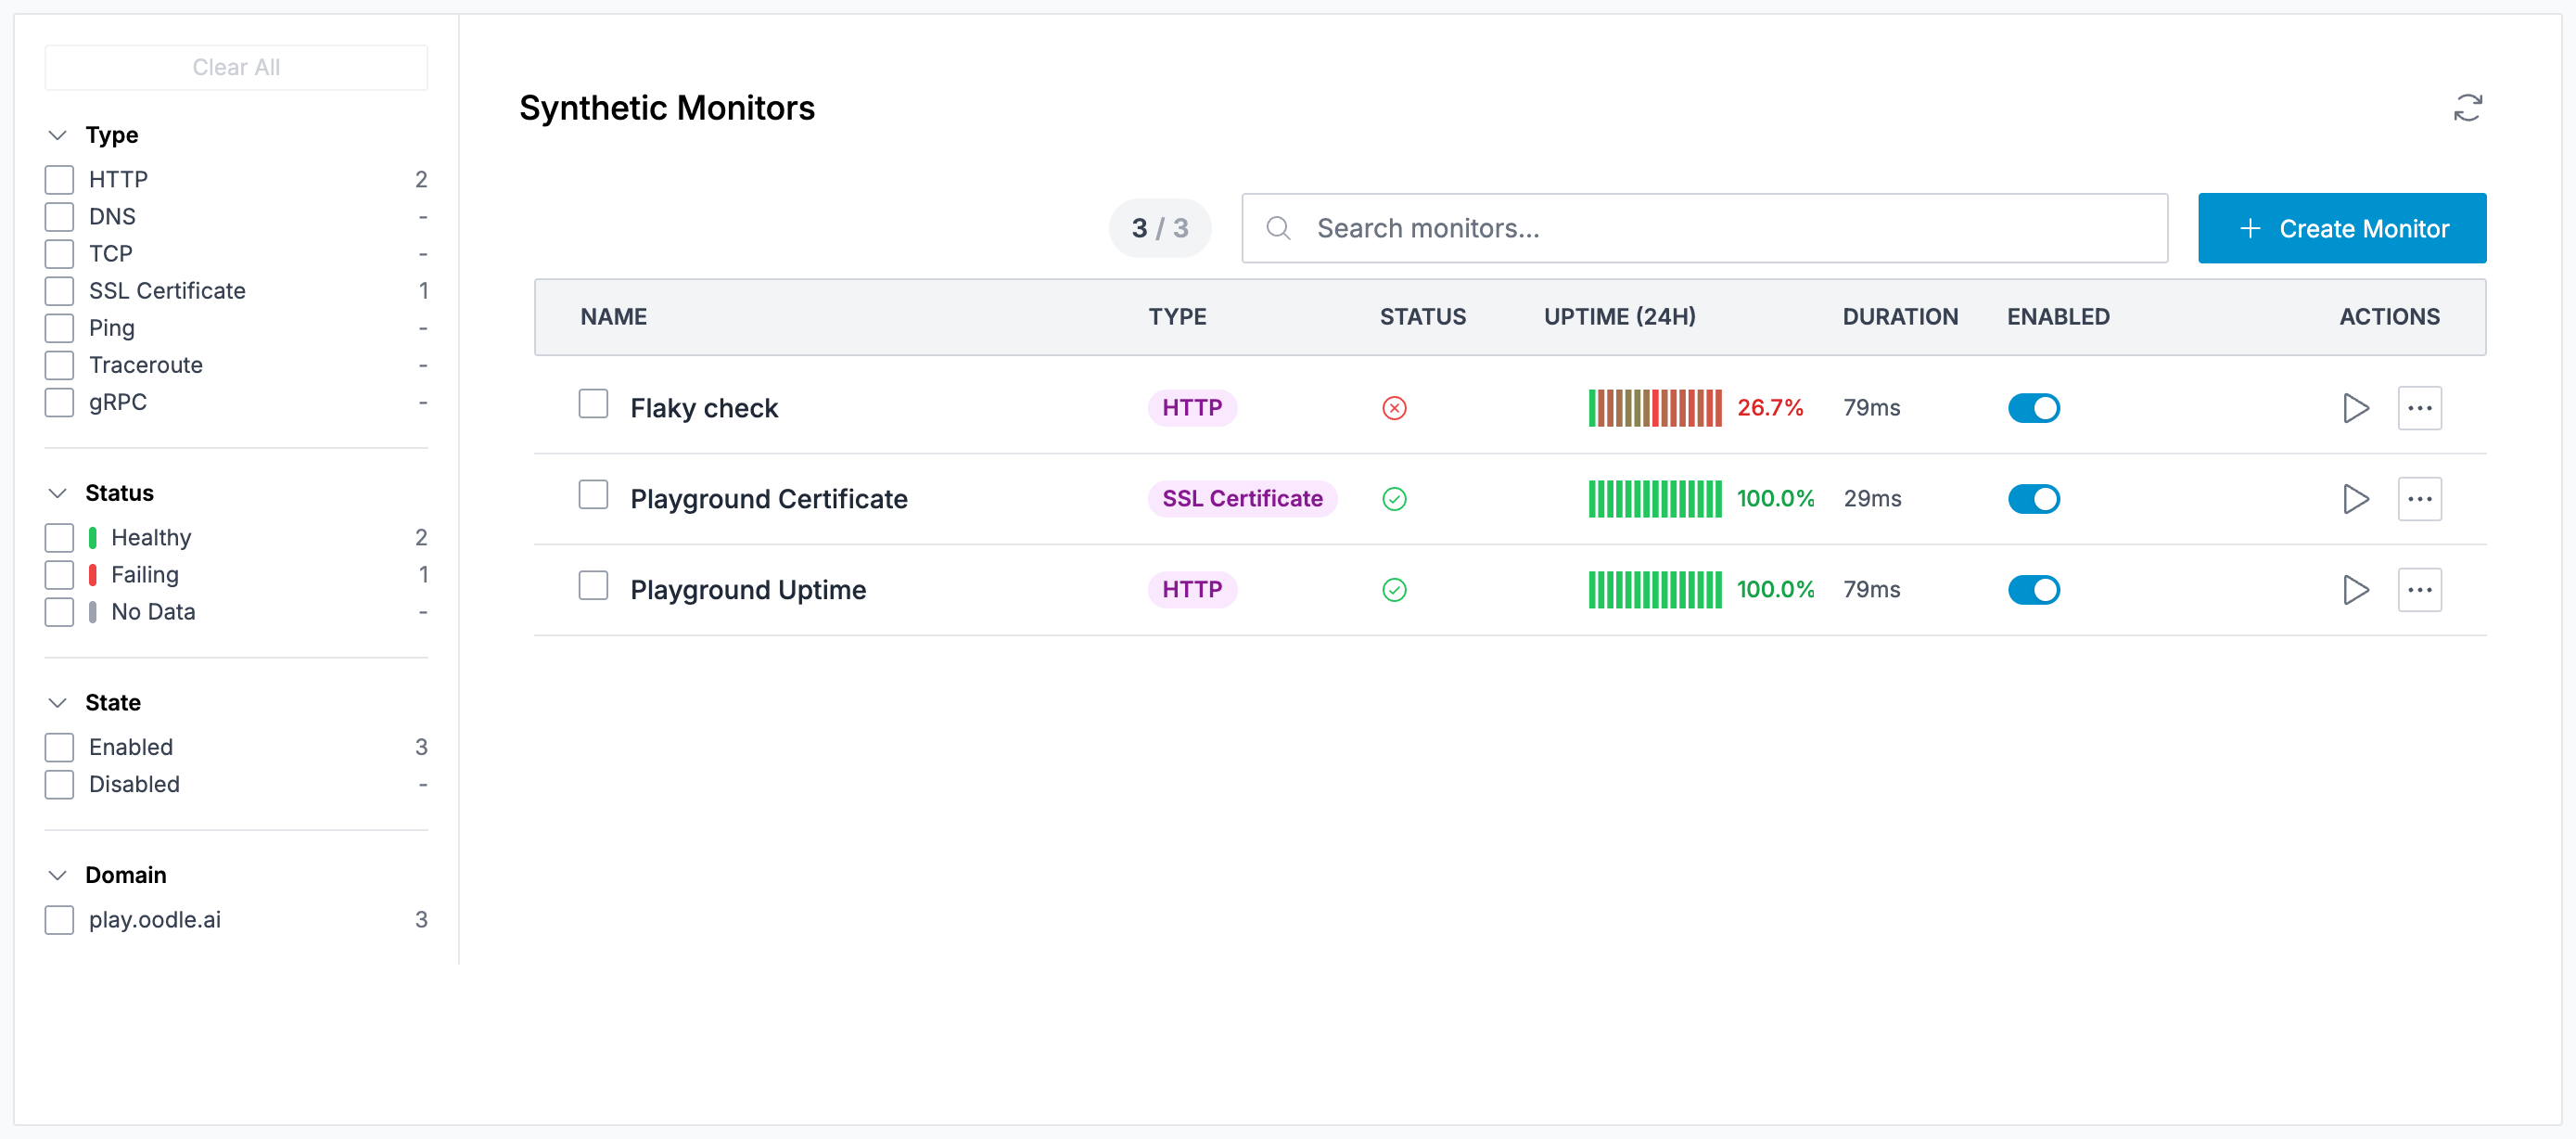
Viewing Monitor Status
The synthetic monitors list shows:
- Name: Monitor name with a link to details
- Type: The check type (HTTP, DNS, SSL, etc.)
- Status: Current status (Healthy, Failing, No Data)
- Uptime (24H): Visual representation of uptime over the last 24 hours
- Duration: Average response time
- Enabled: Toggle to enable/disable the monitor
Filtering Monitors
Use the sidebar filters to find specific monitors:
- Filter by check type (HTTP, DNS, TCP, etc.)
- Filter by status (Healthy, Failing, No Data)
- Filter by enabled/disabled state
- Filter by location
Monitor Details
Click on any monitor row to open the details drawer, which provides comprehensive information about the monitor without leaving the list view.
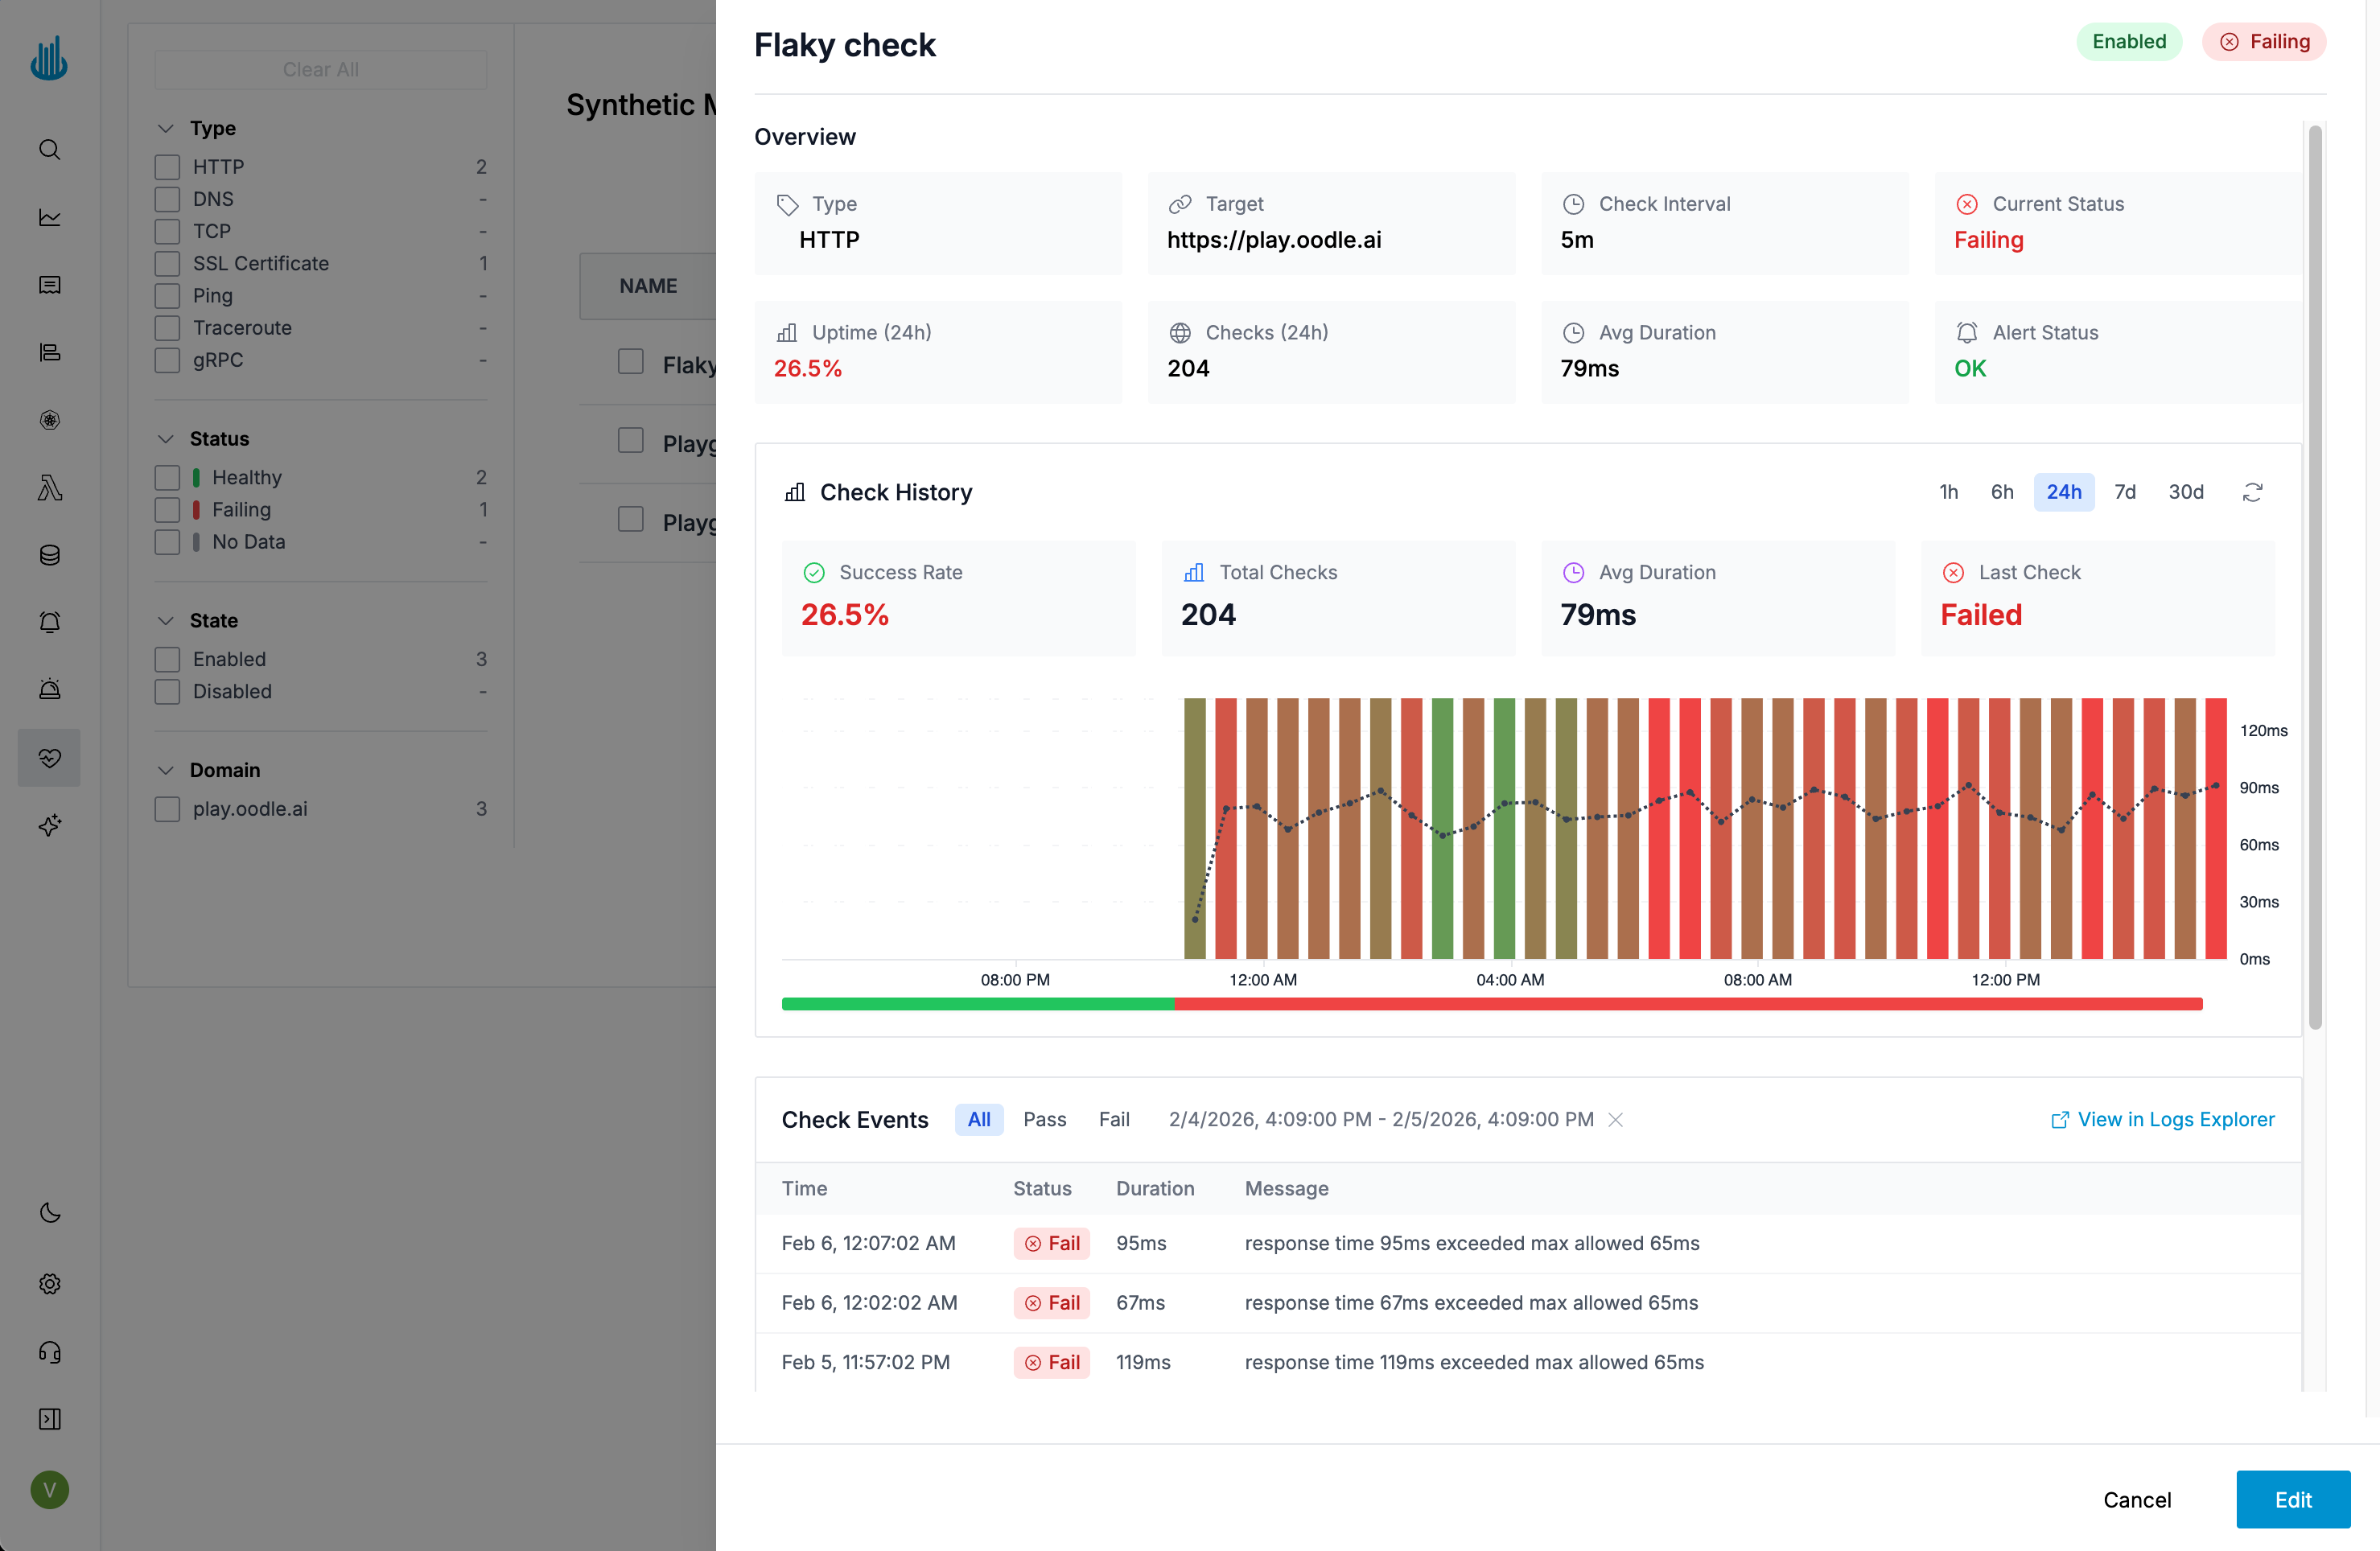
Header
The header displays:
- Monitor Name and description
- Status Badges: Enabled/Disabled, Alert status, Current state (Passing/Failing)
Overview Section
A grid of key metrics including:
- Type: The check type (HTTP, DNS, SSL, etc.)
- Target: The URL, hostname, or endpoint being monitored
- Check Interval: How often the check runs
- Current Status: Passing or Failing
- Uptime (24h): Success rate percentage over the last 24 hours
- Checks (24h): Total number of checks in the last 24 hours
- Avg Duration: Average response time
- Alert Status: Whether an alert is currently firing
Check History
An interactive timeline chart showing check results over time:
- Green bars indicate successful checks
- Red bars indicate failed checks
- Click on a bar to zoom into that time period and see detailed events
- Adjust the time range using the time picker
Check Events
A paginated table of individual check executions:
- Time: When the check ran
- Status: Pass or Fail badge
- Duration: Response time in milliseconds
- Message: Error message for failed checks
You can filter events by status (All, Pass, Fail) and click on any row to see full details including response headers, body, and complete error information.
Actions
Click the Edit button to open the monitor editor and modify settings.
Multi-step API Checks
Multi-step monitors execute an ordered chain of HTTP requests and pass data between them. Use this when a single request isn't enough to exercise the workflow you want to monitor - for example, an API that requires a fresh token per run, a create-then-read flow that needs the new resource's ID, or a login + protected-endpoint pair.
How a Run Works
On every check interval, Oodle runs the steps in order from a single location. Each step:
- Substitutes any
{{VAR_NAME}}placeholders in the URL, headers, and body with values captured by earlier steps. - Sends the HTTP request and evaluates its assertions, exactly like a standalone HTTP check.
- Applies that step's extract rules to bind new variables for later steps.
The overall monitor passes when every required step (every step that doesn't have Continue to next step even if this one fails enabled) passes.
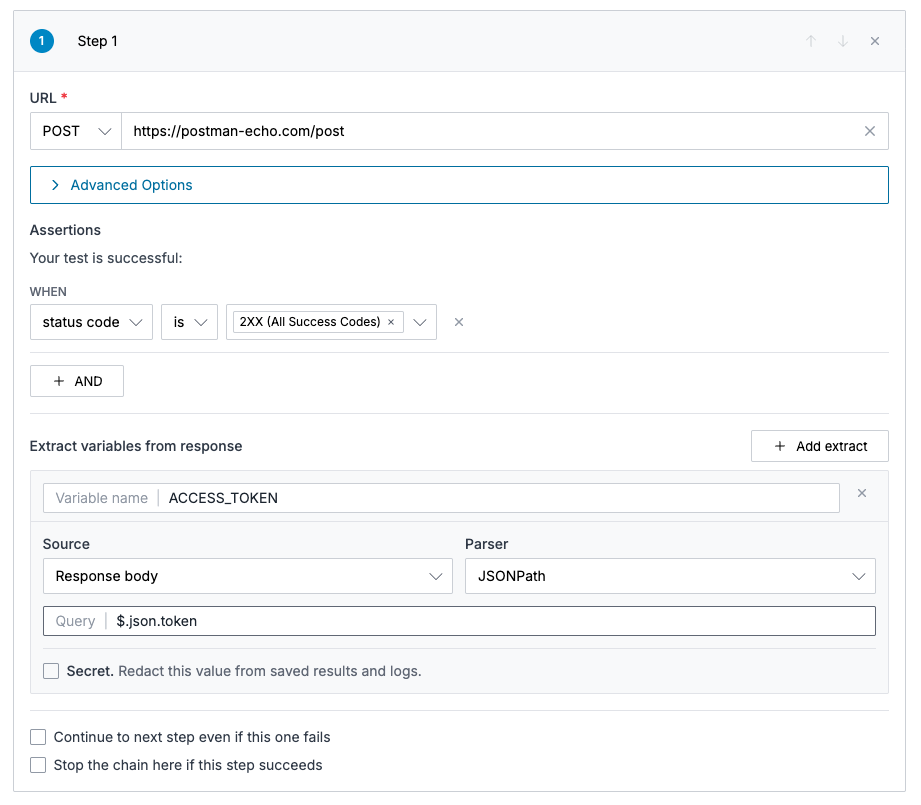
Steps
Each step has its own:
- Name — used in run-history rows and error messages.
- Request — URL, method (GET / POST / PUT / DELETE / HEAD / OPTIONS), headers, request body (POST / PUT / PATCH), follow-redirects and ignore-cert-error toggles, and authentication (None, Basic Auth, or Bearer Token).
- Assertions — body contains, header value, response time, and status code conditions, evaluated against that step's response.
- Extract rules — pull values out of the response into named variables (see below).
- Continue to next step even if this one fails — when on, a failing step does not stop the chain; the failure is recorded but later steps still execute.
- Stop the chain here if this step succeeds — when on, a successful step ends the chain early and marks the overall monitor as passed.
Extracting Variables from Responses
Extract rules capture a value from a step's response and bind it to a
variable that later steps can interpolate as {{VAR_NAME}}.
Variable names must be uppercase, start with a letter, contain only
letters, digits, and underscores, and be at least 3 characters long
(e.g. ACCESS_TOKEN, USER_ID, SESSION_42). The editor uppercases
input automatically.
Each extract rule selects:
| Field | Options |
|---|---|
| Source | Response body or Response header |
| Parser | JSONPath, Regex, or Header value |
| Query / Header name | What to read — see below |
The valid combinations are:
- Body + JSONPath —
Queryis a JSONPath expression evaluated against the JSON body (e.g.$.access_token,$.data[0].id). - Body + Regex —
Queryis a regular expression; the first capture group is the extracted value (e.g."id":"([^"]+)"). - Header + Header value —
Queryis the header name (e.g.X-Auth-Token). - Header + Regex —
Queryis a regular expression matched against the named header's value; the first capture group is extracted.
Each variable name can only be defined once in the chain — a later
step cannot shadow an earlier extract. Variables are validated at save
time: if step N references {{VAR}} and no earlier step defines it,
the save is rejected.
Using Variables in Later Steps
Reference captured variables anywhere in a later step's request — URL,
header names or values, or body. For example, after extracting
ACCESS_TOKEN:
- URL:
https://api.example.com/users/{{USER_ID}} - Header:
Authorization: Bearer {{ACCESS_TOKEN}} - Body:
{"token": "{{ACCESS_TOKEN}}"}
Secret Variables
Toggling Secret on an extract rule redacts the captured value everywhere it could be surfaced in run results — response bodies, error messages, and the request headers shown in the run preview. Use this for tokens, credentials, and any other value you don't want to appear in saved check results.
Private Endpoint Monitoring
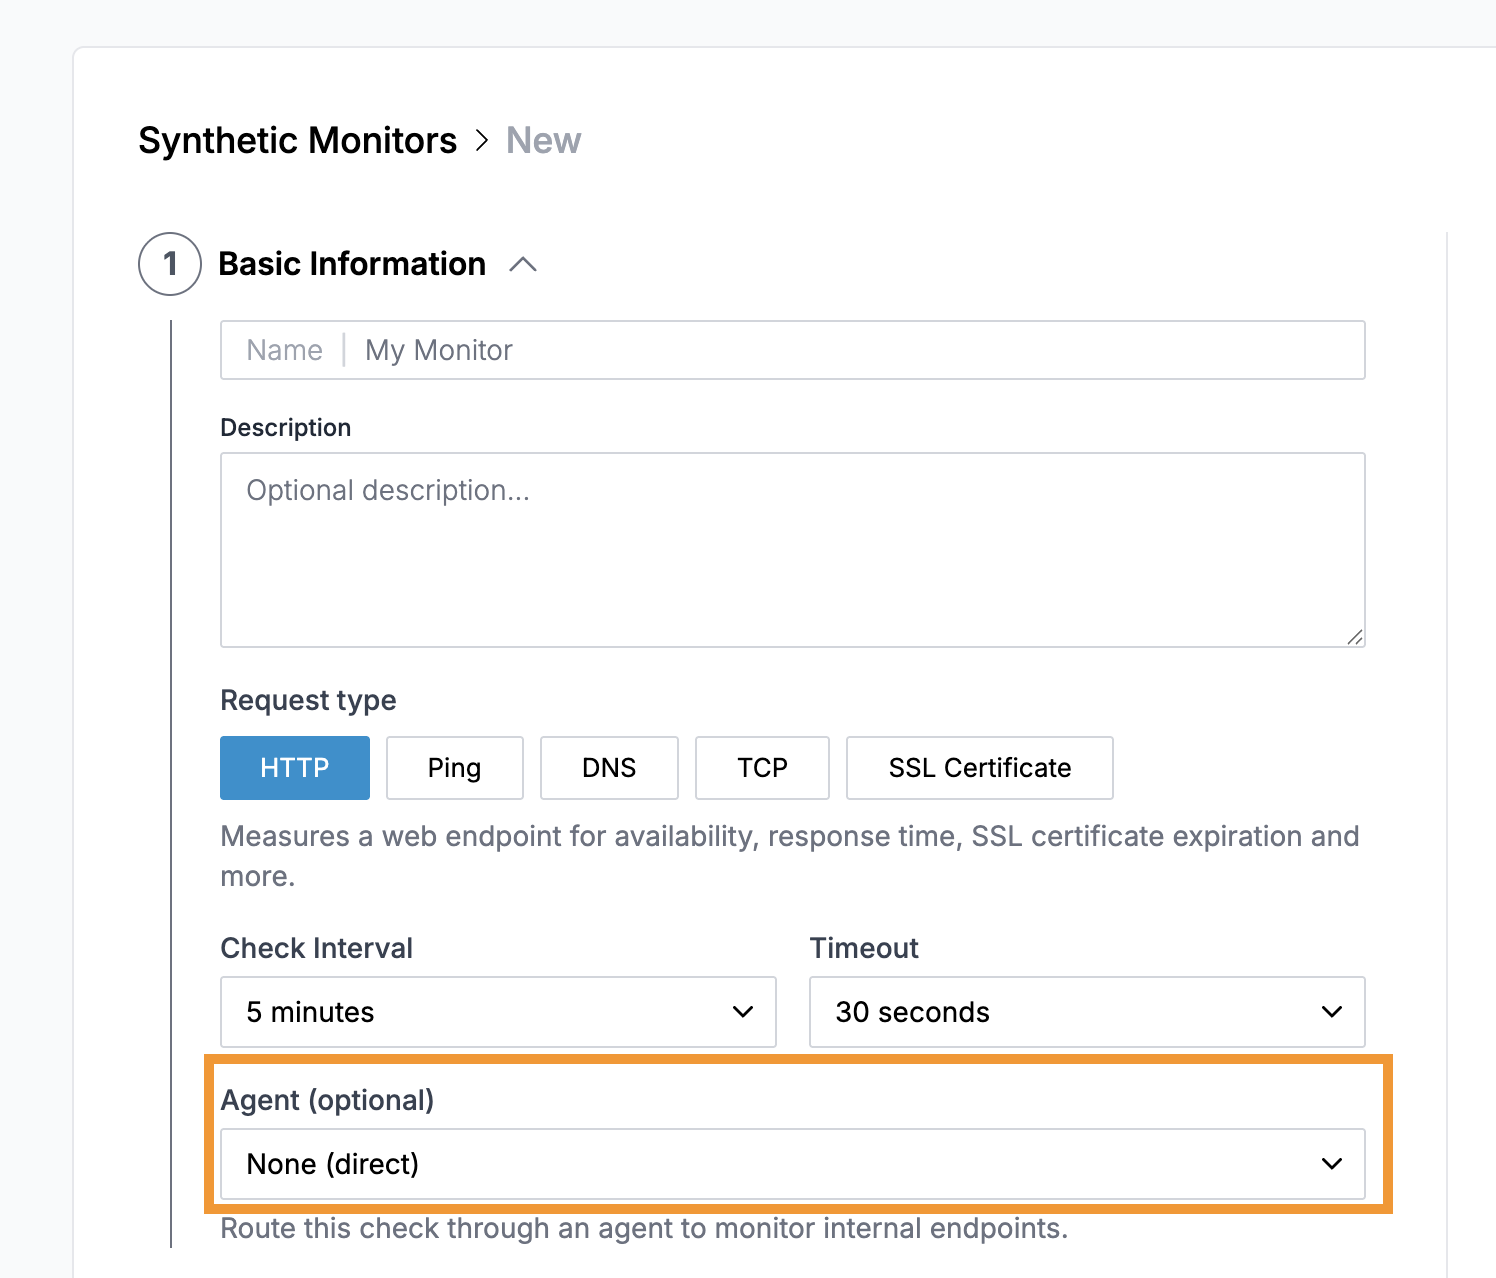
By default, synthetic checks run from Oodle's cloud infrastructure and can only reach publicly accessible endpoints. To monitor services inside your private network (e.g. internal APIs, VPC-only hosts, on-prem servers), you can route checks through an Oodle Agent.
How It Works
- Create and deploy an agent inside the network where your private endpoints live
- When creating or editing a synthetic monitor, select the agent from the Agent dropdown
- Oodle sends the check request to the agent, which executes it locally and returns the result
All check types are supported through agents: HTTP, DNS, TCP, SSL Certificate, Ping, and Traceroute.
Example: Monitoring an Internal API
To monitor http://api.internal:8080/health that is only reachable from
within your Kubernetes cluster:
- Deploy an agent named
prod-clusterinto that cluster (instructions) - Create a new synthetic monitor:
- Request Type: HTTP
- URL:
http://api.internal:8080/health - Agent:
prod-cluster - Check Interval: 5 minutes
- Configure alerting as usual
The check runs from the agent pod inside the cluster, so it can resolve internal DNS names and reach private IPs.
Considerations
- The agent must be ACTIVE (connected) for checks to execute. If the agent disconnects, checks routed through it will fail.
- Check latency includes the round-trip through the WebSocket tunnel. For latency-sensitive thresholds, account for a few milliseconds of overhead.
- You can use separate agents for different environments (e.g.
prod-vpc,staging-vpc) to isolate monitoring.
Best Practices
Choose Appropriate Intervals
- Critical services: 1-5 minute intervals
- Standard services: 5-15 minute intervals
- Low-priority services: 15-60 minute intervals
Set Meaningful Timeouts
Configure timeouts based on expected response times:
- Fast APIs: 5-10 seconds
- Web pages: 15-30 seconds
- Complex operations: 30-60 seconds
Use Multiple Check Types
Combine different check types for comprehensive monitoring:
- HTTP checks for API availability
- SSL certificate checks for expiration warnings
- DNS checks for resolution verification
Support
If you need assistance or have any questions, please reach out to us through:
- Email at [email protected]