Oodle QuickStart Guide
Your first week with Oodle
Here's what we recommend to get the most out of the platform. Each item links to a section below with everything you need to get it done.
Welcome
Oodle brings your metrics, logs, traces, and alerts together in one platform with AI built in from the ground up. Instead of switching between tools, you can ask questions in plain English, get answers backed by real data, and let AI handle the investigation grunt work.
This guide walks you through the features that will make the biggest difference on day one.
Select your region:
1. AI Canvas
Think of AI Canvas as a teammate who has access to all your observability data and never sleeps. Ask it anything about your infrastructure in plain English and it will query your metrics, search your logs, check your alerts, and show you the results right in the conversation.
Open AI Canvas: us1.oodle.ai/ai-canvas
You can also open it from any page by clicking AI Assistant in the sidebar or pressing Cmd + I.
Try these prompts
Start with something relevant to your team:
Show errors in api-server service in the last hourShow me all firing alertsInvestigate why alert "CPU Over 80 Percent" is firingCreate a dashboard for api-server latency and error rateSummarize error logs from api-server for the last 30 minutes
As the AI works, you'll see live tool-call cards showing exactly what it's doing - running PromQL queries, scanning logs, checking alert history. Charts, tables, and results appear inline so you don't have to go anywhere else.
Docs: AI Canvas
2. MCP Integration
Everything AI Canvas can do is also available from your coding agent through the Model Context Protocol (MCP). Connect Claude Code, Cursor, Codex, or any MCP-compatible client and you get the same observability superpowers directly in your editor.
Why is this a big deal? Your coding agent already has your code. Now give it your production data too. When something breaks, you can ask your agent to check the logs, pull up the relevant metrics, and suggest a fix - all in one conversation.
Oodle's MCP tools go beyond raw queries. They include higher-level insights that Oodle builds by correlating across your telemetry - things like anomaly detection, noisy alert identification, and cross-signal investigation.
Get connected in 2 minutes
Setup page: us1.oodle.ai/settings?category=mcp
You can connect with an API key or OAuth. The setup page gives you the exact command for your client - just copy and paste.
Claude Code:
claude mcp add --transport http oodle-ai \
  https://REGION.oodle.ai/v1/api/instance/YOUR_INSTANCE/mcp \
  --header "X-API-KEY: YOUR_API_KEY"
Cursor: Add the MCP server URL and API key in Cursor's MCP settings.
Codex: Add Oodle as an MCP server in your Codex configuration. See the Codex integration guide for details.
Prefer the CLI?
If you like working from the terminal, install Oodle's CLI and point your AI agents at it instead.
Installation: us1.oodle.ai/settings?search=cli&integration=OODLE_CLI
Docs: MCP Integration · Claude Code · Cursor · Codex
3. Alerts
Oodle's alerting system continuously evaluates PromQL queries against your metrics and notifies you when things go wrong.
View all alerts: us1.oodle.ai/alerts
Already have alerts?
The alerts page lists all your monitors on the left. Click any monitor to see its query, threshold conditions, which series are currently firing, and a history of past incidents.
Pick a past alert instance from the Recent Activity panel and try one of the three AI actions:
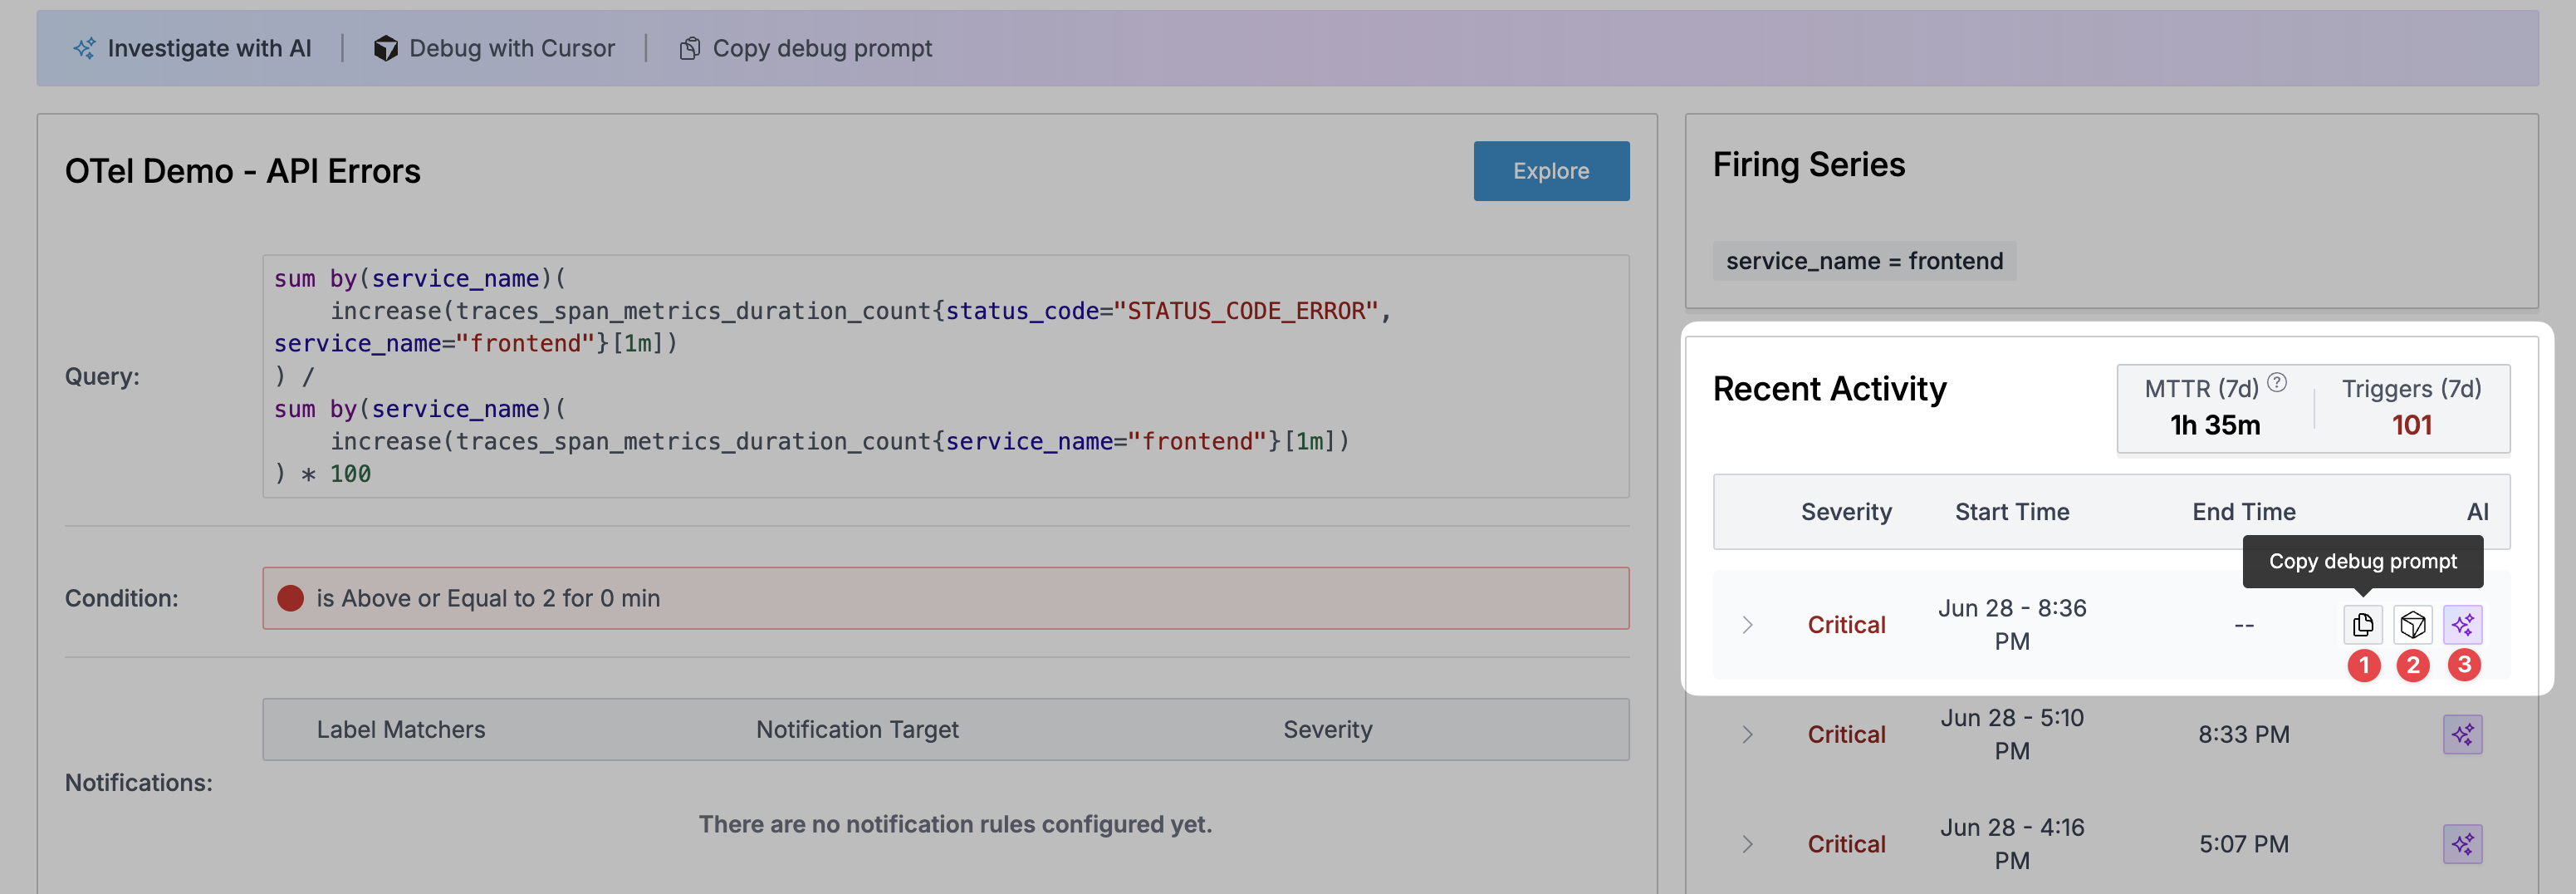
| # | Button | What it does |
|---|---|---|
| 1 | Copy debug prompt | Copies a ready-made investigation prompt to your clipboard. Paste it into your coding agent (Claude Code, Cursor, Codex, etc.) and it will pull all the alert context via MCP and start investigating. |
| 2 | Debug with Cursor | Opens a Cursor chat with the alert context already loaded - one click to start debugging. |
| 3 | Investigate with AI | Hands the alert to Oodle's AI agent, which investigates and reports back with findings directly in the platform. |
Starting fresh? Create alerts with AI
If you don't have alerts set up yet, the fastest way to get started is to ask the AI Assistant to create them for you. Make sure you are ingesting the relevant metrics first (check the Integrations section), then go to us1.oodle.ai/alerts/create and open the AI Assistant sidebar to ask:
Create an alert to notify me when container memory usage is above 90%Create an alert for high CPU usage on api-serverAlert me when the error rate on api-server exceeds 5%Create an alert for container restarts in the last 10 minutes
The AI builds the PromQL query, sets the threshold, and saves the monitor. You can review and adjust it from the alerts page afterwards.
Want to alert on log patterns? Oodle monitors run on metrics, but you can turn any log query into a metric using LogMetrics. Define a filter (e.g., logs containing status:500), and Oodle will emit a metric you can use in any monitor. Set it up at us1.oodle.ai/logmetrics.
For a step-by-step walkthrough of creating alerts manually, see the Monitors documentation.
Key concepts
- Monitors - A PromQL query paired with Warning and Critical thresholds. Oodle evaluates it on a schedule and fires alerts when conditions are met.
- Notifiers - Where alerts get sent: Slack, PagerDuty, Opsgenie, Google Chat, Microsoft Teams, or webhooks.
- Notification Policies - Rules that route alerts to different notifiers based on severity and labels.
- Composite Monitors - Combine multiple monitors with AND/OR logic for complex conditions.
Docs: Alerts · Monitors · Notifiers · Alert Migrations
4. AI Skills
Every team has tribal knowledge - the debugging steps that live in someone's head or buried in a wiki. Skills turn that knowledge into something Oodle's AI can actually use.
A skill is simple: a name, a description of when to use it, and steps written in plain language (like an AGENTS.md file). When a relevant question comes up in AI Canvas or through MCP, Oodle automatically detects and follows the right skill.
Oodle also creates runbooks automatically by learning from how your team investigates incidents. When an alert is debugged, Oodle captures the investigation workflow and generates a runbook so future instances of that alert can be handled the same way. You can review, edit, or disable auto-generated runbooks at any time.
Create your first skill
- Go to AI Center > Skills in the sidebar.
- Click + New Skill.
- Write a clear description of when the AI should use it (e.g., "Use when the user asks whether an issue affects one customer or multiple customers").
- Add the investigation steps - what to check, what queries to run, what format to report in.
- Save and it's live immediately.
Where do skills come from?
| Source | Description |
|---|---|
| User | Skills your team writes manually. |
| Auto-learned | Skills Oodle generates from observed patterns and past investigations. Review, edit, or disable them anytime. |
Skills are also exposed via MCP, so any AI agent connected to Oodle - Claude Code, Cursor, Codex, or your own tools - can discover and use them.
Docs: Skills & Runbooks
5. Integrations
The Integrations page is your control panel for connecting data sources and tools to Oodle:
- Logs - Kubernetes, Fluentbit, Vector, OpenTelemetry, CloudWatch, and more.
- Metrics - GCP, Prometheus, Datadog, Kubernetes, and more.
- Traces - OpenTelemetry.
- AI Cost Management - Track cost and usage of your coding agents.
- Agent Observability - Monitor your AI models' performance, latency, and cost.
- Real User Monitoring - Capture frontend performance from real users.
Integrations page: us1.oodle.ai/settings
API keys and permissions
Check the API keys page to see what permissions your integration needs. If you need a higher access level, reach out to your administrator.
Docs: Integrations · GCP · Datadog · Grafana Import
6. Metrics, Logs, Traces & RUM
Metrics
Oodle uses Grafana's familiar query and dashboard UI for metrics. If you've used Grafana before, you'll feel right at home - same PromQL queries, same panel types, same dashboard variables. Your imported Grafana dashboards are ready to use under the Dashboards section in the sidebar.
Metrics Explore is where you go for ad-hoc investigation. Pick a metric, add filters, and visualize the result.
Don't want to learn PromQL? No worries. Open the AI Assistant sidebar from the Explore page and describe what you want in plain English - e.g., "Write a promql to get the total errors in api-server". The AI writes the query for you.
Metrics page: us1.oodle.ai/metrics/explore
Docs: Metrics Explore · PromQL Reference · Dashboards
Logs
The log explorer uses an OpenSearch-based UI. Search, filter by fields, set time ranges, and run aggregations to spot patterns in your log data.
Logs page: us1.oodle.ai/logs
Docs: Log Explorer
Traces
Oodle has its own purpose-built tracing UI. Search traces by service, operation, duration, or tags. Dive into trace timelines, view service graphs, and pinpoint latency bottlenecks.
Traces page: us1.oodle.ai/traces
Docs: Traces · Trace Explorer
Real User Monitoring (RUM)
See your application through your users' eyes. RUM captures page load times, web vitals, session replays, and frontend errors from real browser sessions.
RUM page: us1.oodle.ai/rum
Docs: Real User Monitoring
Why Oodle is different
All of these UIs sit on top of Oodle's novel storage architecture. Your telemetry data is stored on S3 with Lambdas handling the compute - a fundamentally different approach from traditional observability platforms.
Interested in the engineering behind it? Read about our technology.
Support
If you need assistance or have any questions, please reach out to us through:
- Email at [email protected]