Database Hosts
The Hosts tab provides a host-level view of your monitored database instances, showing key performance and resource utilization metrics.
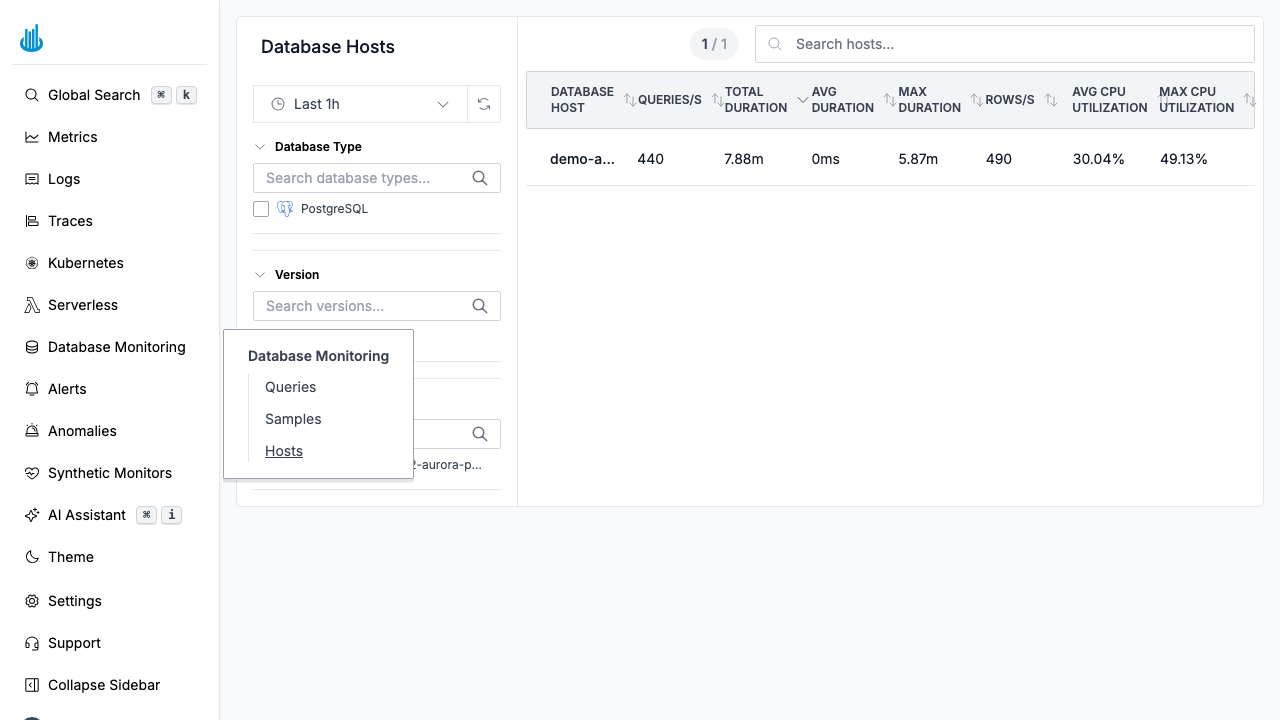
Hosts Table
| Column | Description |
|---|---|
| Database Host | Instance hostname or endpoint |
| Queries/s | Average queries per second |
| Total Duration | Cumulative query execution time |
| Avg Duration | Mean query execution time |
| Max Duration | Longest single query execution |
| Rows/s | Rows processed per second |
| Avg CPU Utilization | Average CPU usage percentage |
| Max CPU Utilization | Peak CPU usage percentage |
Filters
The left-hand panel provides:
- Database Type — Filter by engine (PostgreSQL, MySQL). Each type is shown with its logo icon.
- Version — Filter by database version.
- Database Identifier — Search by DB instance identifier.
Click to Drill Down
Click a host row to open a detail drawer with:
- Overview metrics — CPU utilization, active connections, queries per second, and replication lag over time.
- Databases table — Lists each database on the host with its size, active connections, commits, rollbacks, and conflict count.
- Replication metrics — Write lag, flush lag, replay lag, and replication slot delay (when applicable).
Use Cases
- Capacity planning — Identify hosts approaching CPU or connection limits.
- Performance debugging — Correlate host-level resource spikes with query duration increases.
- Fleet management — Compare performance across database instances to find outliers.
Related Pages
- Database Queries — Aggregated query performance metrics.
- Database Samples — View individual query execution events.
Support
If you need assistance or have any questions, please reach out to us through:
- Email at [email protected]