Visualizations
Visualizations are the building blocks of dashboards. They transform your log data into charts, graphs, and other visual formats to identify trends, track metrics, and analyze patterns.
You can create visualizations directly from the Visualize section, or create them while building a dashboard by selecting Create new when adding a panel.
Explore working examples in the Oodle Playground to see visualizations in action.
Getting Started
To create a new visualization:
- Navigate to the Visualize section from the sidebar
- Click Create visualization
- Select a visualization type
- Choose your index pattern (your log data source)
- Configure metrics and buckets
- Save your visualization
Core Concepts
Metrics
Metrics determine what you're measuring. Common metric types include:
| Metric | Description | Example Use Case |
|---|---|---|
| Count | Number of documents matching the query | Total logs per minute |
| Sum | Total of a numeric field | Total bytes transferred |
| Average | Mean value of a numeric field | Average response time |
| Min/Max | Minimum or maximum value | Peak memory usage |
| Unique Count | Distinct values of a field | Number of unique users |
Buckets
Buckets determine how your data is grouped. Common bucket types include:
| Bucket | Description | Example Use Case |
|---|---|---|
| Date Histogram | Groups data by time intervals | Logs per hour |
| Terms | Groups by field values | Logs per service |
| Filters | Groups by custom queries | Error vs Success logs |
| Range | Groups numeric values into ranges | Response time buckets |
| Histogram | Groups by numeric intervals | Request size distribution |
Visualization Editor
The visualization editor lets you build charts by configuring filters, time ranges, and aggregations.
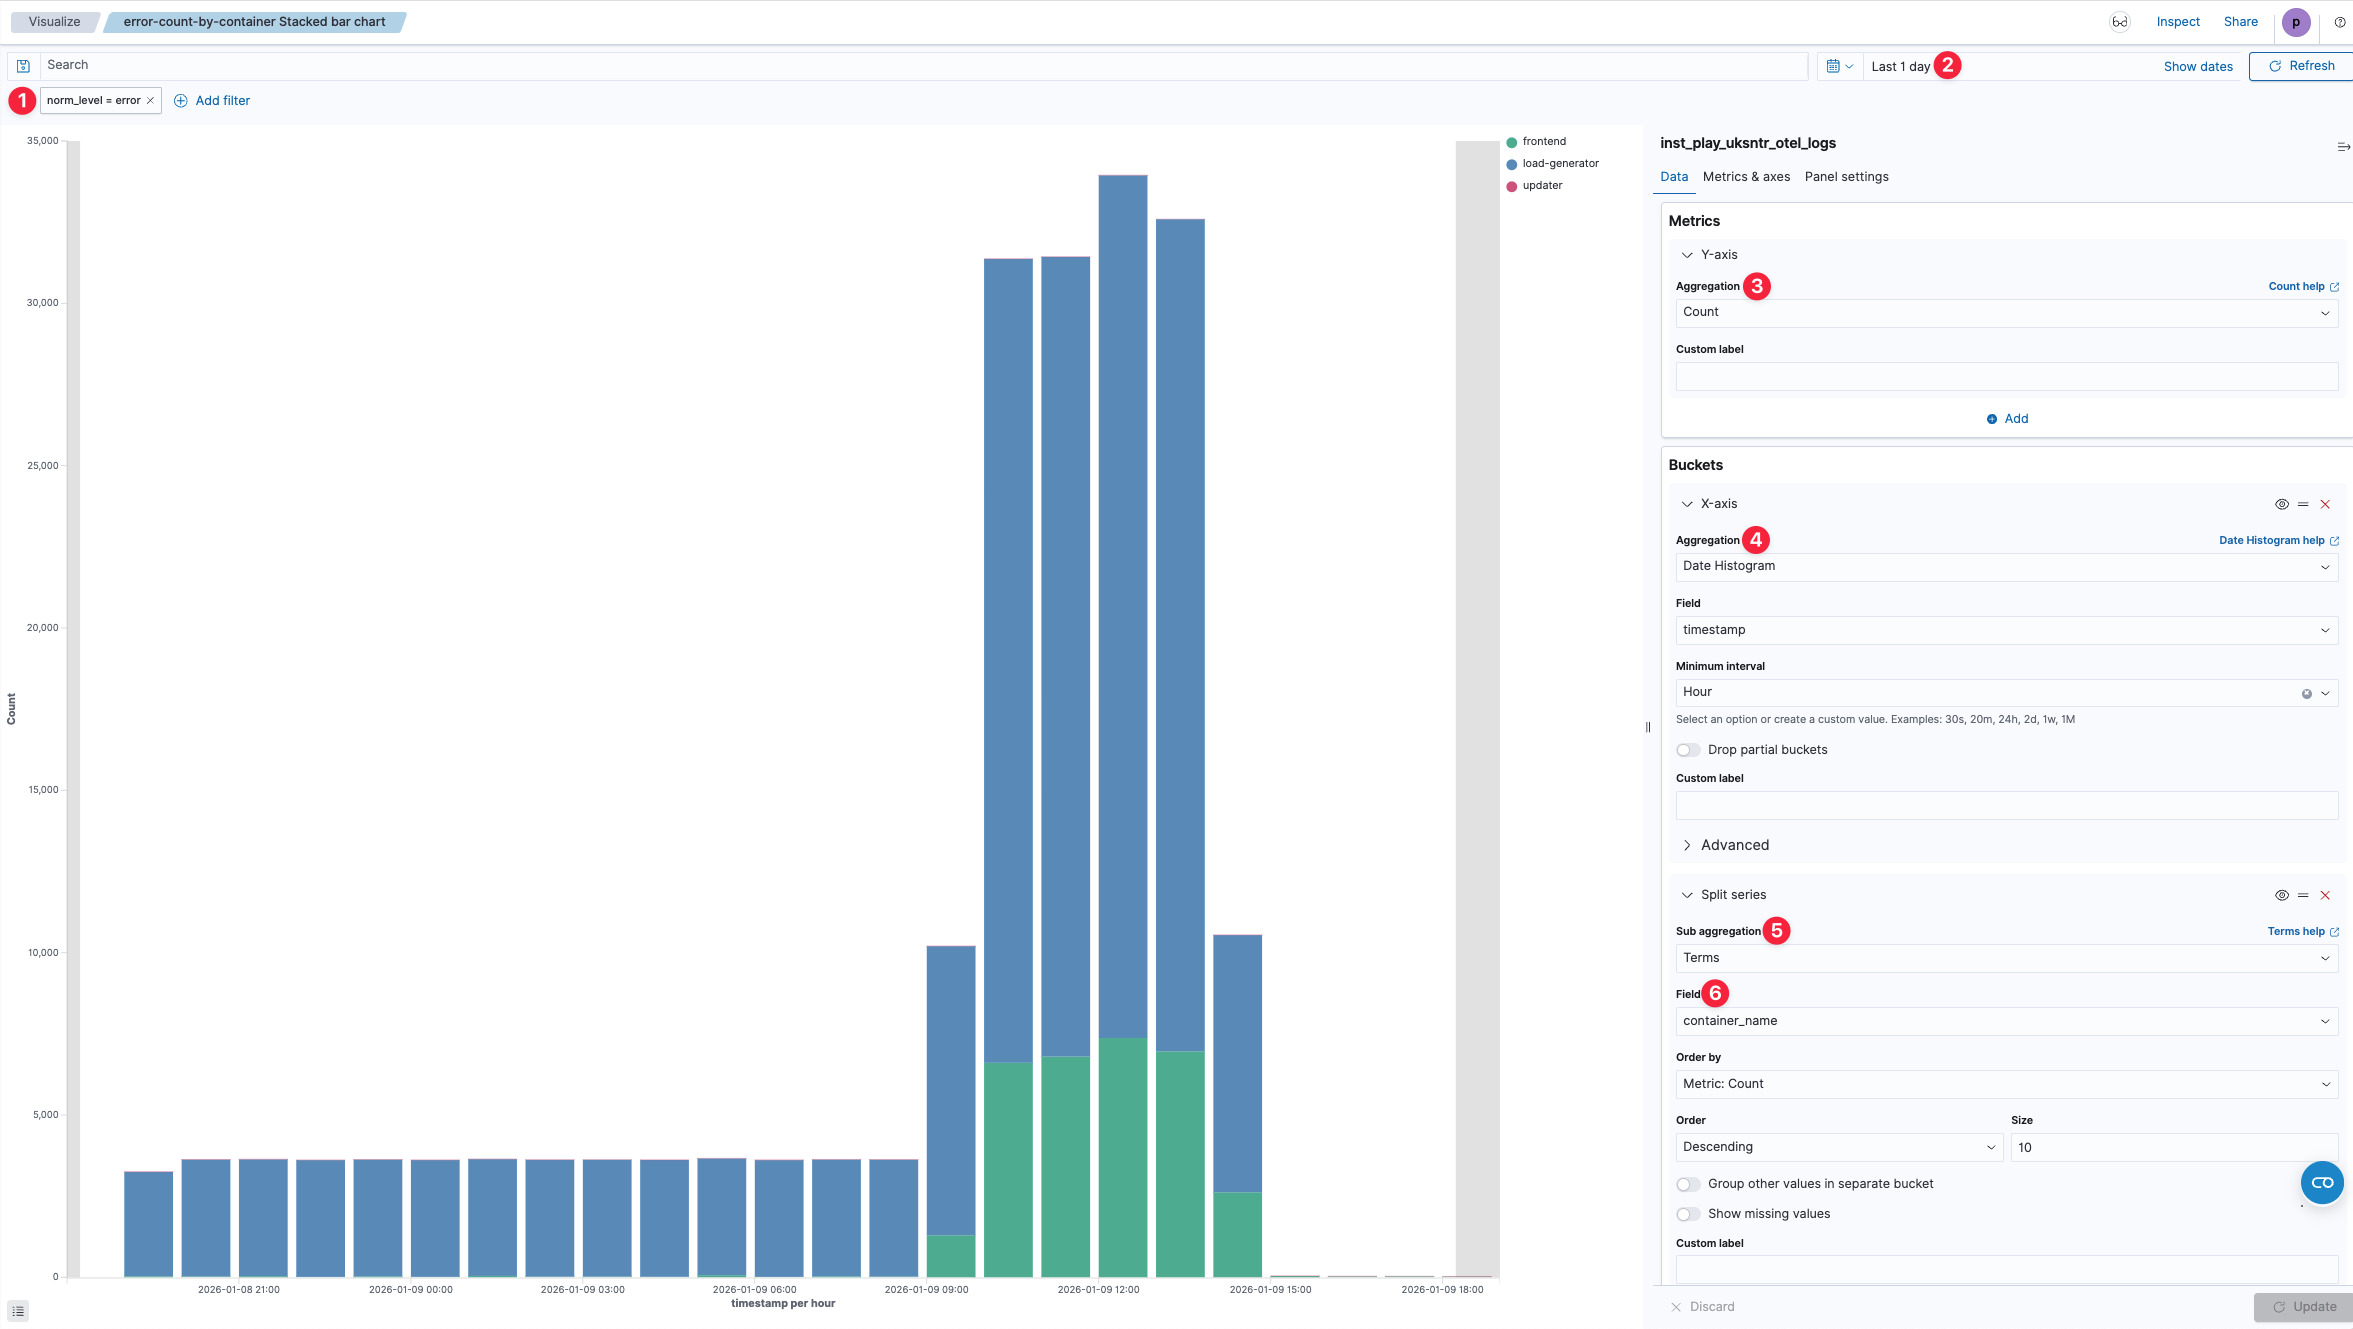
| # | Component | Description |
|---|---|---|
| 1 | Filter | Filter logs to include only data relevant to your visualization. Add multiple filters to narrow down results. |
| 2 | Time Range | Set the time window for your data. Use quick selections like "Last 1 day" or define custom ranges. |
| 3 | Metrics (Y-Axis) | Choose the aggregation for your Y-axis values. Options include Count, Sum, Average, Min, Max, and more. Scroll to see all available aggregations. |
| 4 | Buckets (X-Axis) | Define how data is grouped on the X-axis. Use Date Histogram for time-based charts or Terms for categorical grouping. |
| 5 | Split Series | Add a sub-aggregation to break down data into multiple series. Select Terms to split by field values. |
| 6 | Sub-aggregation Field | Choose the field to split your series by (e.g., container_name, log_level, service). |
Visualization Types
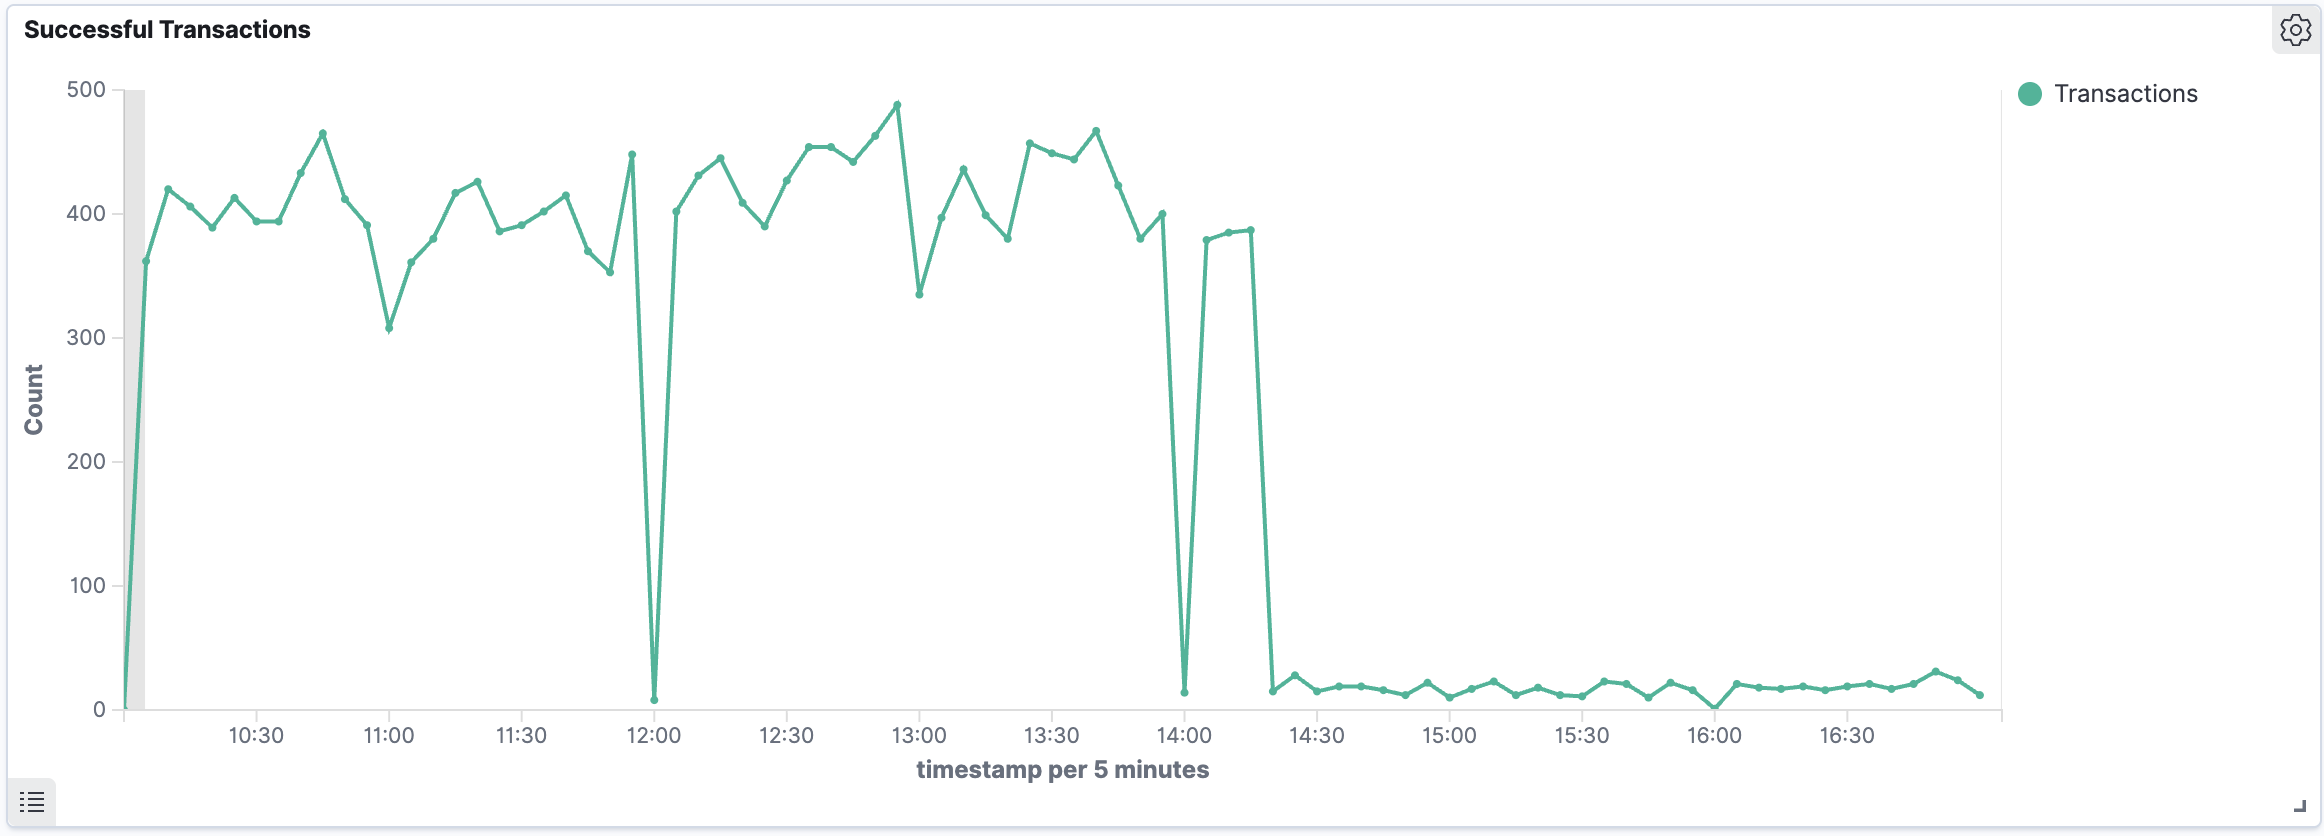
Line Chart
Line charts display data points connected over time, ideal for tracking trends and identifying patterns in time-series data.
Best for:
- Tracking metrics over time (transactions, requests, errors)
- Identifying trends and anomalies
- Comparing before/after changes
Configuration:
- Metric: Choose Count (or Sum/Average for numeric fields)
- X-Axis: Add a Date Histogram bucket on your timestamp field
- Split Series (optional): Add a Terms or Filters bucket to compare multiple series
Example: Successful Transactions Over Time
- Metric: Count
- X-Axis: Date Histogram on
timestampwith auto interval - Split Series: Filters with query
message:Transaction complete.
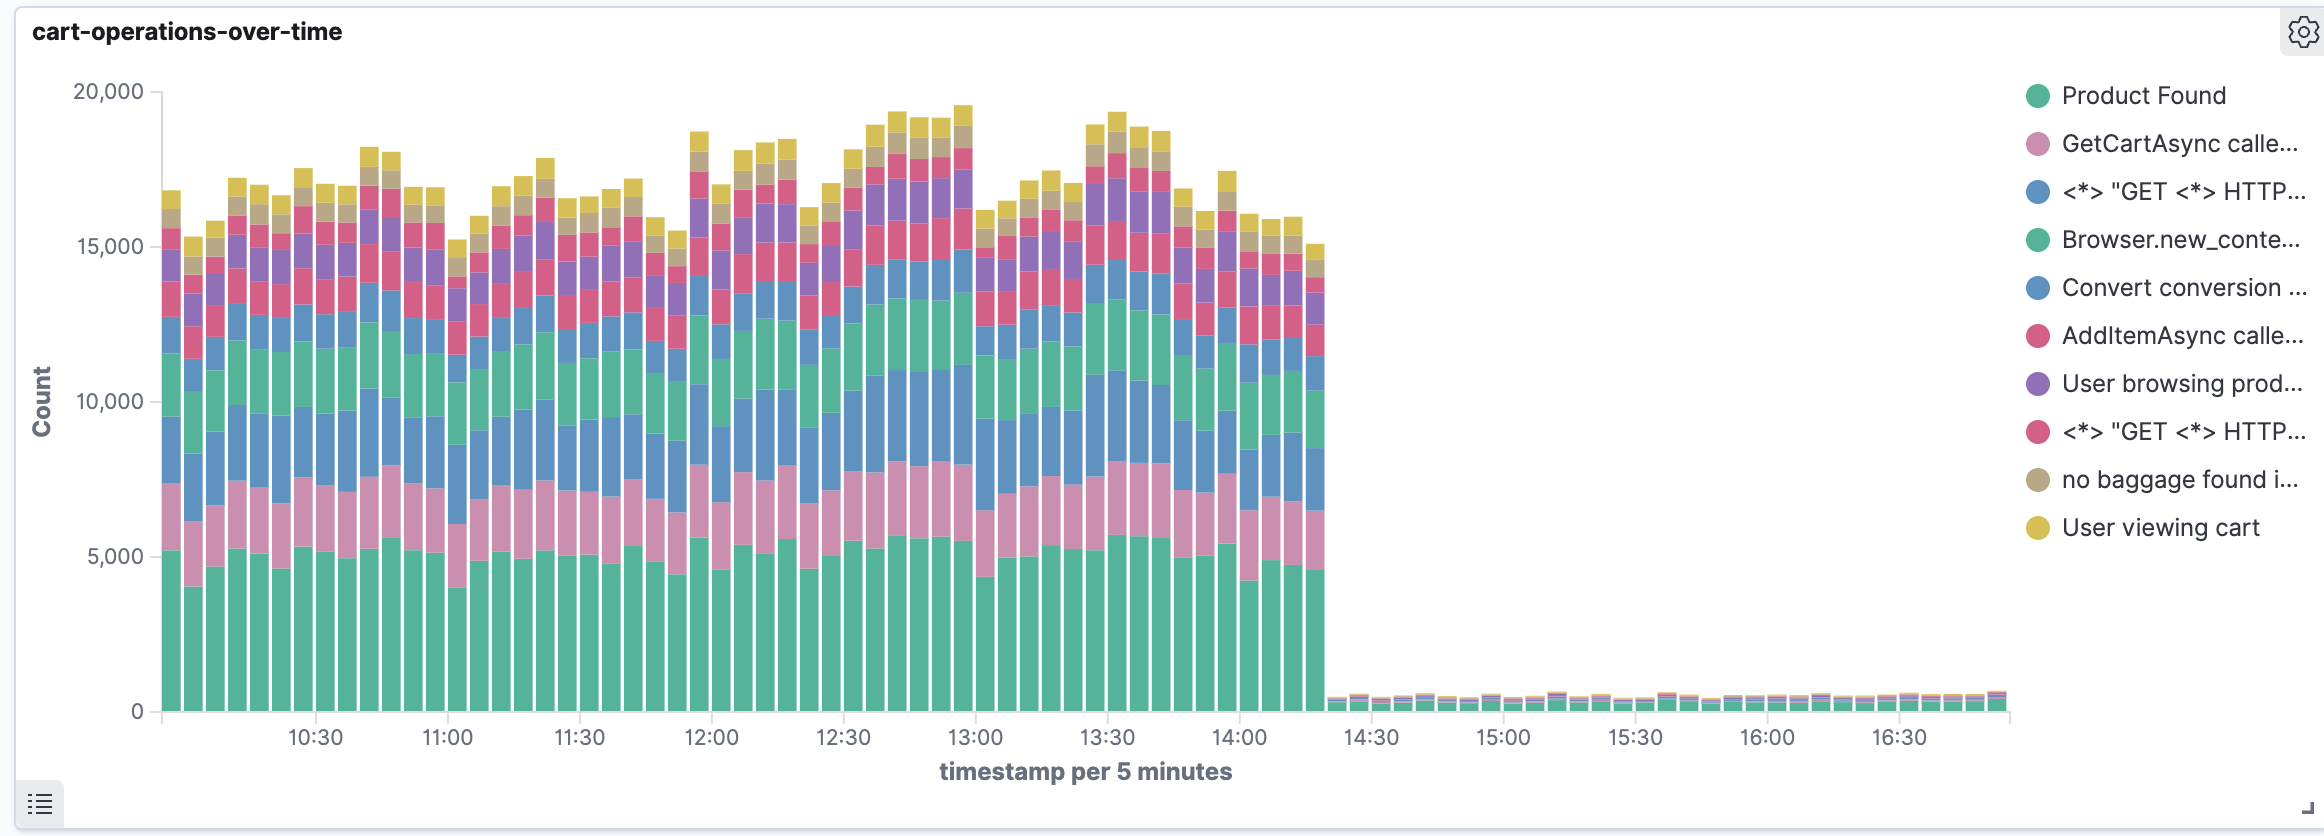
Bar Chart
Bar charts compare categorical data across groups or time periods. Stacked bars show the composition of each group.
Best for:
- Comparing volumes across categories
- Showing composition (stacked bars)
- Analyzing distribution by time with breakdowns
Configuration:
- Metric: Count or Sum
- X-Axis: Date Histogram for time-series, or Terms for categories
- Split Series: Terms bucket on a field (e.g.,
container_name,log_level) to stack by category
Example: Cart Operations Over Time
- Metric: Count
- X-Axis: Date Histogram on
timestamp(5-minute intervals) - Split Series: Terms on
fingerprint.keywordto see operation types
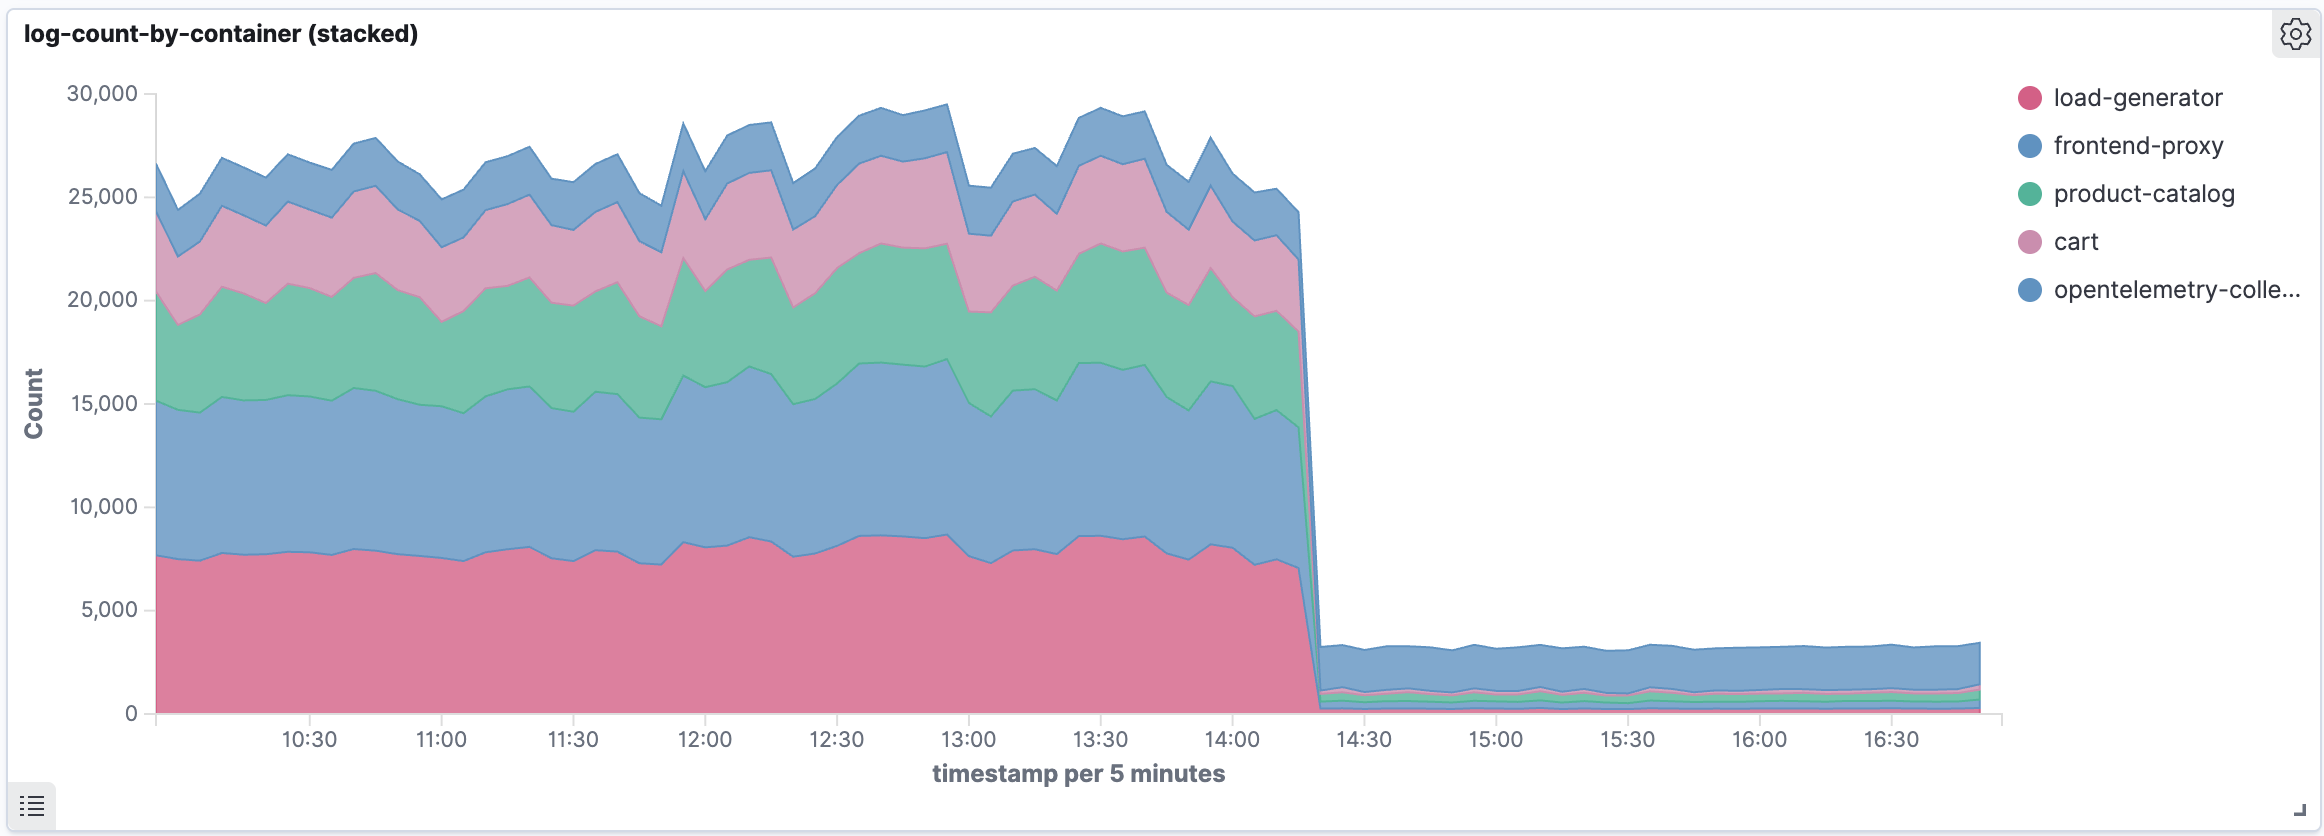
Area Chart
Area charts show magnitude over time with filled regions. Stacked area charts display how parts contribute to a whole.
Best for:
- Visualizing volume trends over time
- Showing proportional contributions from different sources
- Highlighting sudden changes in data volume
Configuration:
- Metric: Count
- X-Axis: Date Histogram on
timestamp - Split Series: Terms bucket on a categorical field
- In Metrics & axes, set Chart type to "Area" and enable "Stacked"
Example: Log Volume by Container
- Metric: Count
- X-Axis: Date Histogram on
timestamp(5-minute intervals) - Split Series: Terms on
container_name.keyword
Pie Chart
Pie and donut charts show proportional distribution of data across categories.
Best for:
- Showing relative proportions
- Distribution across a small number of categories (≤10)
- Understanding composition at a glance
Configuration:
- Metric: Count (or Sum for numeric values)
- Split Slices: Terms bucket on the field to segment by
- Optionally enable "Donut" mode in Options
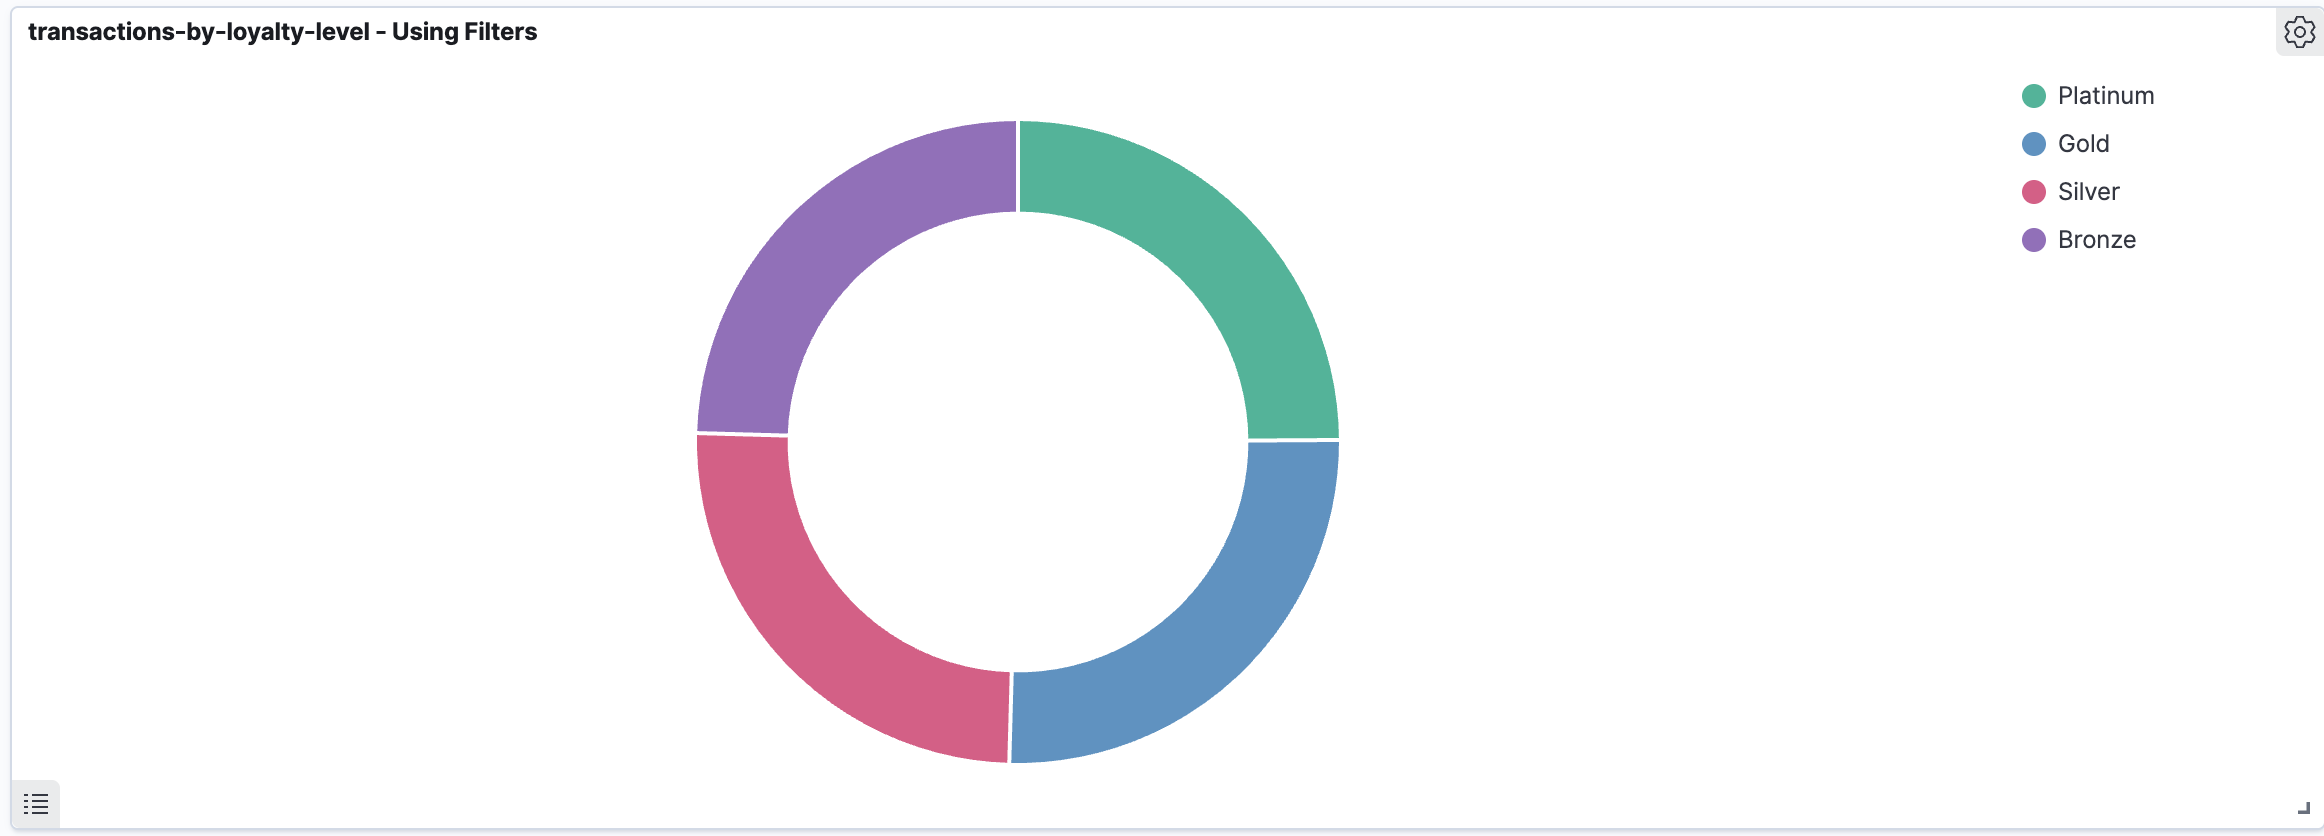
Example: Transactions by Customer Loyalty Level
- Metric: Count
- Split Slices: Filters bucket with queries for each level:
message:Platinum→ label "Platinum"message:Gold→ label "Gold"message:Silver→ label "Silver"message:Bronze→ label "Bronze"
Metric
Metric visualizations display a single prominent number, ideal for KPIs and summary statistics.
Best for:
- Displaying key performance indicators
- Showing totals or averages at a glance
- Dashboard summary panels
Configuration:
- Metric: Count, Sum, Average, or other aggregation
- Split Group (optional): Terms bucket to show multiple metrics side by side
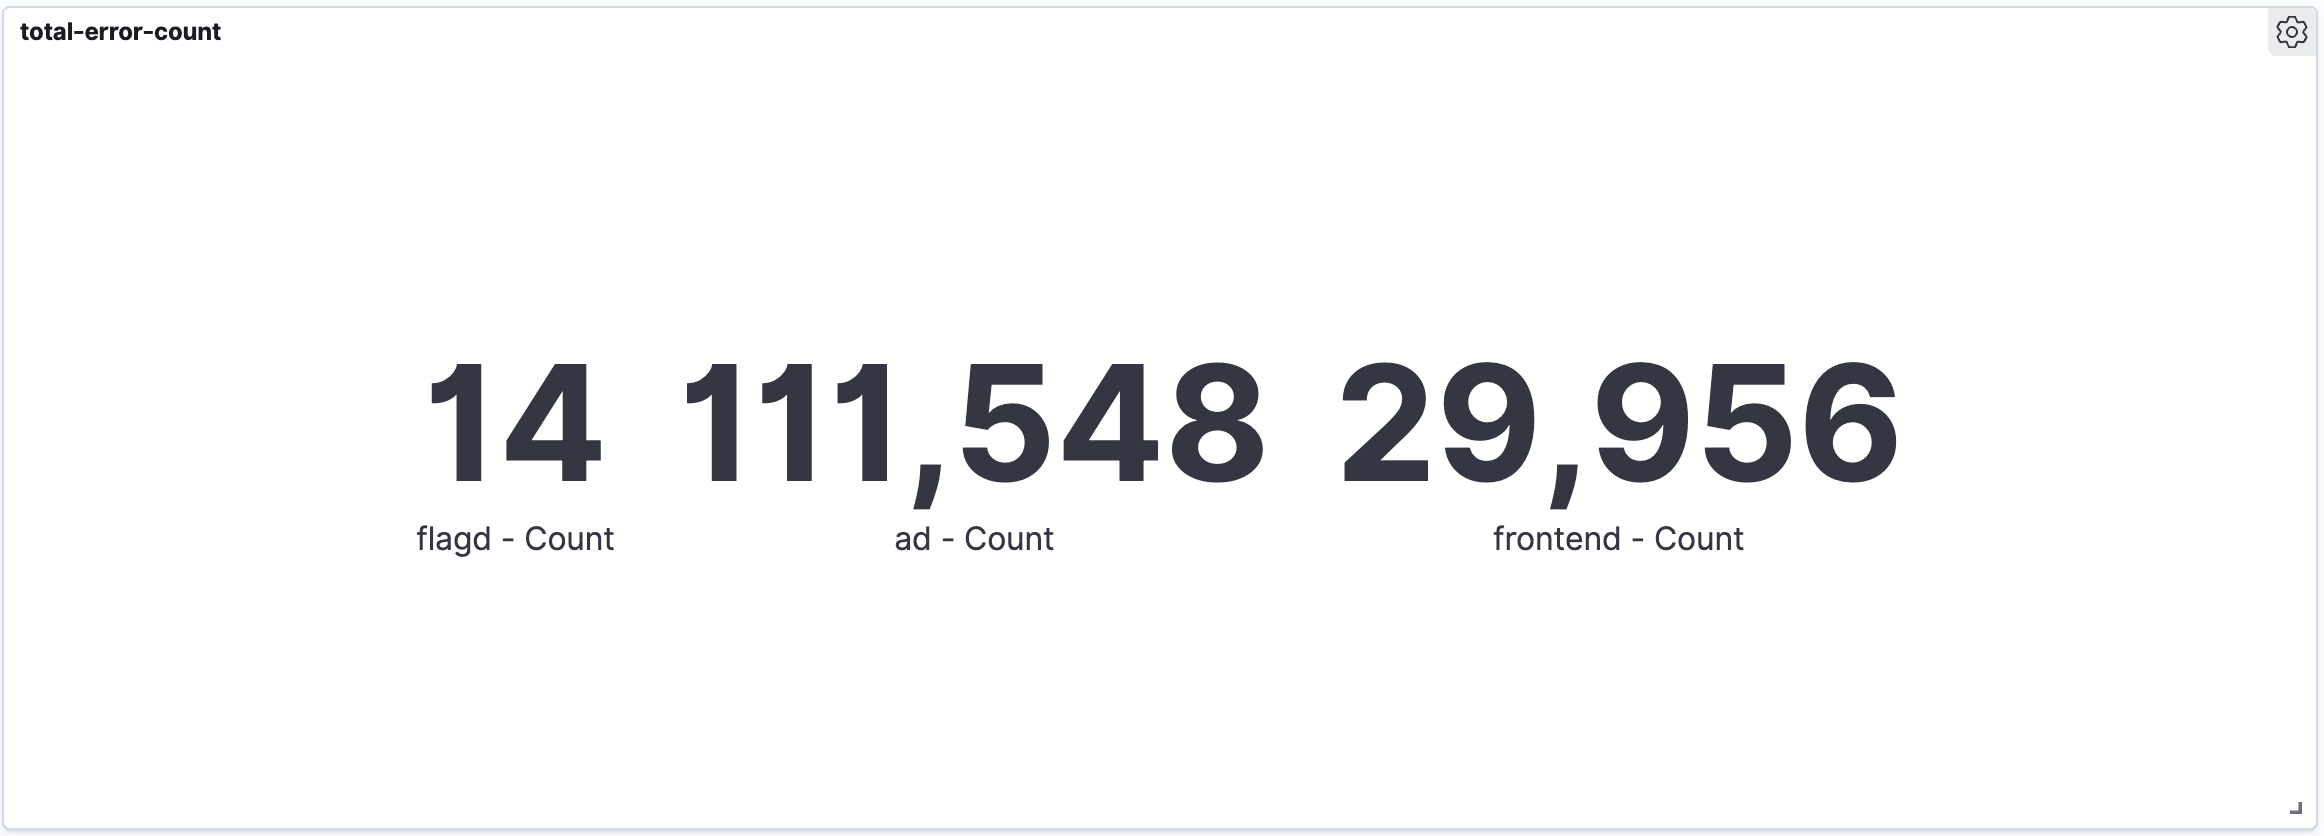
Example: Error Count by Service
- Metric: Count
- Query filter:
log_level:error OR level:ERROR - Split Group: Terms on
container_name.keyword(top 3-5)
Data Table
Data tables display aggregated data in tabular format, perfect for detailed breakdowns and exports.
Best for:
- Detailed data exploration
- Exporting aggregated data
- Showing exact counts and values
Configuration:
- Metric: Count (and additional metrics as needed)
- Split Rows: Terms bucket on the field to list
- Configure sort order (descending for "top N" lists)
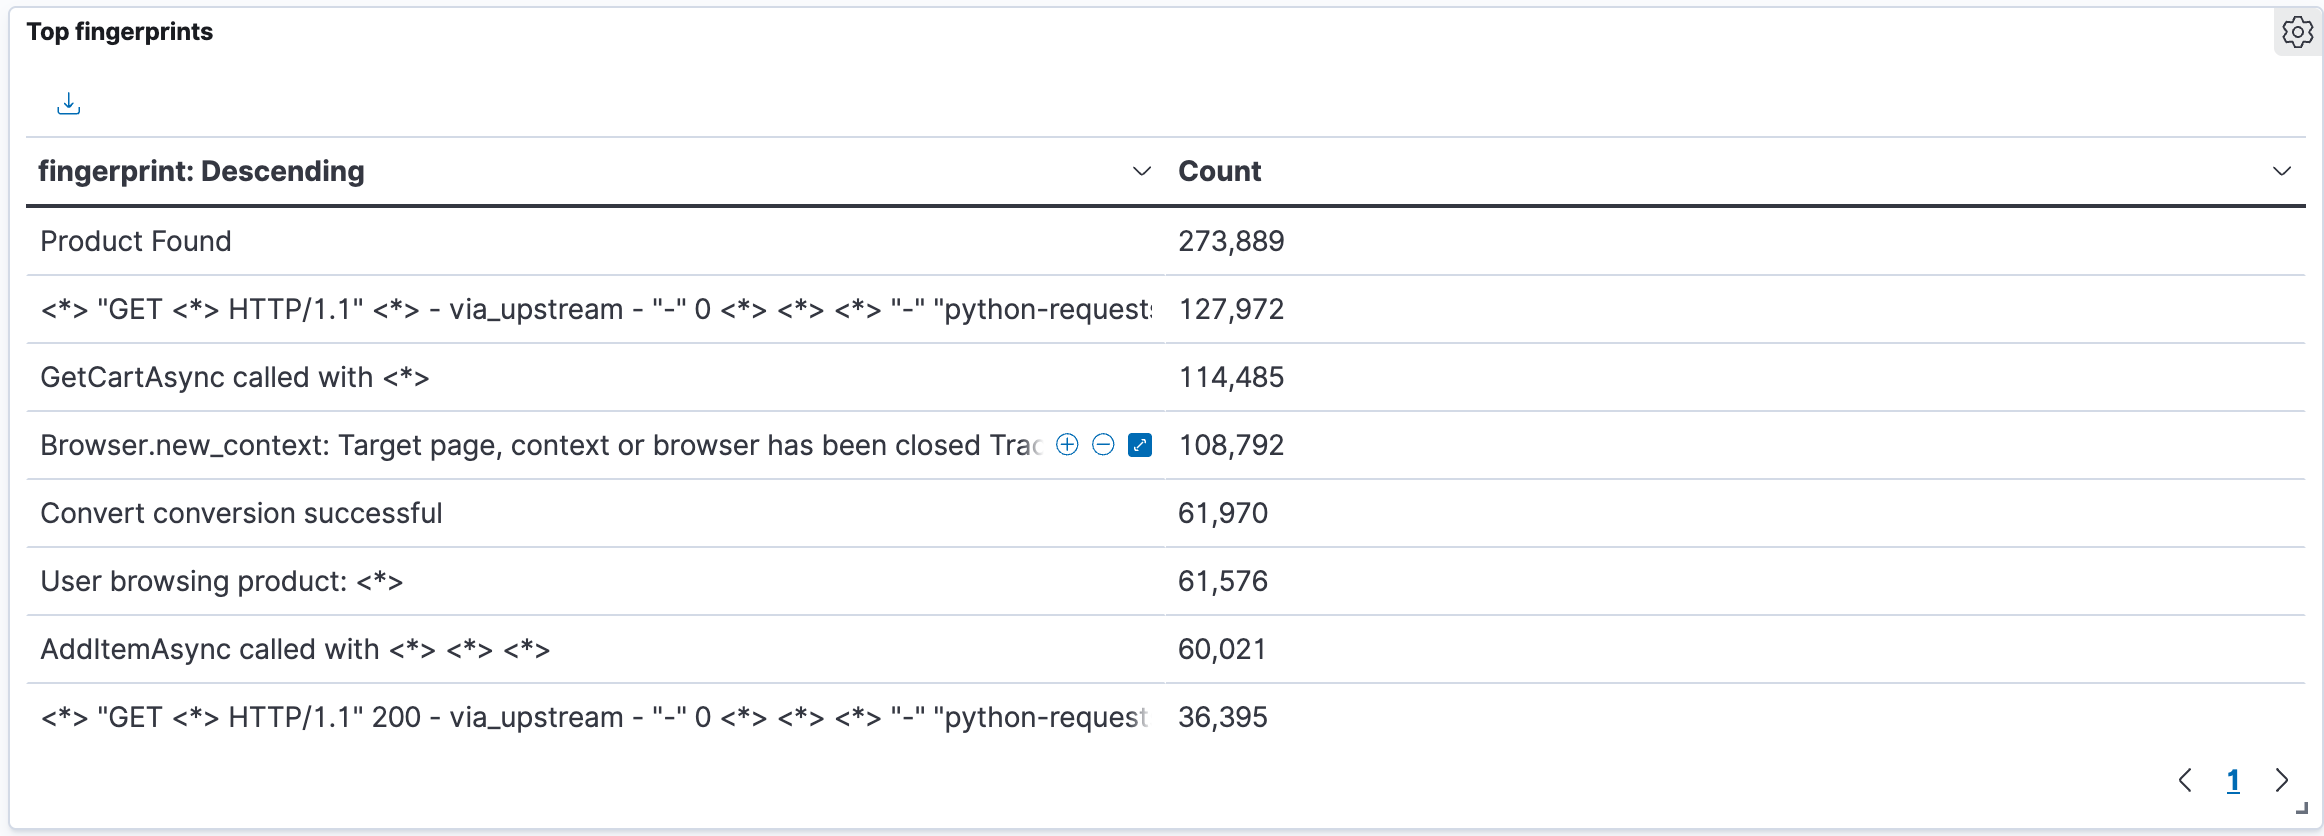
Example: Top Log Fingerprints
- Metric: Count
- Split Rows: Terms on
fingerprint.keywordwith size 10 - Sort by Count descending
Heat Map
Heat maps use color intensity to represent value magnitude across two dimensions, perfect for spotting patterns across time and categories.
Best for:
- Identifying activity patterns across time and categories
- Spotting outliers in multi-dimensional data
- Understanding when and where activity occurs
Configuration:
- Metric: Count (determines color intensity)
- X-Axis: Date Histogram on
timestamp - Y-Axis: Terms bucket on the categorical field
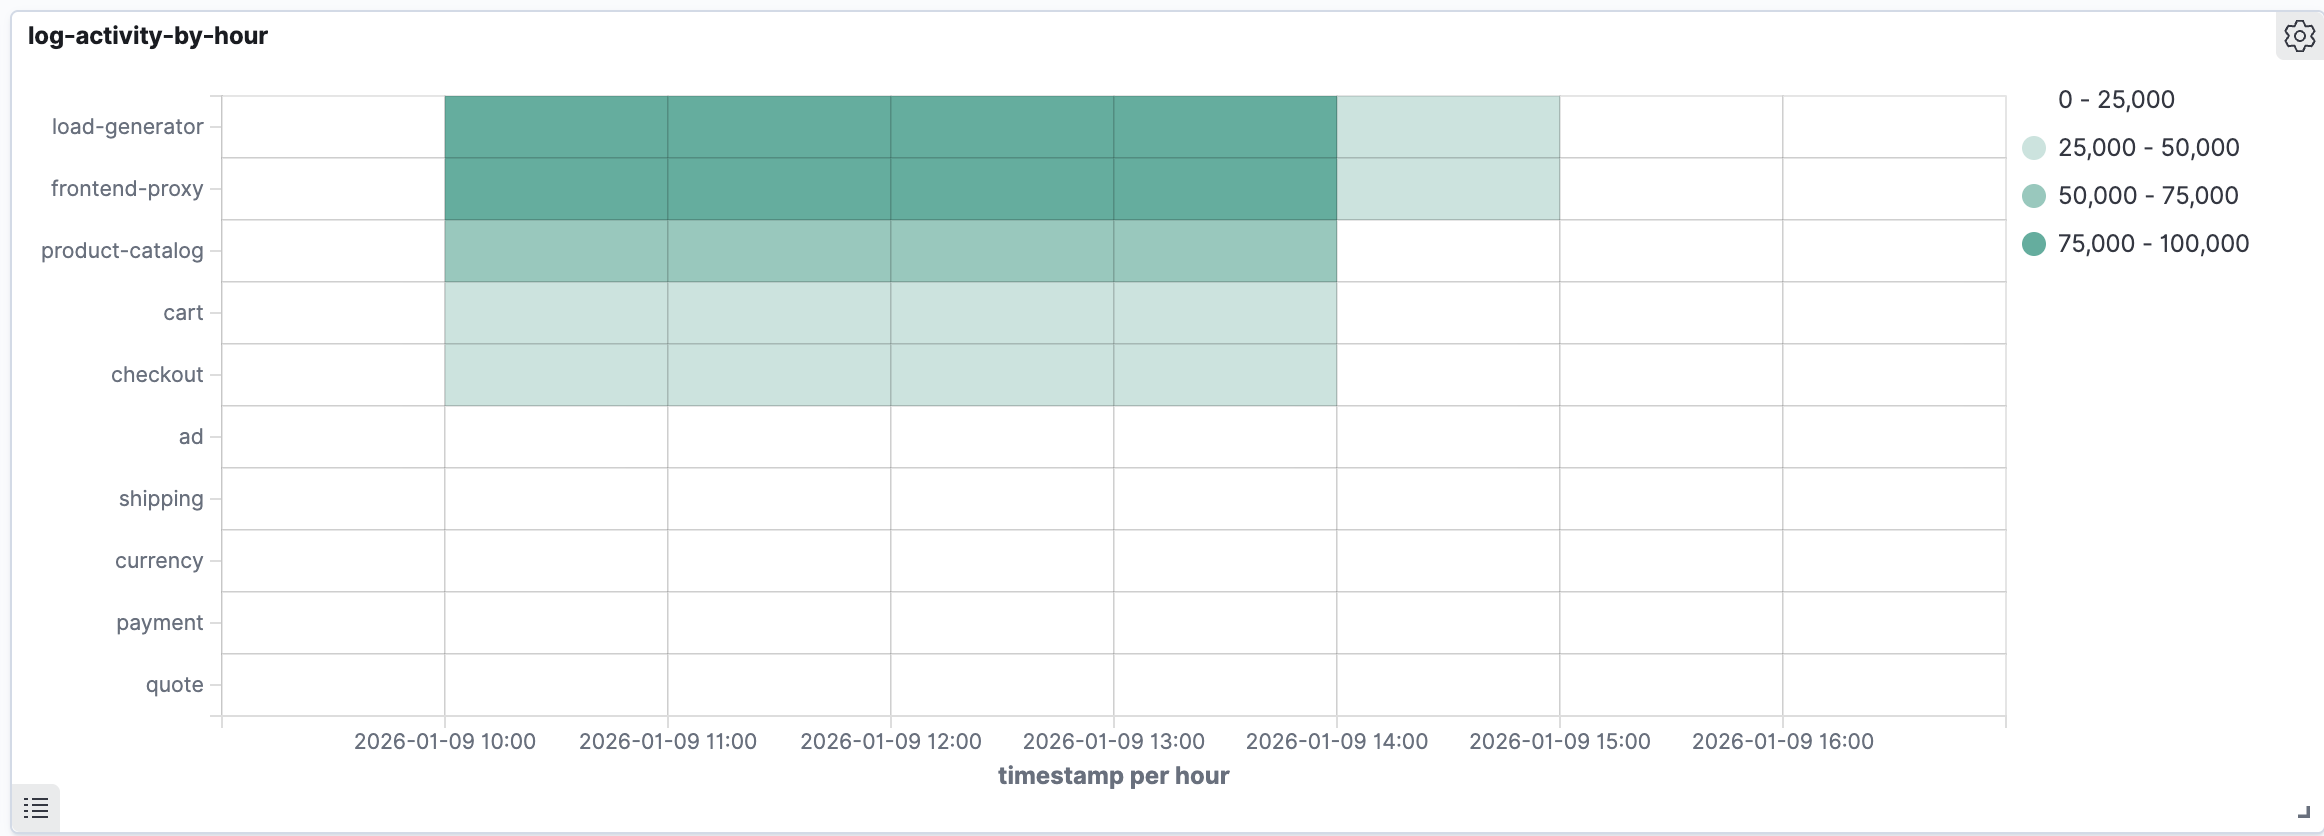
Example: Log Activity by Container Over Time
- Metric: Count
- X-Axis: Date Histogram on
timestamp(1-hour intervals) - Y-Axis: Terms on
container_name.keyword
Filtering Data
You can filter visualization data in several ways:
Query Bar
Enter Lucene or KQL queries to filter documents:
log_level:error AND container_name:frontend
Filters Aggregation
Use Filters as a bucket type to create labeled segments based on queries:
# Filter 1
Query: message:success
Label: Successful

# Filter 2
Query: message:failed OR message:error
Label: Failed
Time Filter
Use the time picker in the top navigation to adjust the time range for all visualizations.
Saving Visualizations
- Click Save in the top menu
- Enter a descriptive title
- Optionally add to an existing dashboard
- Click Save
Saved visualizations can be:
- Added to multiple dashboards
- Shared with team members
- Used as a template for similar visualizations
Next Steps
- Combine your visualizations into dashboards for comprehensive monitoring views
- Explore the logs interface for ad-hoc log analysis
Support
If you need assistance or have any questions, please reach out to us through:
- Email at [email protected]