
Prometheus

Oodle is a drop-in replacement for Prometheus when it comes to storing and querying metrics. It natively supports Prometheus remote write protocol and can be integrated easily with existing Prometheus-based infrastructure.

Remote Write Configuration

In the Oodle UI, navigate to Settings page and click on Connect in the Prometheus tile.

Prometheus Integration

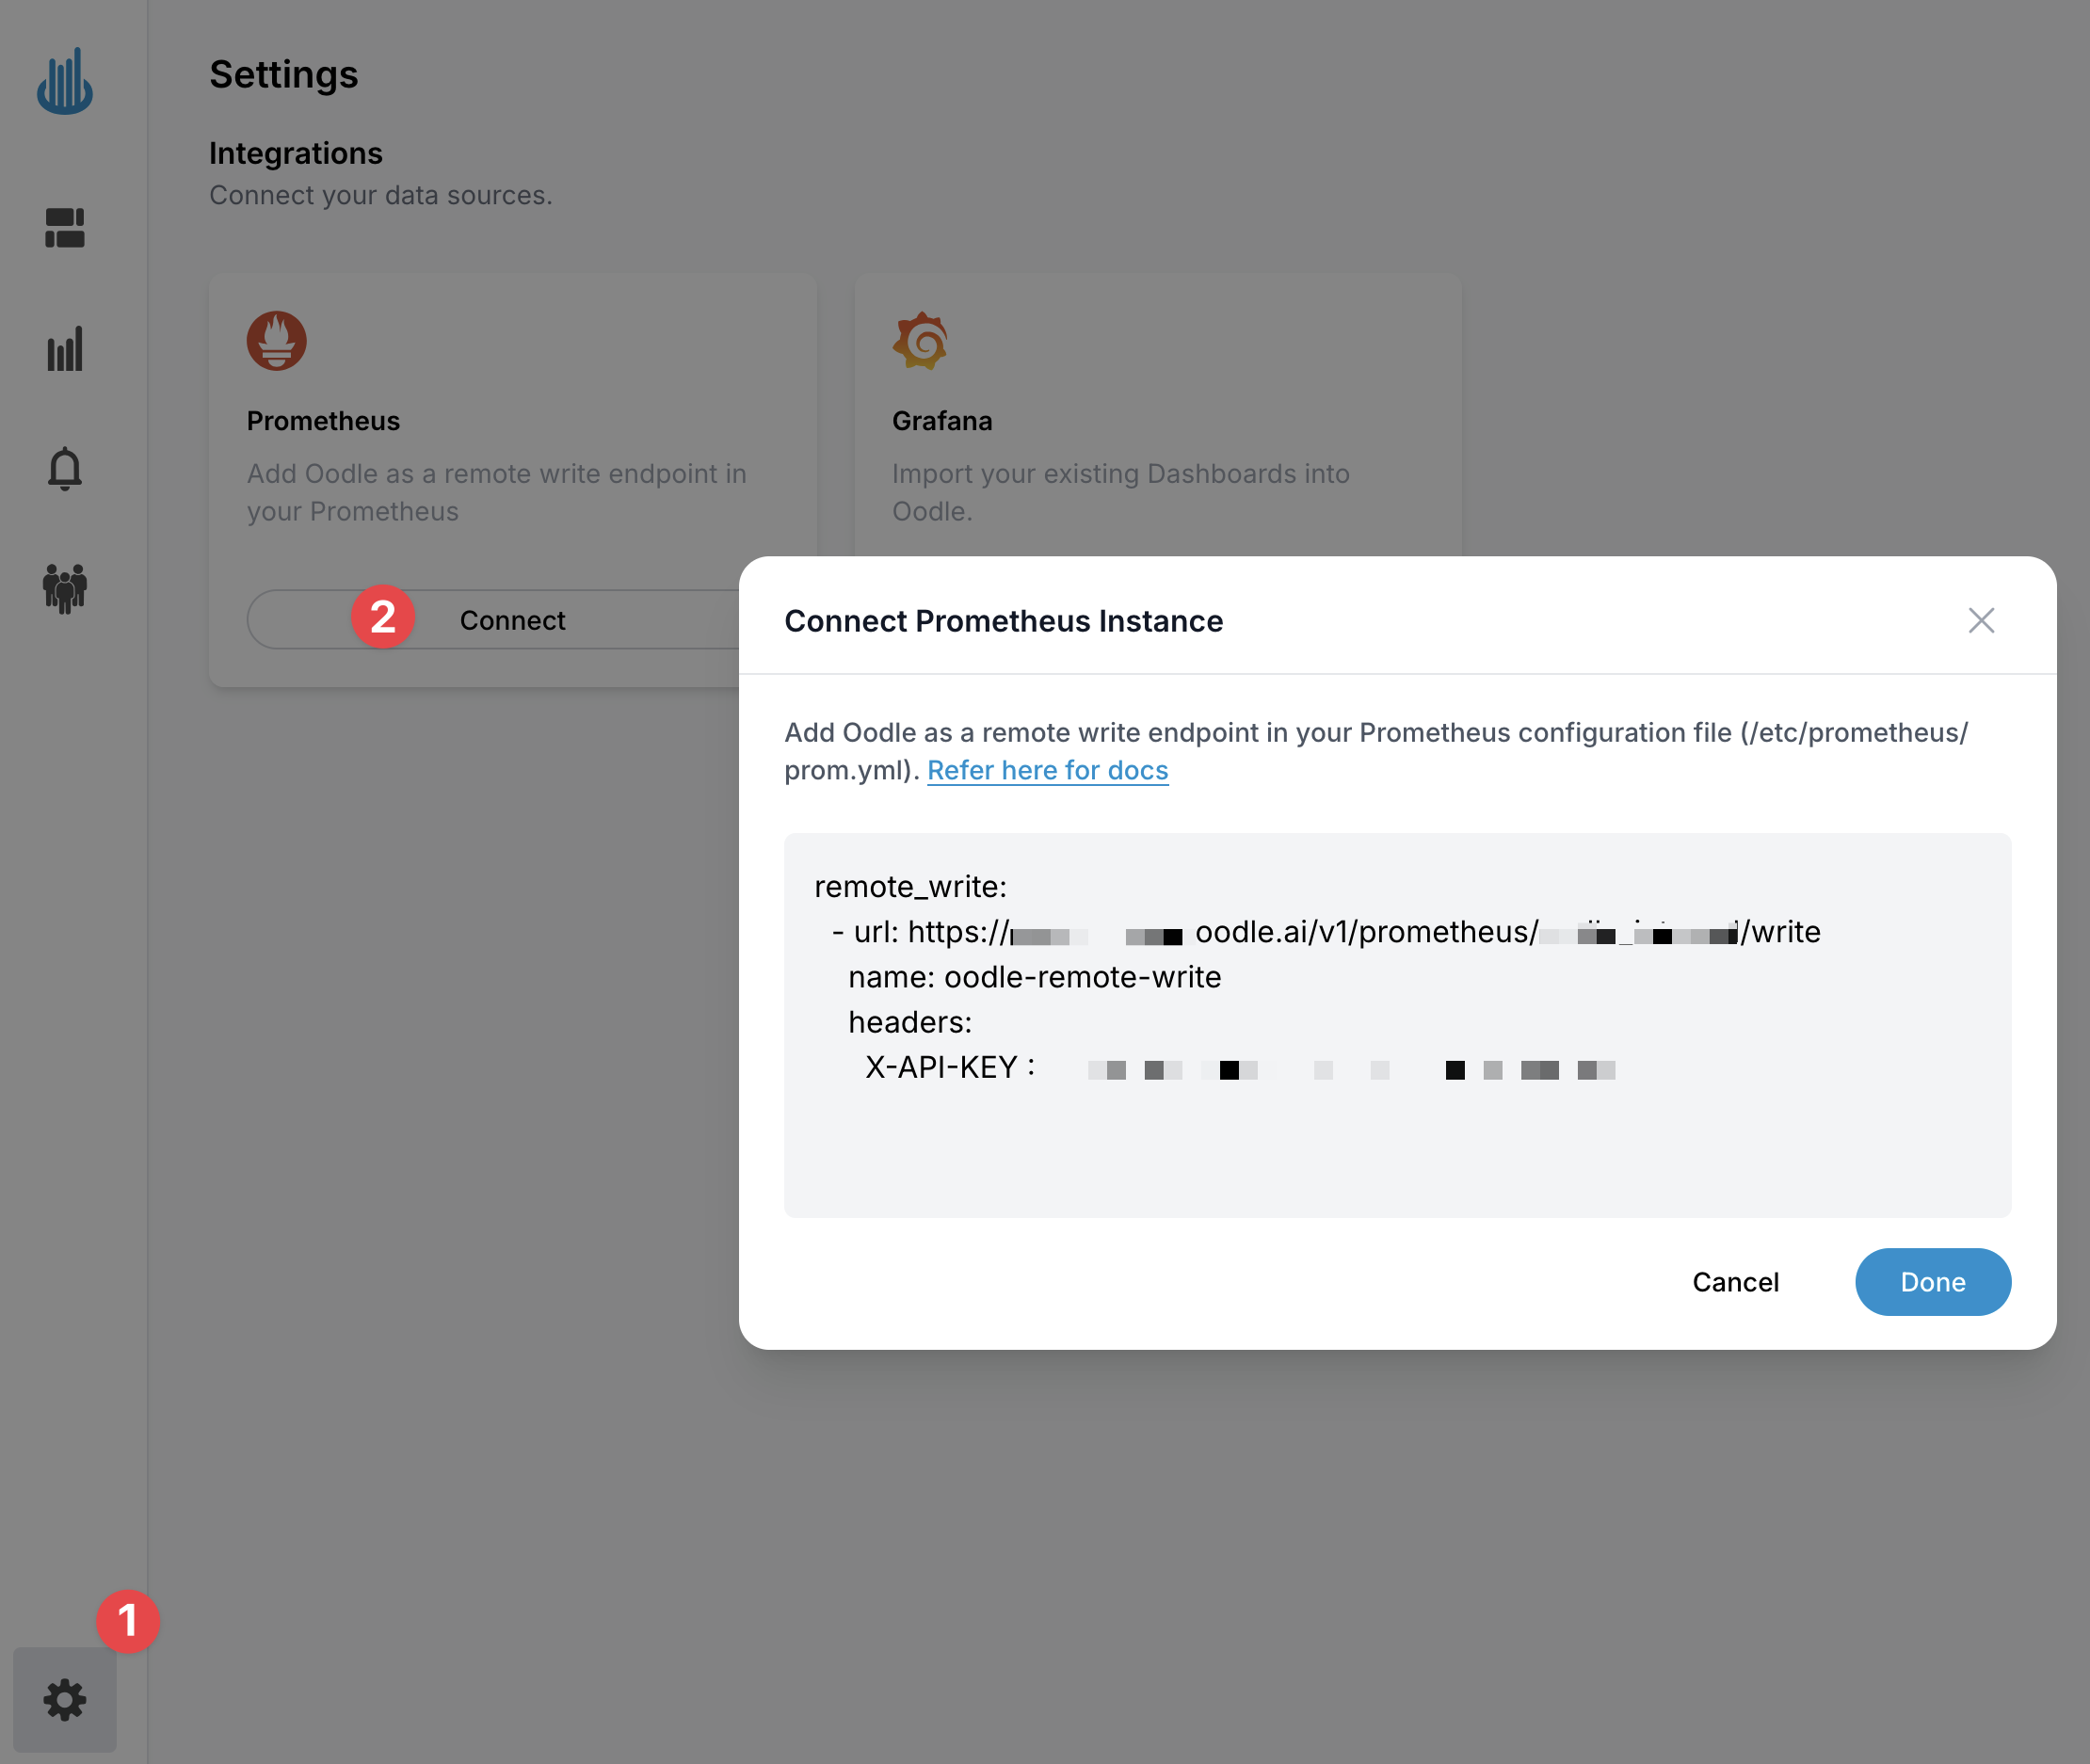
It provides you with the remote_write configuration that you can use in your Prometheus configuration which will be pre-populated with the values specific to your Oodle instance.

prometheus.yml
remote_write:
- url: https://<OODLE_ENDPOINT>/v1/prometheus/<INSTANCE_ID>/write
name: oodle-remote-write
headers:
X-API-KEY: <API_KEY>

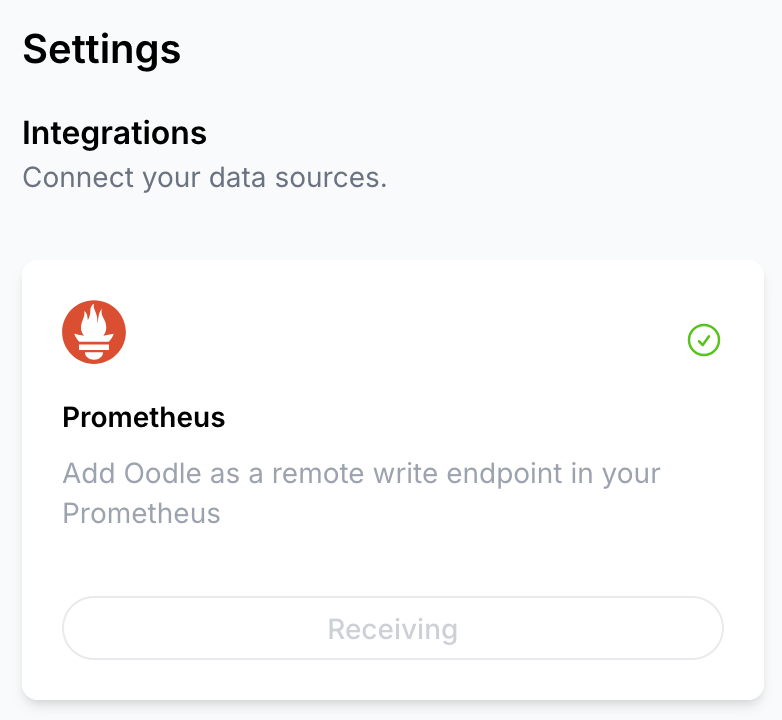
After adding the remote write configuration, you need to restart your Prometheus service to apply the changes. Once Oodle starts receiving the metrics, the status of the Prometheus tile will change to Receiving state with a green checkmark.

Prometheus Connected

Victoria Metrics Agent (vmagent)

If you are using Victoria Metrics Agent (vmagent) to scrape metrics from your targets, you can configure it to send metrics to Oodle by adding the -remoteWrite.url and -remoteWrite.headers flags to the vmagent command line.

-remoteWrite.url=https://<OODLE_ENDPOINT>/v1/prometheus/<INSTANCE_ID>/write
-remoteWrite.headers='X-API-KEY: <API_KEY>'

Visualize Metrics

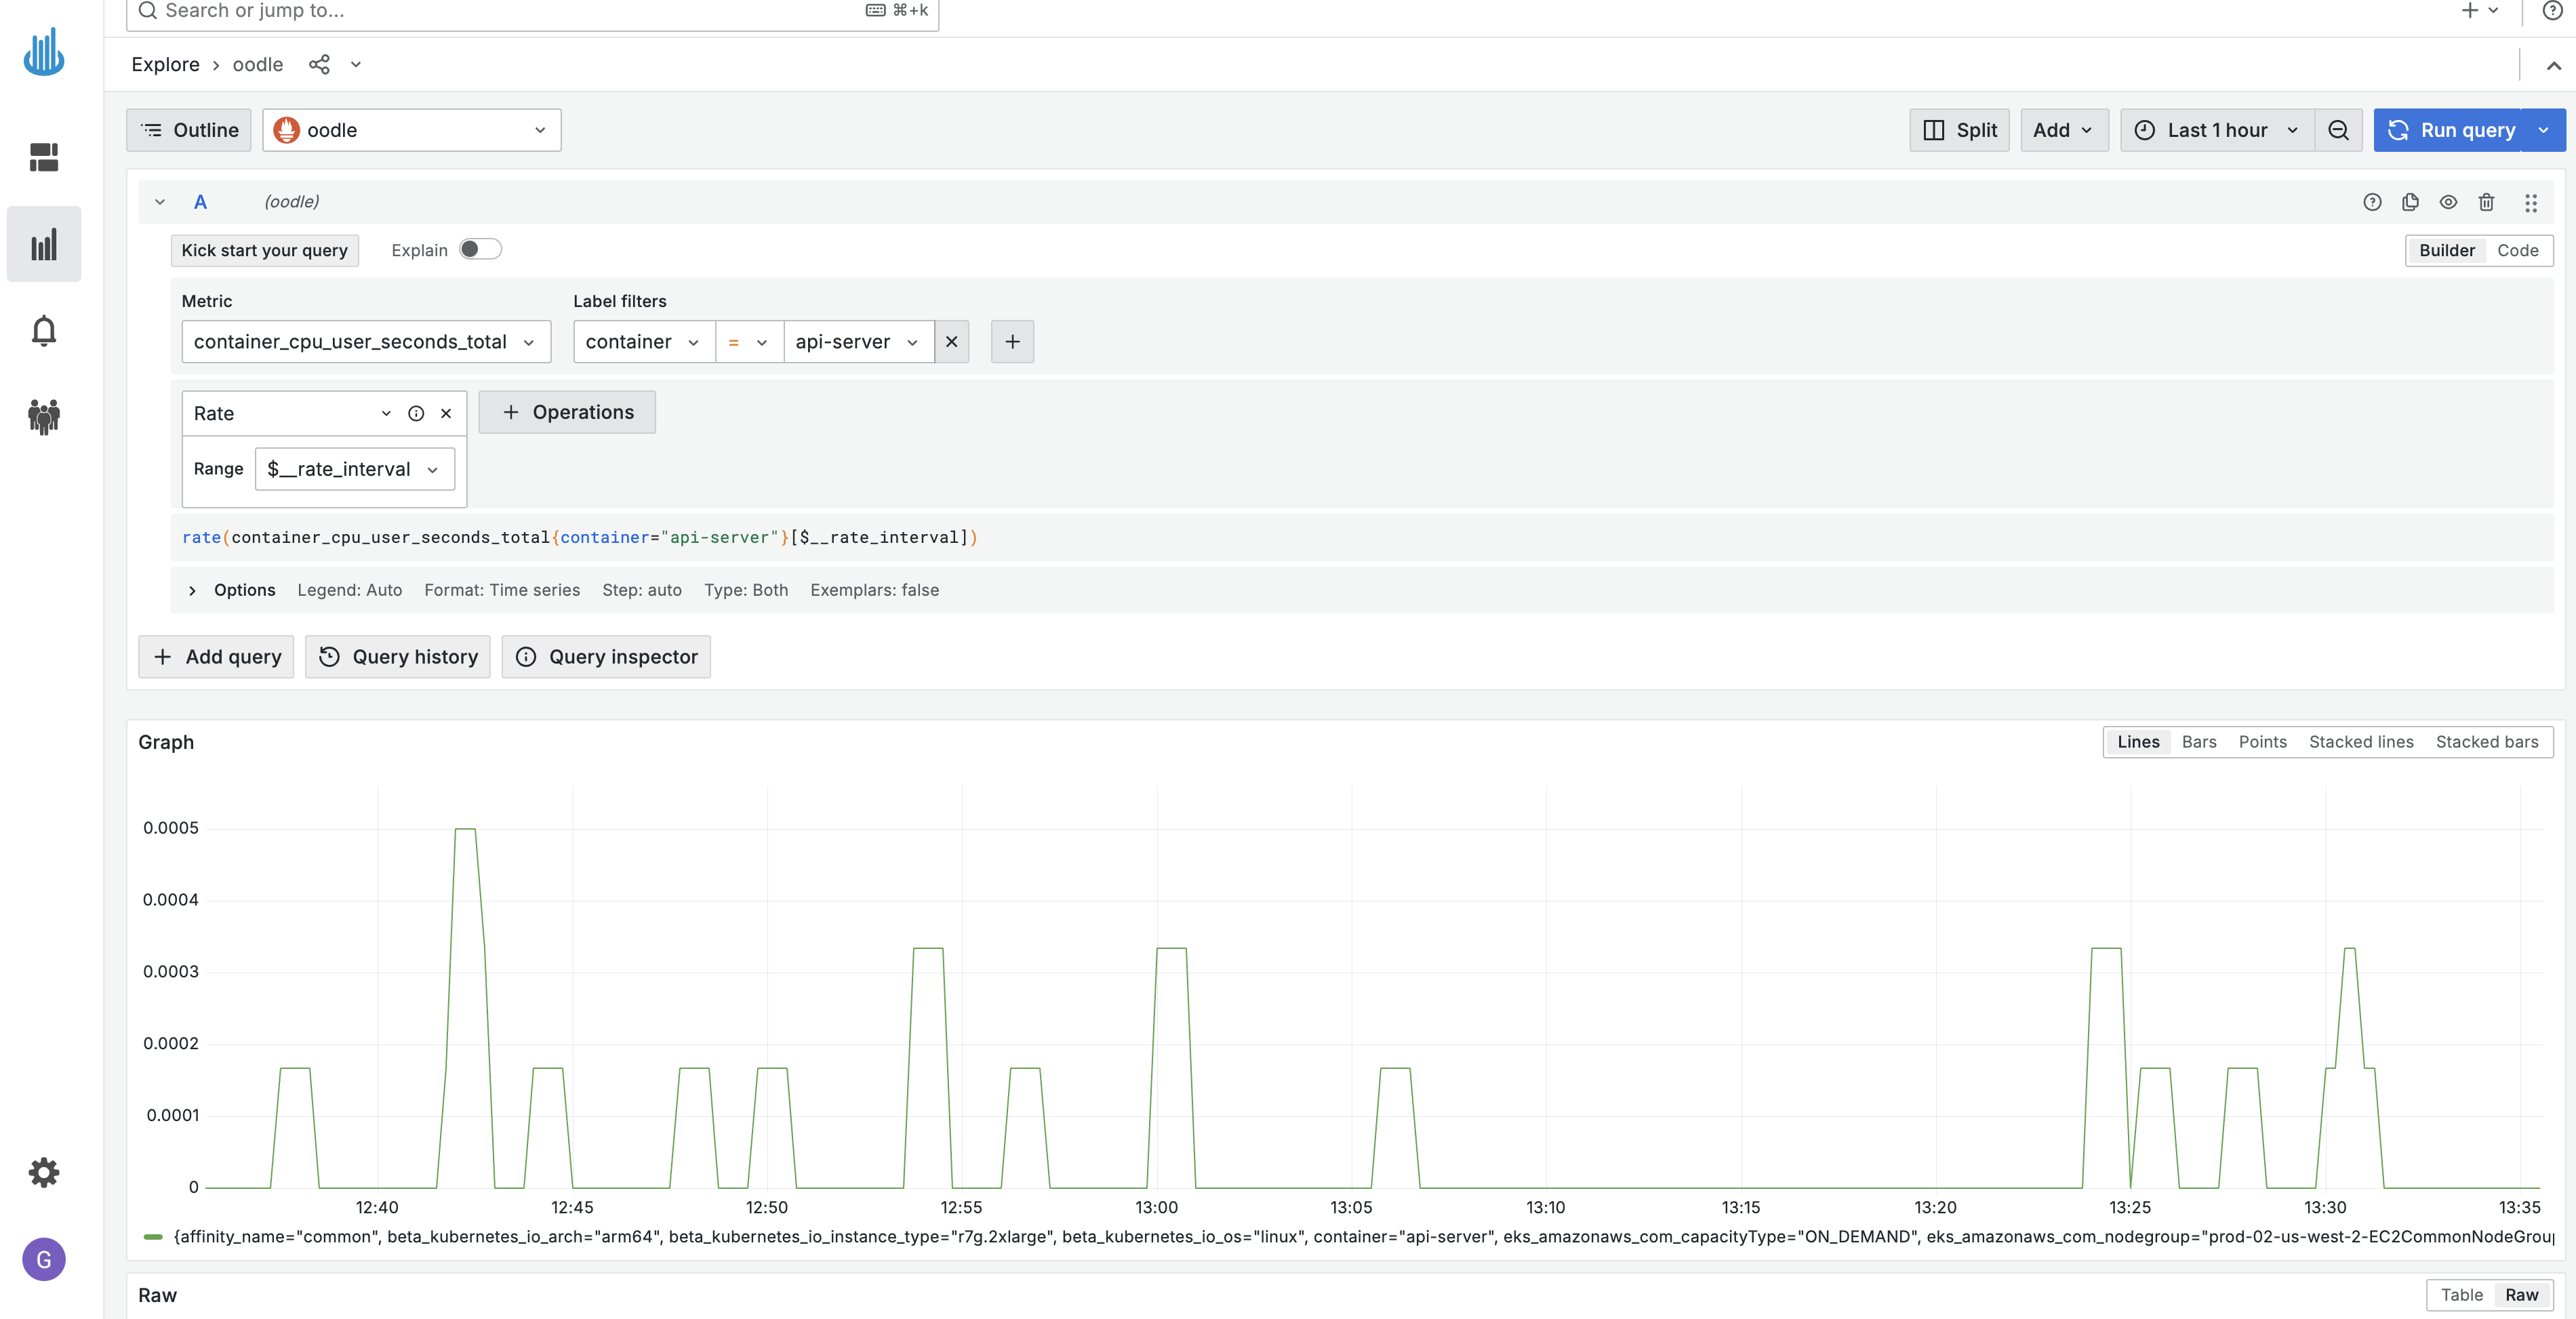
You can visualize metrics in Oodle using the Explore Metrics tab. It supports Grafana Builder and Code Editor to build PromQL queries. Please refer to PromQL Query docs to learn more about PromQL.

Explore Metrics

Creating Custom Metrics

Prerequisites: Understanding Prometheus Metric Types

Before implementing custom metrics, it's important to understand the four core metric types that Prometheus offers:

Counter

A counter is a cumulative metric that represents a single monotonically increasing value. Counters can only increase or be reset to zero upon restart. Use counters for metrics like:

  • Total number of requests processed
  • Total number of errors
  • Total number of tasks completed

Do not use counters for values that can decrease (like current number of running processes).

Gauge

A gauge represents a single numerical value that can arbitrarily increase or decrease. Gauges are perfect for measuring current states like:

  • Memory usage
  • Active requests
  • Queue size
  • CPU utilization

Histogram

A histogram samples observations (usually things like request durations or response sizes) and counts them in configurable buckets. It provides:

  • Cumulative counters for observation buckets (<basename>_bucket{le="<upper bound>"})
  • Total sum of all observed values (<basename>_sum)
  • Count of events observed (<basename>_count)

Histograms are ideal for calculating quantiles and Apdex scores.

Summary

Similar to histograms, summaries sample observations but calculate quantiles over a sliding time window. A summary provides:

  • Streaming φ-quantiles (0 ≤ φ ≤ 1) of observed events (<basename>{quantile="<φ>"})
  • Total sum of all observed values (<basename>_sum)
  • Count of events observed (<basename>_count)

Choose a summary when you need precise quantiles calculated by the client. Choose a histogram when you need to aggregate metrics from multiple instances or calculate quantiles for different time windows.

Custom Metrics Overview

Custom metrics allow you to measure and track specific business metrics that are unique to your application. Unlike system metrics (CPU, memory, etc.), custom metrics let you instrument your code to measure business-specific data points such as:

  • Number of user logins
  • Order processing times
  • Business transaction counts
  • Custom error rates
  • Application-specific performance indicators

Java Implementation

You can implement custom metrics in Java applications using either the official Prometheus client library or Spring Boot's built-in support.

Using Prometheus Java Client

To get started with the Prometheus Java Client:

  1. Add the following dependencies to your pom.xml:
<dependency>
<groupId>io.prometheus</groupId>
<artifactId>prometheus-metrics-core</artifactId>
<version>1.3.6</version>
</dependency>
<dependency>
<groupId>io.prometheus</groupId>
<artifactId>prometheus-metrics-instrumentation-jvm</artifactId>
<version>1.3.6</version>
</dependency>
<dependency>
<groupId>io.prometheus</groupId>
<artifactId>prometheus-metrics-exporter-httpserver</artifactId>
<version>1.3.6</version>
</dependency>
  1. Create a simple application with custom metrics:
import io.prometheus.metrics.core.metrics.Counter;
import io.prometheus.metrics.exporter.httpserver.HTTPServer;

public class CustomMetricsExample {
public static void main(String[] args) throws Exception {
// Create a counter with labels
Counter counter = Counter.builder()
.name("app_requests_total")
.help("Total number of requests processed")
.labelNames("status", "endpoint")
.register();

// Increment counter with different label values
counter.labelValues("success", "/api/users").inc();
counter.labelValues("success", "/api/orders").inc();
counter.labelValues("error", "/api/orders").inc();

// Start HTTP server to expose metrics
HTTPServer server = HTTPServer.builder()
.port(9400)
.buildAndStart();

System.out.println("Metrics available at: http://localhost:" + server.getPort() + "/metrics");
}
}

The metrics will be exposed in Prometheus format at http://localhost:9400/metrics:

# HELP app_requests_total Total number of requests processed
# TYPE app_requests_total counter
app_requests_total{status="success",endpoint="/api/users"} 1.0
app_requests_total{status="success",endpoint="/api/orders"} 1.0
app_requests_total{status="error",endpoint="/api/orders"} 1.0
  1. For more complex scenarios, you can create a metrics service class:
import io.prometheus.metrics.core.metrics.Counter;
import io.prometheus.metrics.core.metrics.Gauge;
import io.prometheus.metrics.core.metrics.Timer;

@Component
public class MetricsService {
private final Counter requestsTotal;
private final Gauge activeUsers;
private final Timer requestLatency;

public MetricsService() {
// Counter for total requests
requestsTotal = Counter.builder()
.name("app_requests_total")
.help("Total number of requests processed")
.labelNames("status", "endpoint")
.register();

// Gauge for active users
activeUsers = Gauge.builder()
.name("app_active_users")
.help("Number of active users")
.register();

// Timer for request latency
requestLatency = Timer.builder()
.name("app_request_latency_seconds")
.help("Request latency in seconds")
.labelNames("endpoint")
.register();
}

public void recordRequest(String status, String endpoint) {
requestsTotal.labelValues(status, endpoint).inc();
}

public void setActiveUsers(int count) {
activeUsers.set(count);
}

public Timer.Context timeRequest(String endpoint) {
return requestLatency.labels(endpoint).startTimer();
}
}
  1. Configure Prometheus to scrape these metrics by adding the following to your prometheus.yml:
scrape_configs:
- job_name: "java-app"
static_configs:
- targets: ["localhost:9400"]
  1. If you are running on Kubernetes, you can enable Prometheus auto-discovery by adding the following annotations to your pod/deployment:
apiVersion: apps/v1
kind: Deployment
metadata:
name: java-app
spec:
template:
metadata:
annotations:
prometheus.io/scrape: "true" # Enable scraping for the application
prometheus.io/path: "/actuator/prometheus" # Path to the metrics endpoint
prometheus.io/port: "8080" # Port on which the application is running

Using Spring Boot

Spring Boot provides excellent integration with Prometheus through the Micrometer library. Here's how to implement custom metrics:

  1. Add the required dependencies to your pom.xml:
<dependency>
<groupId>org.springframework.boot</groupId>
<artifactId>spring-boot-starter-actuator</artifactId>
</dependency>
<dependency>
<groupId>io.micrometer</groupId>
<artifactId>micrometer-registry-prometheus</artifactId>
</dependency>
  1. Configure Prometheus endpoint in application.properties:
management.endpoints.web.exposure.include=*
management.endpoint.health.show-details=always
  1. Create custom metrics using Micrometer:
import io.micrometer.core.instrument.Counter;
import io.micrometer.core.instrument.MeterRegistry;
import org.springframework.stereotype.Component;

@Component
public class CustomMetricsService {
private final Counter orderCounter;
private final Timer orderProcessingTimer;

public CustomMetricsService(MeterRegistry registry) {
this.orderCounter = Counter.builder("orders_total")
.description("Total number of orders processed")
.register(registry);

this.orderProcessingTimer = Timer.builder("order_processing_time")
.description("Time taken to process orders")
.register(registry);
}

public void recordOrder() {
orderCounter.increment();
}

public void measureOrderProcessing(Runnable orderProcess) {
orderProcessingTimer.record(orderProcess);
}
}
  1. Use the metrics in your business logic:
@Service
public class OrderService {
private final CustomMetricsService metricsService;

public OrderService(CustomMetricsService metricsService) {
this.metricsService = metricsService;
}

public void processOrder(Order order) {
metricsService.measureOrderProcessing(() -> {
// Order processing logic
metricsService.recordOrder();
});
}
}

The metrics will be automatically exposed at the /actuator/prometheus endpoint in Prometheus format:

# HELP orders_total Total number of orders processed
# TYPE orders_total counter
orders_total 10.0
# HELP order_processing_time Time taken to process orders
# TYPE order_processing_time summary
order_processing_time_count 10.0
order_processing_time_sum 2.5
  1. Configure Prometheus to scrape metrics by adding the following to your prometheus.yml:
scrape_configs:
- job_name: 'spring-boot-application'
metrics_path: '/actuator/prometheus'
scrape_interval: 15s # This can be adjusted based on your needs
static_configs:
- targets: ['localhost:8080']
  1. If you are running on Kubernetes, you can enable Prometheus auto-discovery by adding the following annotations to your Spring Boot application's deployment:
apiVersion: apps/v1
kind: Deployment
metadata:
name: spring-boot-app
spec:
template:
metadata:
annotations:
prometheus.io/scrape: "true" # Enable scraping for the application
prometheus.io/path: "/actuator/prometheus" # Path to the metrics endpoint
prometheus.io/port: "8080" # Port on which the application is running

These metrics can then be collected by your Prometheus server using the remote write configuration described earlier in this document.

Support

If you have any questions or need any assistance, please contact us via our help chat app located at the bottom-right of the page or by reaching out to support@oodle.ai.