Traces Summary
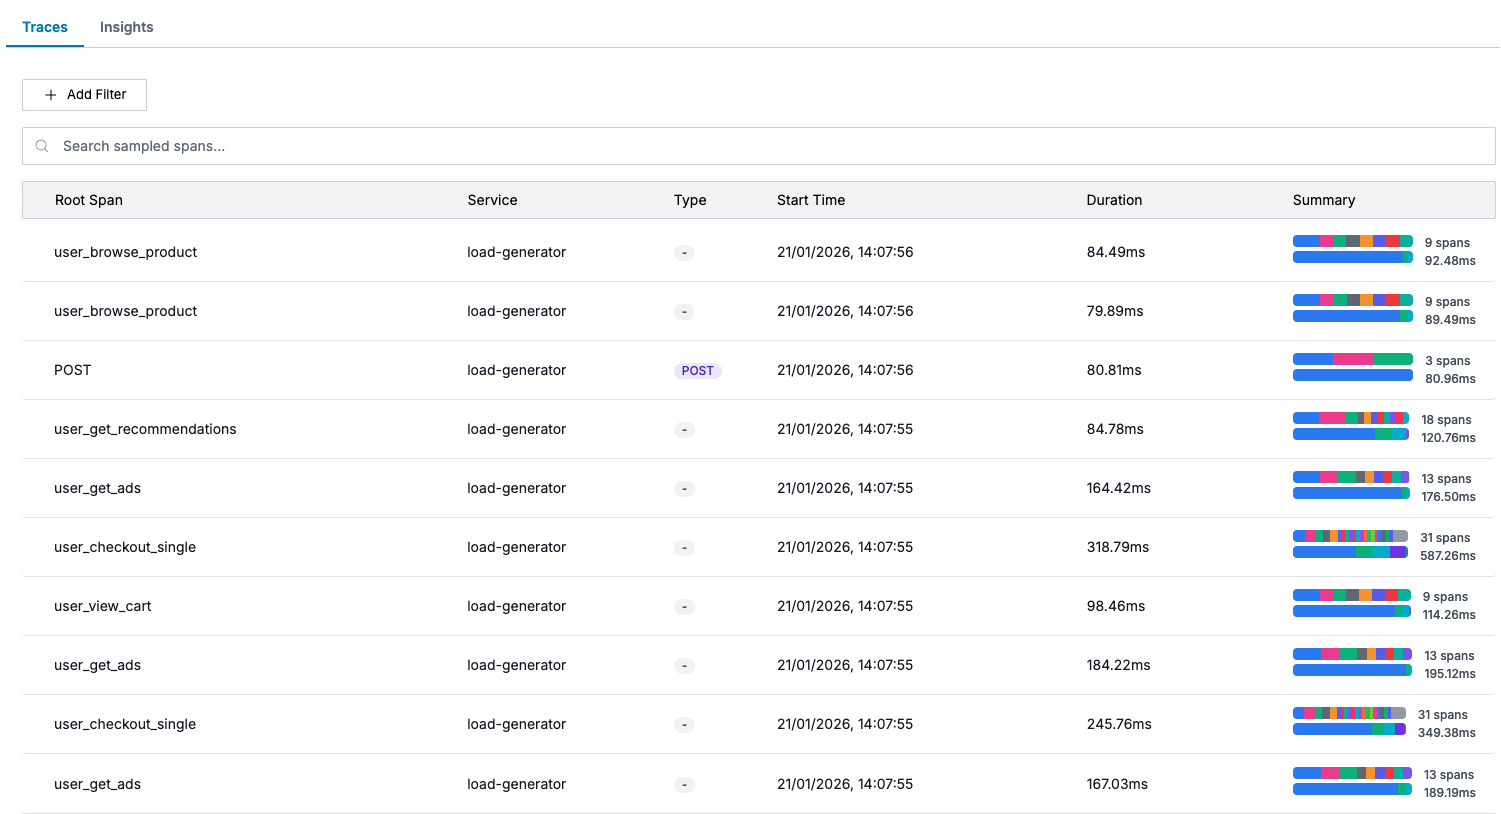
The Traces tab in the Trace Explorer page displays a searchable list of sampled spans matching your current filters. Each row represents a trace root span with summary information.
Trace List Columns
Each trace in the list displays:
| Column | Description |
|---|---|
| Root Span | The operation name of the trace's root span |
| Service | The service that generated the root span |
| Type | HTTP method (GET, POST) or protocol (gRPC) |
| Start Time | When the trace began |
| Duration | Total trace duration |
| Summary | Visual bar showing span count and timing breakdown per service |
Searching and Filtering
Filter from Selection
After selecting a region on the distribution heatmap:
- The trace list automatically filters to matching spans
- Duration and time constraints are applied
- Use this to focus on slow or anomalous requests
Add Filter Button
Click Add Filter to add attribute-based filters:
- Select a label name (e.g.,
http.status_code,service.name) - Select operator - equals to, not equals to, matches regex, does not match regex.
- Enter or select values to match.
- Multiple filters are combined with AND logic
Trace Row Details
Summary Bar
The summary bar on each row visualizes:
Span Distribution
Span Distribution gives a color-coded summary of how many times each span is occurring in the trace.
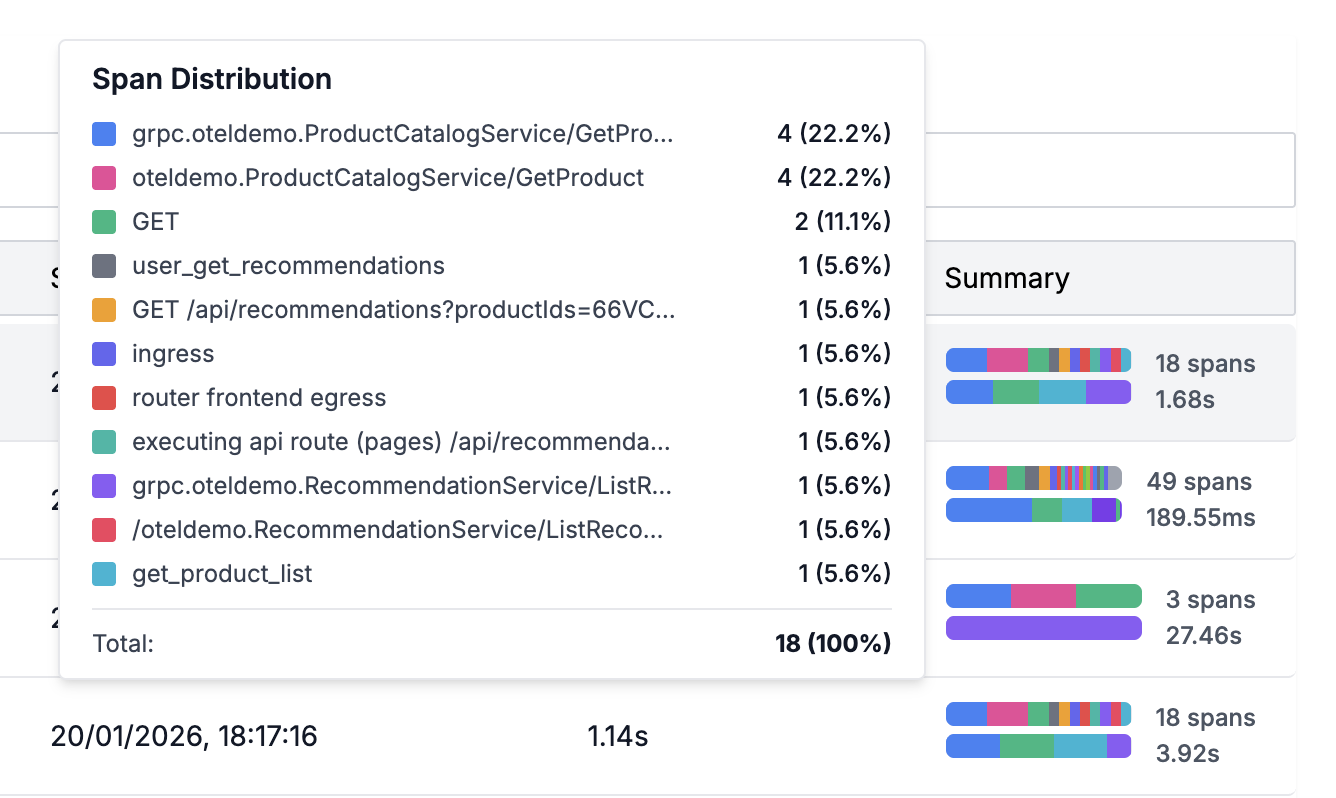
This can quickly help you identify N+1 queries/api calls as repeated queries would be surfaced higher in the summary distribution.
N+1 Query pattern is a performance problem in which the application makes repeated calls to Database or another service in a loop instead of using batched APIs.
Duration by Service
Duration breakdown by Service gives a color-coded summary of time spent by each service involved in the trace.
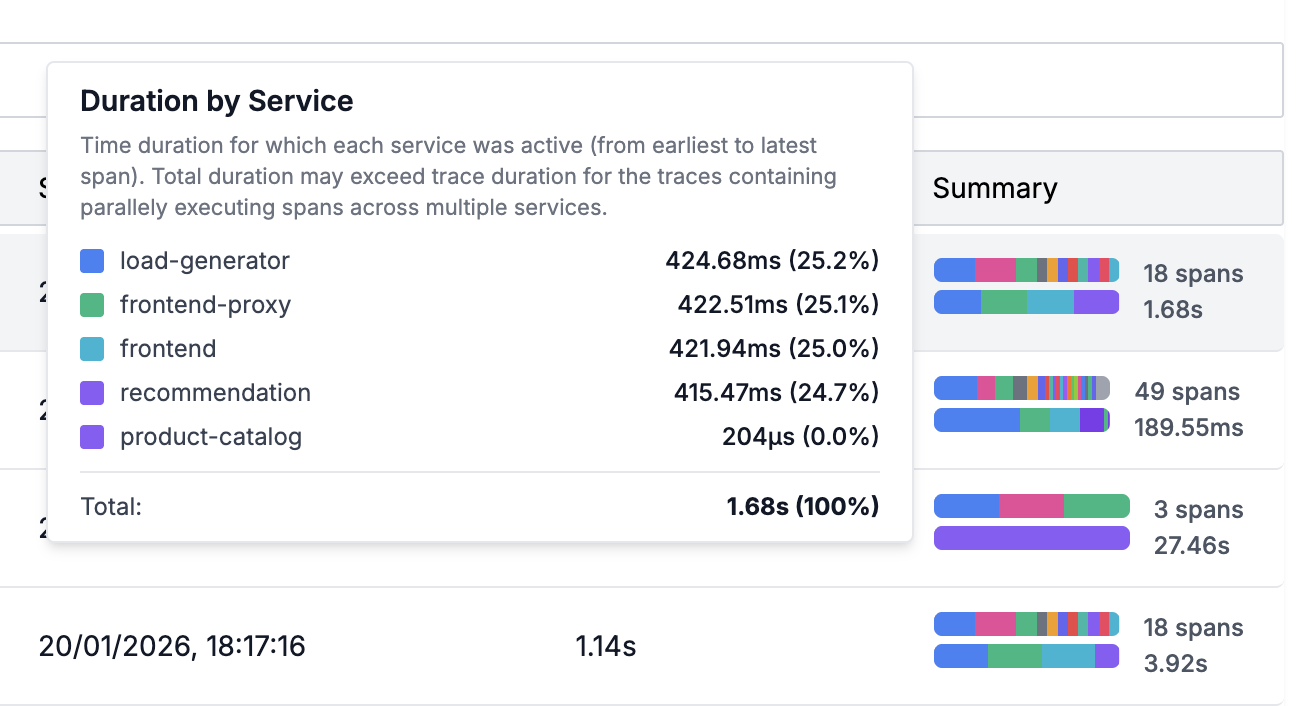
This can quickly help you identify the offending service which is causing higher latency.
Expanding a Trace
Click on any trace row to open the Trace View panel, which shows:
- Full span waterfall
- Span attributes and metadata
- Related logs and metrics
- Service graph context
Best Practices
- Start broad, then narrow: Begin with a time range, then add service or status filters
- Use the heatmap selection: Drag on the distribution chart to quickly isolate slow or problematic traces
- Check the summary bar: A trace with many spans or long duration may indicate N+1 queries or cascading delays.
- Drill down into a trace: To identify what's causing the slowness or error in the execution.
Support
If you need assistance or have any questions, please reach out to us through:
- Email at [email protected]