Node.js Instrumentation
Use the OpenTelemetry auto-instrumentation libraries to automatically capture telemetry from popular libraries and frameworks for your Node.js application - without modifying your application code.
Overview
The OpenTelemetry Node.js auto-instrumentation can capture telemetry data at the "edges" of your application, such as:
- Inbound HTTP requests
- Outbound HTTP calls
- Database calls (MongoDB, PostgreSQL, MySQL, etc.)
- Express and other web framework operations
- And many other popular frameworks and libraries
Prerequisites
- Node.js 14 or higher
- An active Oodle instance
Getting Started
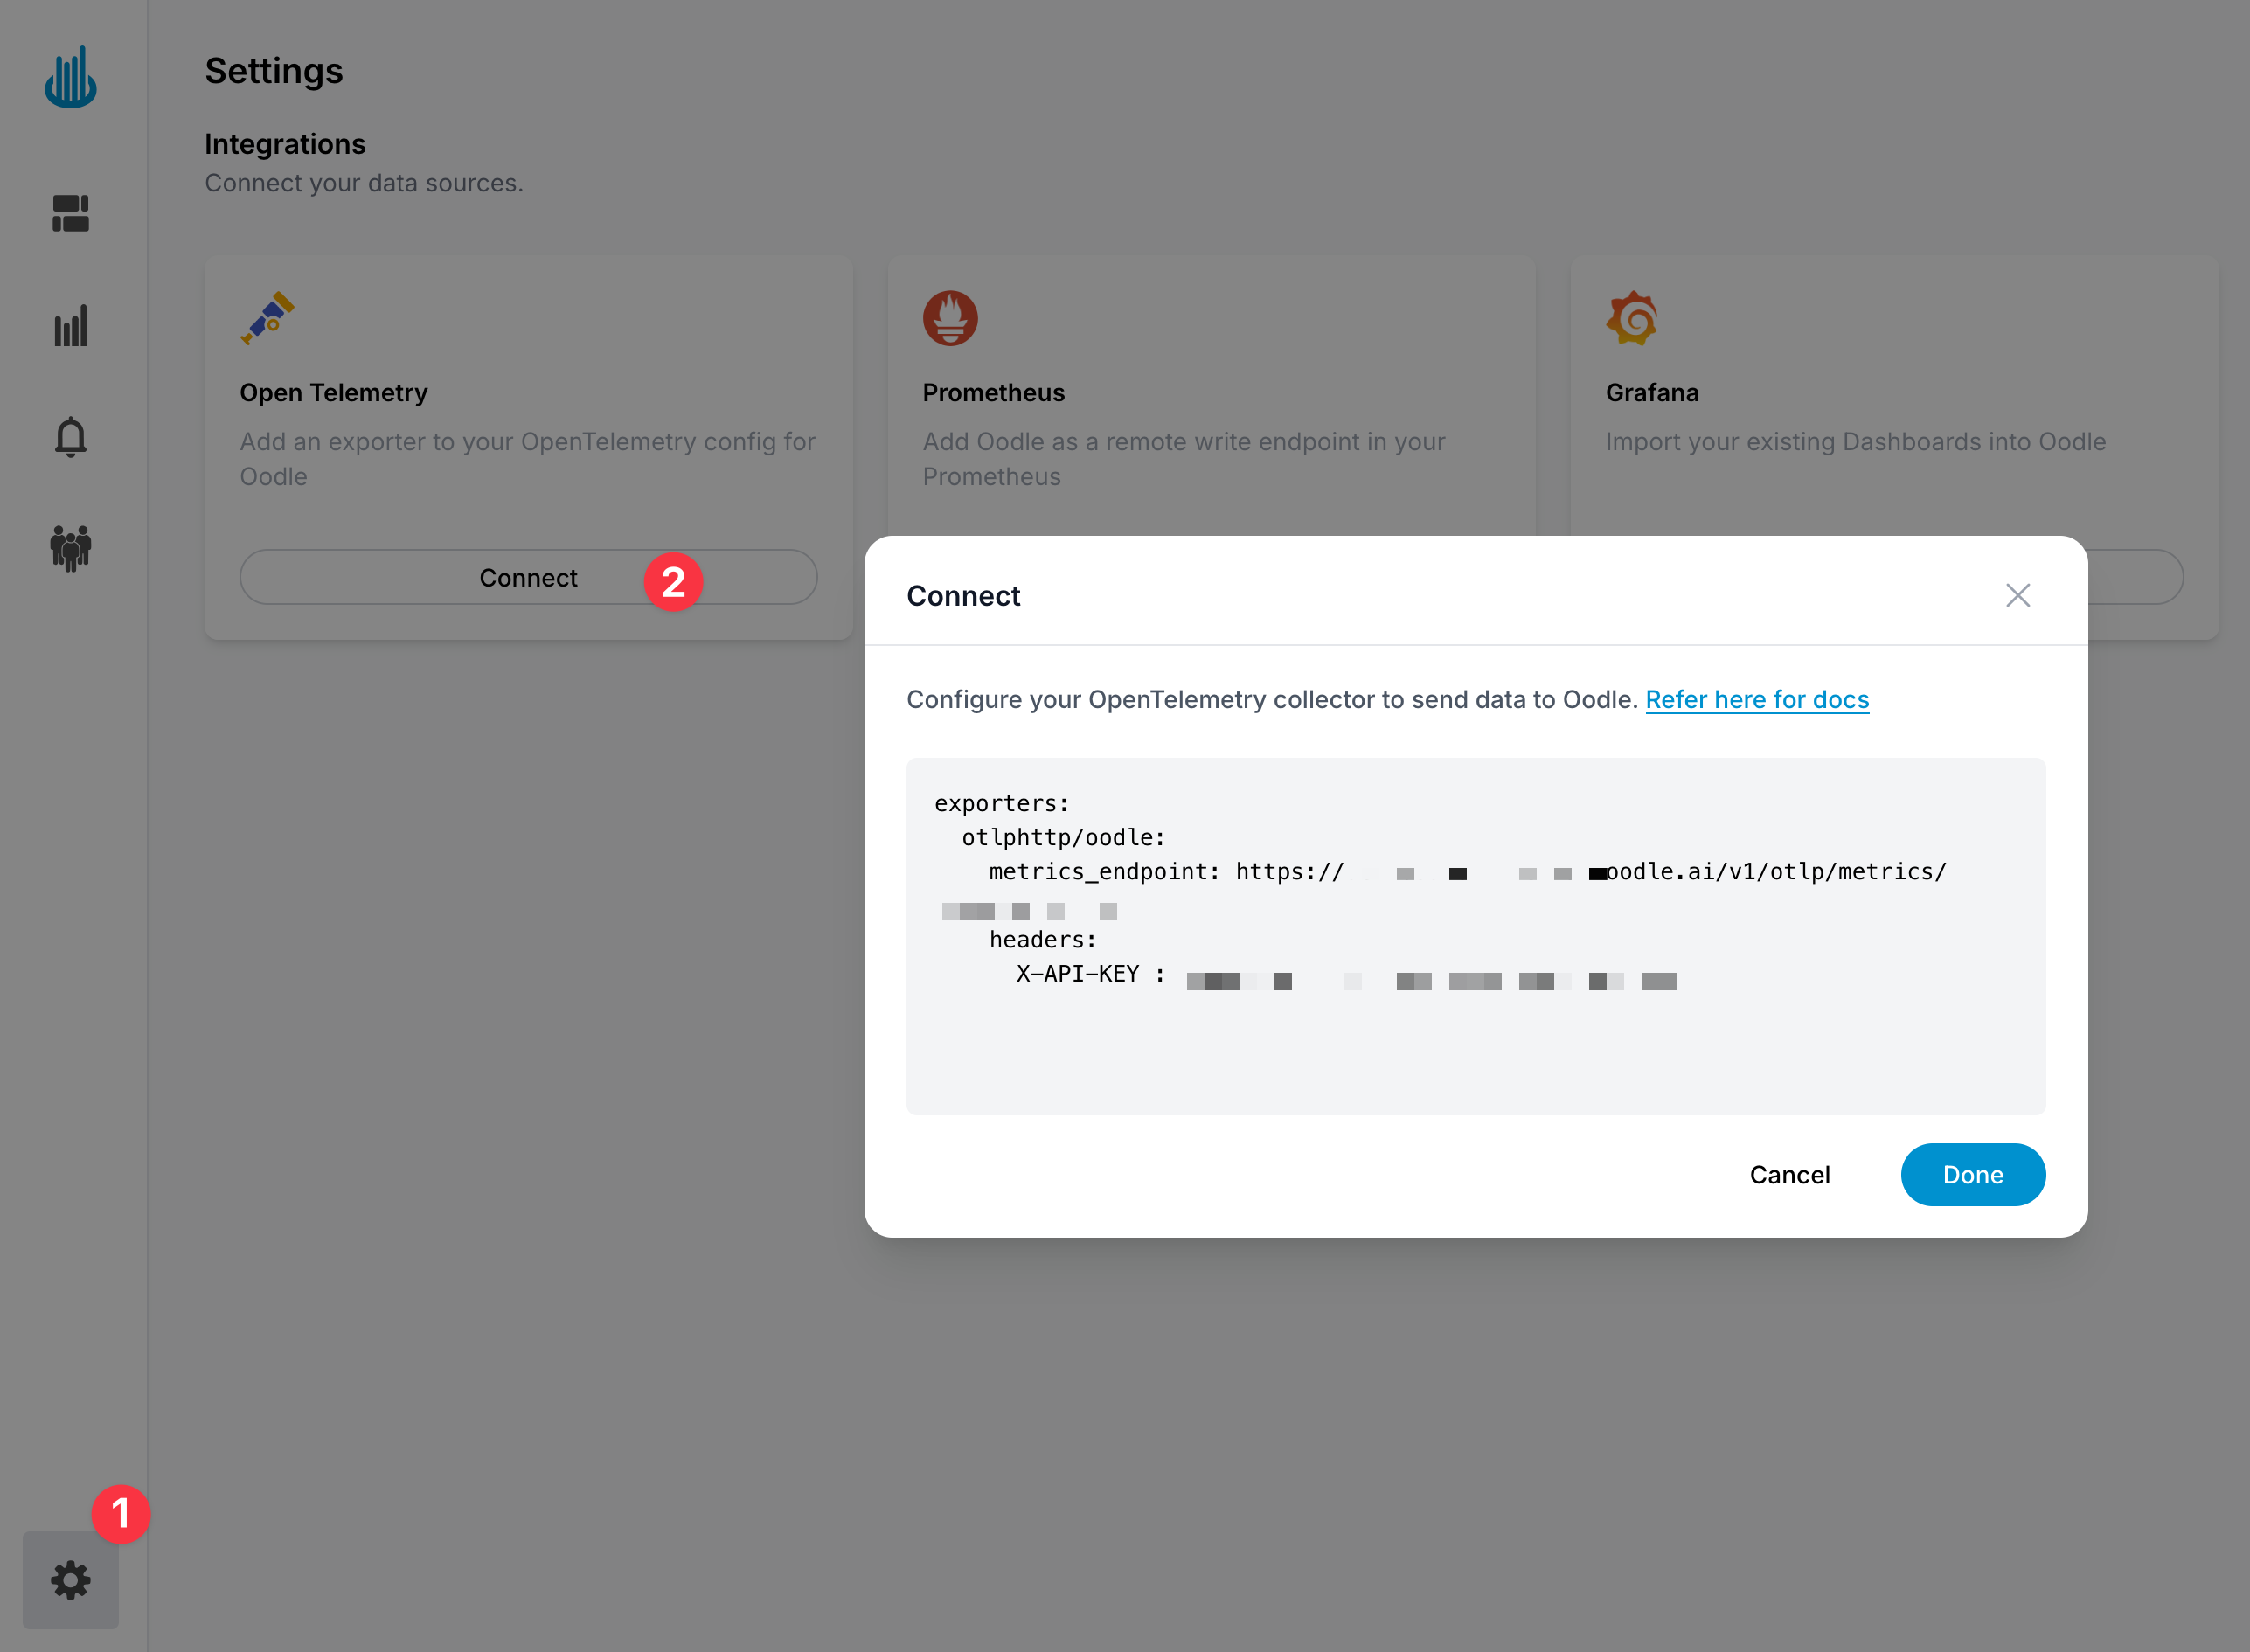
Step 1: Get Your Oodle Configuration
In the Oodle UI, navigate to the Settings page and click on Connect in the Open Telemetry tile and copy the provided configuration snippet which includes your metrics endpoint and API key
Step 2: Choose Your Setup Approach
- Zero-Code (Quick Start)
- Using instrumentation.js file
The simplest way to get started - no instrumentation code required. Just install the package and configure via environment variables.
Install the package:
npm install @opentelemetry/auto-instrumentations-node
Set environment variables:
export OTEL_SERVICE_NAME=<YOUR_SERVICE_NAME>
export OTEL_EXPORTER_OTLP_ENDPOINT=<OODLE_OTEL_ENDPOINT>
export OTEL_EXPORTER_OTLP_HEADERS="X-API-KEY=<OODLE_API_KEY>"
export OTEL_METRICS_EXPORTER=otlp
export OTEL_TRACES_EXPORTER=otlp
export OTEL_LOGS_EXPORTER=none
Run your application:
node --require @opentelemetry/auto-instrumentations-node/register server.js
Or in package.json:
{
  "scripts": {
    "start": "node --require @opentelemetry/auto-instrumentations-node/register server.js"
  }
}
The zero-code approach uses default settings. For custom export intervals, selective instrumentation control, or advanced configuration, use the instrumentation.js file approach.
For full control over export intervals, selective instrumentation, and custom resource attributes.
Install the packages:
npm install @opentelemetry/auto-instrumentations-node \
  @opentelemetry/api \
  @opentelemetry/sdk-node \
  @opentelemetry/sdk-metrics \
  @opentelemetry/sdk-trace-base \
  @opentelemetry/exporter-metrics-otlp-http \
  @opentelemetry/exporter-trace-otlp-http \
  @opentelemetry/resources \
  @opentelemetry/semantic-conventions
Create an instrumentation file named instrumentation.js in your project root:
const { NodeSDK } = require('@opentelemetry/sdk-node');
const {
  getNodeAutoInstrumentations,
} = require('@opentelemetry/auto-instrumentations-node');
const {
  OTLPMetricExporter,
} = require('@opentelemetry/exporter-metrics-otlp-http');
const {
  OTLPTraceExporter,
} = require('@opentelemetry/exporter-trace-otlp-http');
const {
  PeriodicExportingMetricReader,
} = require('@opentelemetry/sdk-metrics');
const { BatchSpanProcessor } = require('@opentelemetry/sdk-trace-base');
const { Resource } = require('@opentelemetry/resources');
const {
  ATTR_SERVICE_NAME,
  ATTR_DEPLOYMENT_ENVIRONMENT_NAME,
} = require('@opentelemetry/semantic-conventions');

// Read configuration from environment variables
const serviceName = process.env.OTEL_SERVICE_NAME ||
  'my-service';
const endpoint = process.env.OTEL_EXPORTER_OTLP_ENDPOINT ||
  'http://localhost:4318';
const metricsEndpoint = process.env.OTEL_EXPORTER_OTLP_METRICS_ENDPOINT ||
  endpoint;
const tracesEndpoint = process.env.OTEL_EXPORTER_OTLP_TRACES_ENDPOINT ||
  endpoint;
const apiKey = process.env.OTEL_EXPORTER_OTLP_HEADERS;

// Create resource with service name
const resource = new Resource({
  [ATTR_SERVICE_NAME]: serviceName,
  [ATTR_DEPLOYMENT_ENVIRONMENT_NAME]: 'production',
});

// Configure metric exporter
const metricExporter = new OTLPMetricExporter({
  url: metricsEndpoint,
  headers: apiKey ? { 'X-API-KEY': apiKey } : {},
});

// Configure trace exporter
const traceExporter = new OTLPTraceExporter({
  url: tracesEndpoint,
  headers: apiKey ? { 'X-API-KEY': apiKey } : {},
});

// Initialize SDK with auto-instrumentations
const sdk = new NodeSDK({
  resource,
  traceExporter,
  metricReader: new PeriodicExportingMetricReader({
    exporter: metricExporter,
    exportIntervalMillis: 60000, // Export every 60 seconds
  }),
  spanProcessors: [
    new BatchSpanProcessor(traceExporter),
  ],
  instrumentations: [
    getNodeAutoInstrumentations({
      '@opentelemetry/instrumentation-http': { enabled: true },
      '@opentelemetry/instrumentation-express': { enabled: true },
      '@opentelemetry/instrumentation-dns': { enabled: true },
      '@opentelemetry/instrumentation-net': { enabled: true },
    }),
  ],
});

// Start the SDK
sdk.start();

console.log(
  `OpenTelemetry instrumentation initialized for ${serviceName}`
);
console.log(`  Traces endpoint: ${tracesEndpoint}`);
console.log(`  Metrics endpoint: ${metricsEndpoint}`);

// Graceful shutdown
process.on('SIGTERM', () => {
  sdk
    .shutdown()
    .then(
      () => console.log('OpenTelemetry SDK shut down successfully'),
      (err) =>
        console.error('Error shutting down OpenTelemetry SDK', err)
    )
    .finally(() => process.exit(0));
});
Configure environment variables:
You can send telemetry data directly to Oodle or route it through an OpenTelemetry Collector for additional processing and routing capabilities.
- Direct to Oodle
- Via OTEL Collector
Send metrics and traces directly to Oodle endpoints:
# OpenTelemetry Configuration
export OTEL_SERVICE_NAME=<YOUR_SERVICE_NAME>
export OTEL_EXPORTER_OTLP_METRICS_ENDPOINT=<OODLE_OTEL_METRICS_ENDPOINT>
export OTEL_EXPORTER_OTLP_TRACES_ENDPOINT=<OODLE_OTEL_TRACES_ENDPOINT>
export OTEL_EXPORTER_OTLP_HEADERS=X-API-KEY=<OODLE_API_KEY>
When to use: Simple setups, single application, direct connection to Oodle.
Route telemetry through an OpenTelemetry Collector:
# OpenTelemetry Configuration
export OTEL_SERVICE_NAME=<YOUR_SERVICE_NAME>
export OTEL_EXPORTER_OTLP_ENDPOINT=http://otel-collector:4318
Configure your OTEL Collector to forward to Oodle:
# otel-collector-config.yaml
exporters:
  otlphttp/oodle-metrics:
    endpoint: <OODLE_OTEL_METRICS_ENDPOINT>
    headers:
      X-API-KEY: <OODLE_API_KEY>

  otlphttp/oodle-traces:
    endpoint: <OODLE_OTEL_TRACES_ENDPOINT>
    headers:
      X-API-KEY: <OODLE_API_KEY>

service:
  pipelines:
    metrics:
      receivers: [otlp]
      exporters: [otlphttp/oodle-metrics]
    traces:
      receivers: [otlp]
      exporters: [otlphttp/oodle-traces]
When to use: Multiple services, need for data transformation, sampling, or routing to multiple backends.
Run your application:
- Node Command
- package.json
- Docker
Load the instrumentation file before your application code:
node --require ./instrumentation.js server.js
Update your package.json scripts:
{
  "scripts": {
    "start": "node --require ./instrumentation.js server.js"
  }
}
Then run:
npm start
Add the instrumentation setup to your Dockerfile:
# Copy instrumentation file
COPY instrumentation.js .

# Set environment variables
ENV OTEL_SERVICE_NAME=<YOUR_SERVICE_NAME>
ENV OTEL_EXPORTER_OTLP_METRICS_ENDPOINT=<OODLE_OTEL_METRICS_ENDPOINT>
ENV OTEL_EXPORTER_OTLP_TRACES_ENDPOINT=<OODLE_OTEL_TRACES_ENDPOINT>
ENV OTEL_EXPORTER_OTLP_HEADERS=<OODLE_API_KEY>

# Run application with instrumentation
CMD ["node", "--require", "./instrumentation.js", "server.js"]
Or if using docker-compose.yml, override the command:
services:
  app:
    image: your-app:latest
    command: node --require ./instrumentation.js server.js
    environment:
      - OTEL_SERVICE_NAME=my-service
      - OTEL_EXPORTER_OTLP_METRICS_ENDPOINT=https://...
      - OTEL_EXPORTER_OTLP_TRACES_ENDPOINT=https://...
      - OTEL_EXPORTER_OTLP_HEADERS=X-API-KEY=...
Supported Instrumentations
The Node.js auto-instrumentation package supports many popular libraries and frameworks:
- HTTP/HTTPS: Express, Koa, Fastify, Hapi, Restify
- Databases: MongoDB, PostgreSQL, MySQL, Redis, Cassandra
- Messaging: Kafka, RabbitMQ, AWS SQS
- Cloud Services: AWS SDK, Google Cloud, Azure
For a complete list, see the OpenTelemetry Node.js Instrumentation documentation.
Configuration Options
Enabling and Disabling Specific Instrumentations
- Zero-Code (Quick Start)
- Using instrumentation.js file
Use environment variables to control which instrumentations are enabled:
# Disable specific instrumentations (comma-separated list)
export OTEL_NODE_DISABLED_INSTRUMENTATIONS="fs,dns"

# Or enable only specific instrumentations
export OTEL_NODE_ENABLED_INSTRUMENTATIONS="http,express,mongodb"
Configure instrumentations in your instrumentation.js file:
instrumentations: [
  getNodeAutoInstrumentations({
    // Disable instrumentations you don't need
    '@opentelemetry/instrumentation-fs': { enabled: false },
    '@opentelemetry/instrumentation-dns': { enabled: false },

    // Enable instrumentations you want
    '@opentelemetry/instrumentation-http': { enabled: true },
    '@opentelemetry/instrumentation-express': { enabled: true },
    '@opentelemetry/instrumentation-mongodb': { enabled: true },
  }),
]
Adjusting Export Interval
- Zero-Code (Quick Start)
- Using instrumentation.js file
# Export metrics every 60 seconds (in milliseconds)
export OTEL_METRIC_EXPORT_INTERVAL=60000
metricReader: new PeriodicExportingMetricReader({
  exporter: metricExporter,
  exportIntervalMillis: 60000, // Export every 60 seconds
})
Adding Custom Resource Attributes
- Zero-Code (Quick Start)
- Using instrumentation.js file
export OTEL_RESOURCE_ATTRIBUTES="service.version=1.0.0,service.namespace=my-namespace,deployment.region=us-west-2"
const resource = new Resource({
  [ATTR_SERVICE_NAME]: serviceName,
  [ATTR_DEPLOYMENT_ENVIRONMENT_NAME]: 'production',
  [ATTR_SERVICE_VERSION]: '1.0.0',
  'service.namespace': 'my-namespace',
  'deployment.region': 'us-west-2',
});
Performance Considerations
The OpenTelemetry Node.js auto-instrumentation has minimal performance overhead:
- Typical CPU overhead: < 5%
- Memory overhead: < 50MB
- No noticeable impact on application latency
For production use:
- Start with conservative export intervals (30-60 seconds)
- Monitor your application's resource usage
- Disable unnecessary instrumentations
Support
If you need assistance or have any questions, please reach out to us through:
- Email at [email protected]