Database Queries
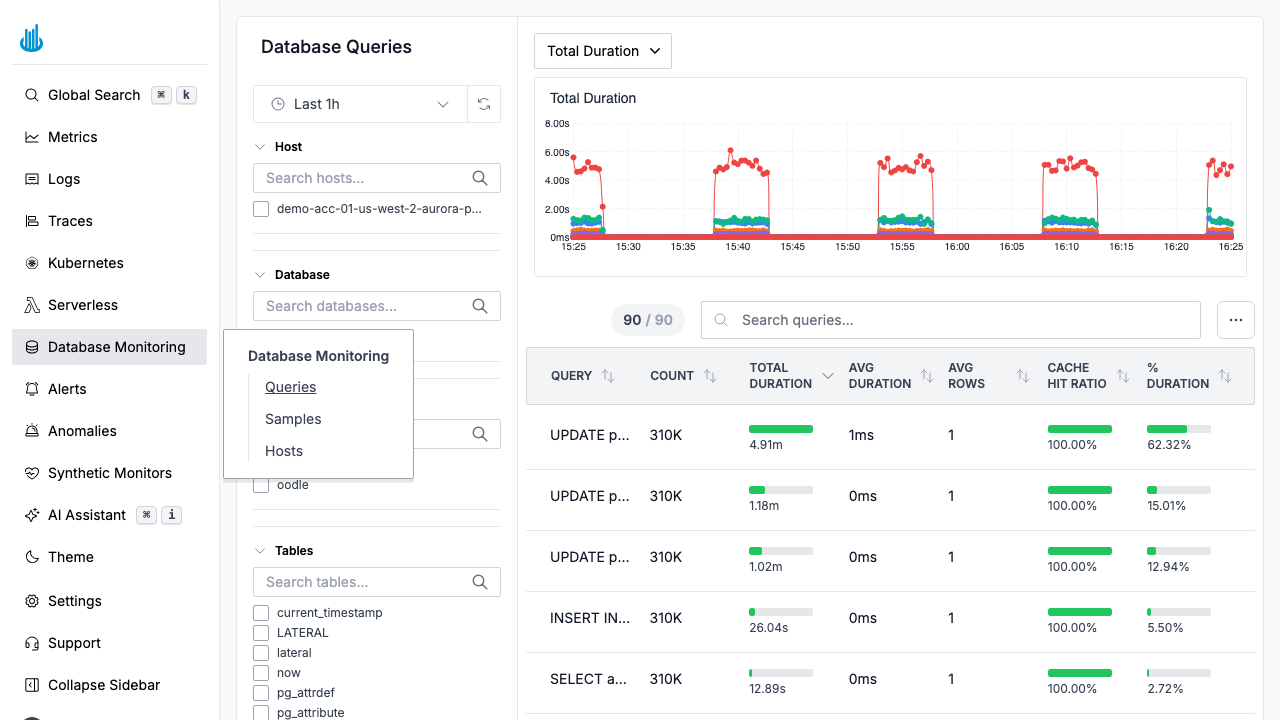
The Queries tab shows aggregated performance metrics for every normalized database query. Use it to identify slow queries, high- volume queries, and queries that consume the most total database time.
Overview Chart
At the top of the page, a time-series chart visualizes the selected metric over time. Use the dropdown to switch between:
- Total Duration — Cumulative execution time across all executions.
- Avg Duration — Mean execution time per query call.
- Count — Number of executions.
Queries Table
Below the chart, the table lists every normalized query:
| Column | Description |
|---|---|
| Query | Normalized SQL statement (parameters replaced with placeholders) |
| Count | Number of times the query ran in the selected window |
| Total Duration | Cumulative execution time with a visual bar |
| Avg Duration | Average execution time |
| Avg Rows | Average number of rows returned or affected |
| Cache Hit Ratio | Percentage of executions served from cache |
| % Duration | Share of total database time consumed by this query |
Sorting
Click any column header to sort. Sorting by Total Duration (descending) is the most effective way to find the queries that matter most.
Search
Use the search bar to filter queries by SQL text.
Column Selector
Click the column-selector button in the toolbar to toggle additional columns on or off. Hidden by default are block-level I/O columns such as Avg Shared Blocks Hit/Read, Avg Local Blocks Hit/Read, and Avg Temp Blocks Read/Written. These are useful for diagnosing I/O-heavy queries.
Show Full Query
Toggle Show Full Query in the toolbar to expand truncated SQL statements in the table so you can read the complete query text without clicking into the detail drawer.
Filters
The left-hand panel provides:
- Host — Filter by database host.
- Database — Filter by database name.
- User — Filter by the database user that executed the query.
- Tables — Filter by referenced table names.
- Commands — Filter by SQL command type (e.g., SELECT, INSERT).
Click to Drill Down
Click any query row to see:
- A detailed execution timeline.
- Per-host breakdown of execution statistics.
- Link to related Samples for that query.
Related Pages
- Database Samples — View individual query execution events.
- Database Hosts — Monitor host-level performance.
Support
If you need assistance or have any questions, please reach out to us through:
- Email at [email protected]