LLM Observability
Oodle's LLM Observability helps engineering teams track how large language models are used across their applications - including prompts, responses, token consumption, and estimated costs.
How It Works
Oodle ingests traces and logs that follow the OpenTelemetry Gen AI semantic conventions. When your application instruments LLM calls with these conventions, Oodle automatically:
- Detects the model from
gen_ai.request.modelandgen_ai.response.modelspan attributes - Extracts input and output token counts from
gen_ai.usage.input_tokensandgen_ai.usage.output_tokens - Displays prompt and response content from
gen_ai.input.messages,gen_ai.output.messages, andgen_ai.system_instructionsspan attributes - Calculates estimated costs based on your configured model pricing
All of this is surfaced in the LLM Traces explorer at GenAI > Traces (ap1, us1).
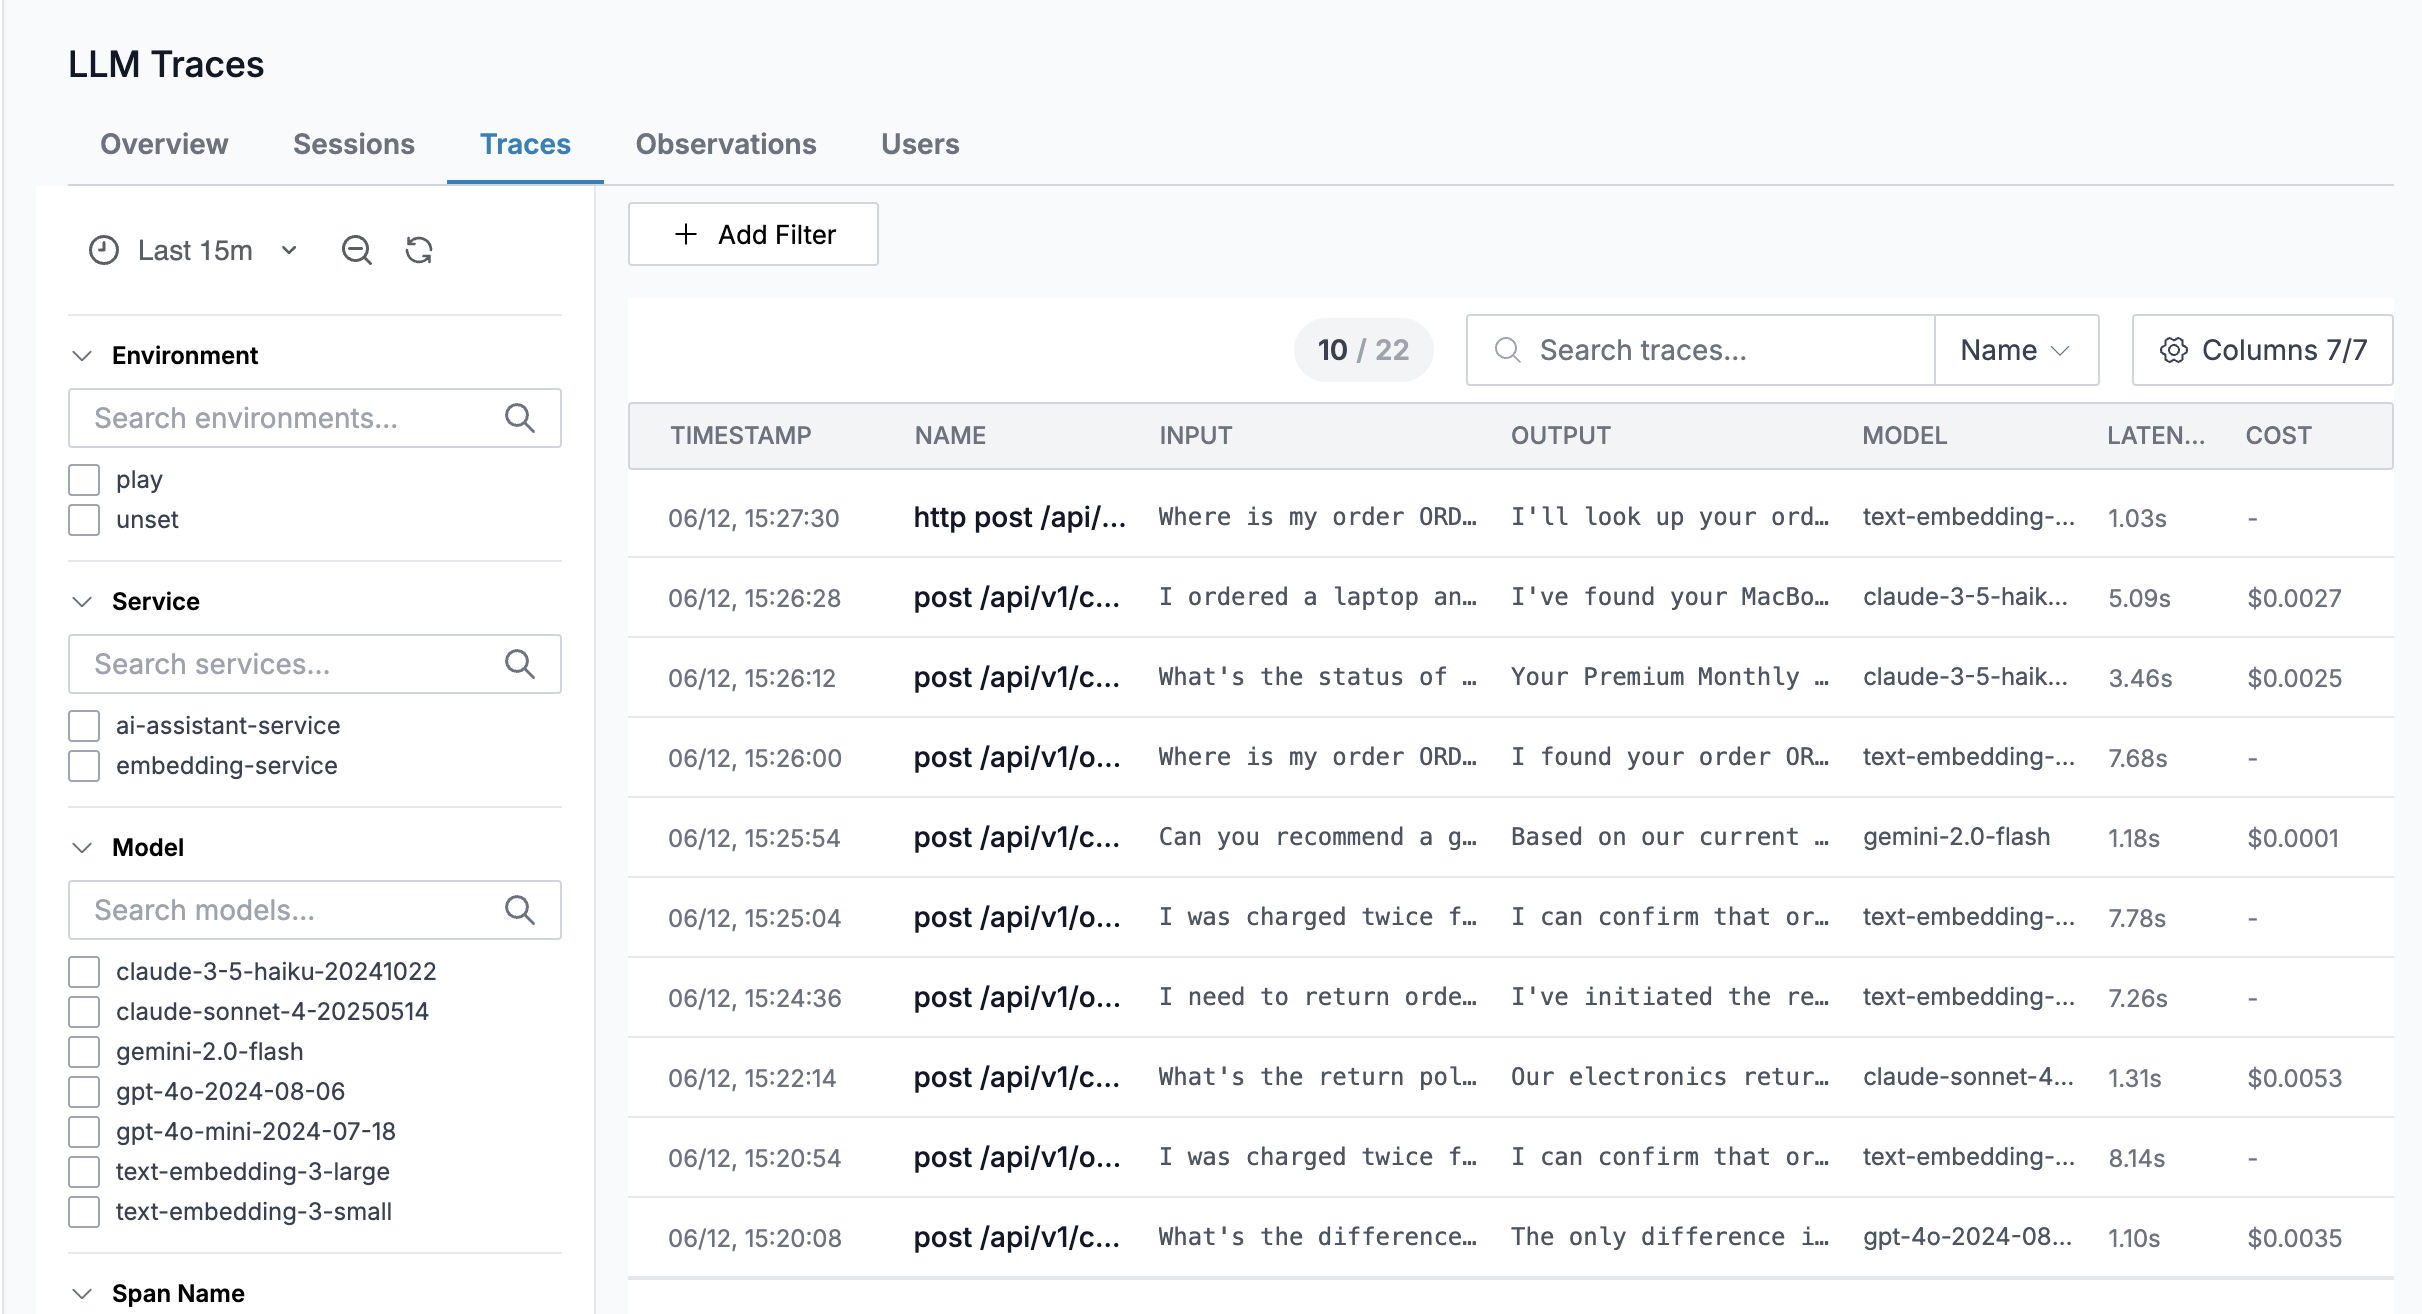
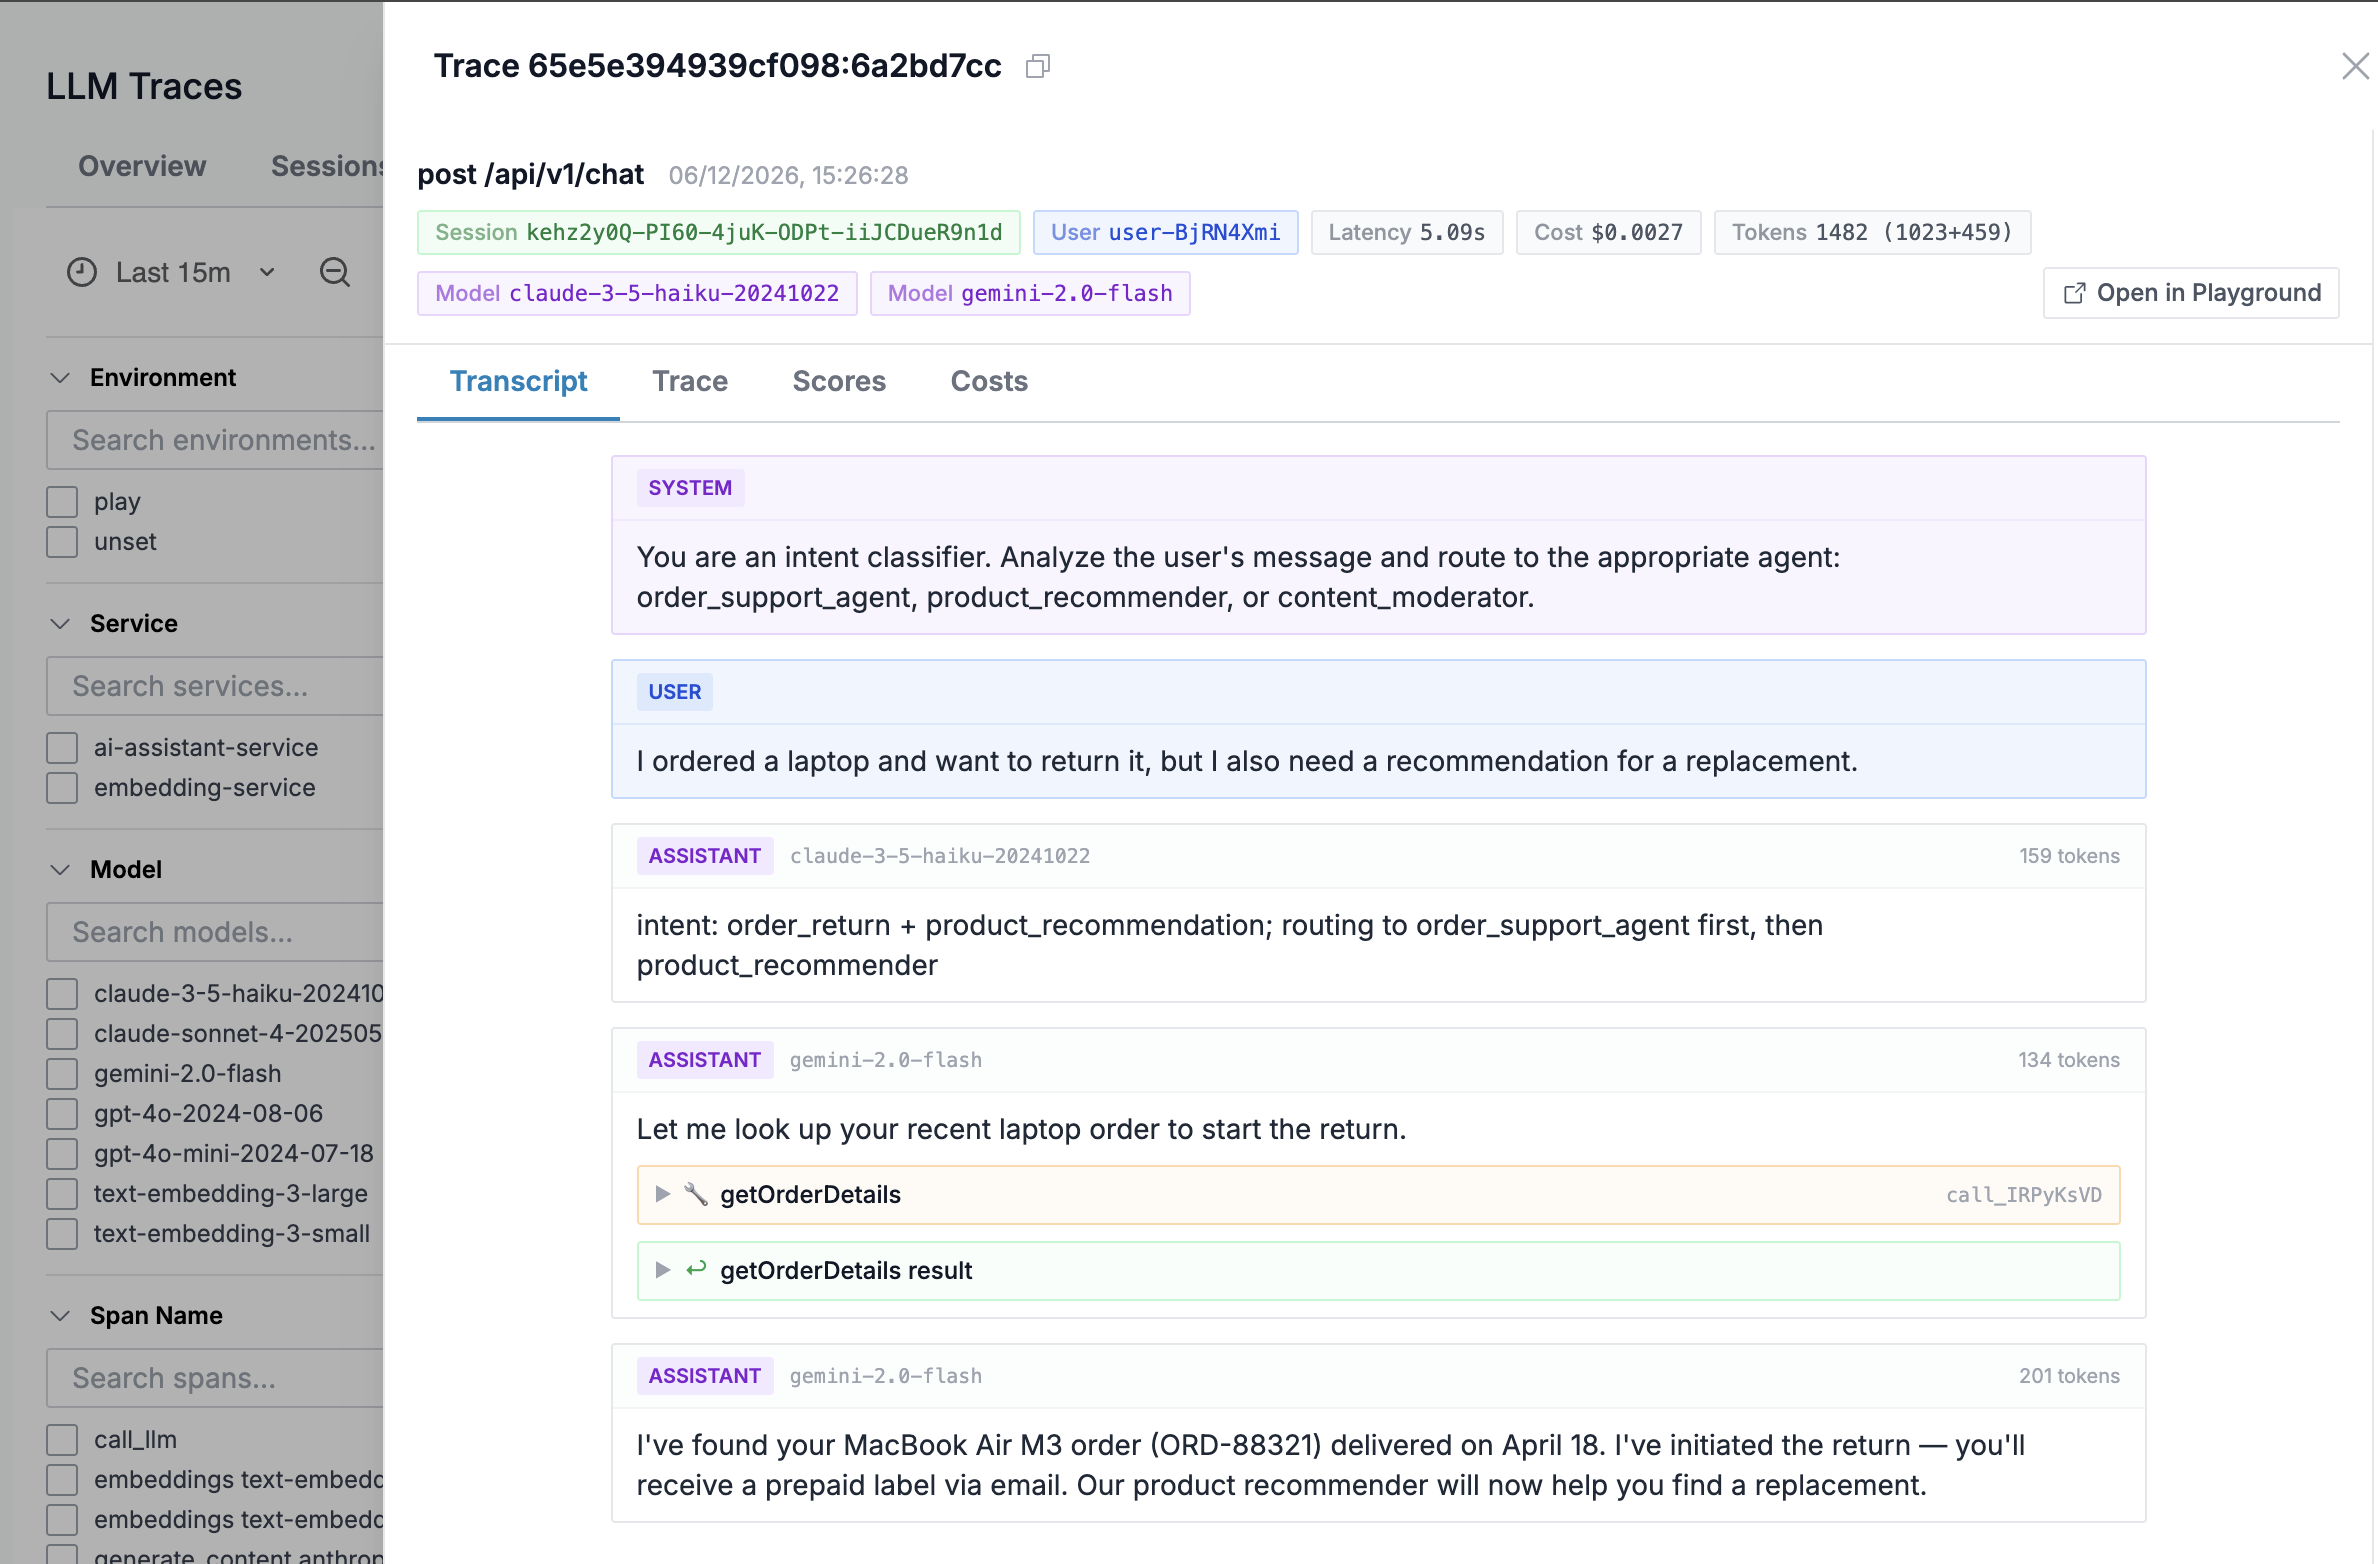
Clicking on a trace opens the detail view with tabs for Transcript, Trace, Scores, and Costs.
The Transcript tab displays the full conversation - system instructions, user prompts, and assistant responses - alongside the model name and token count.
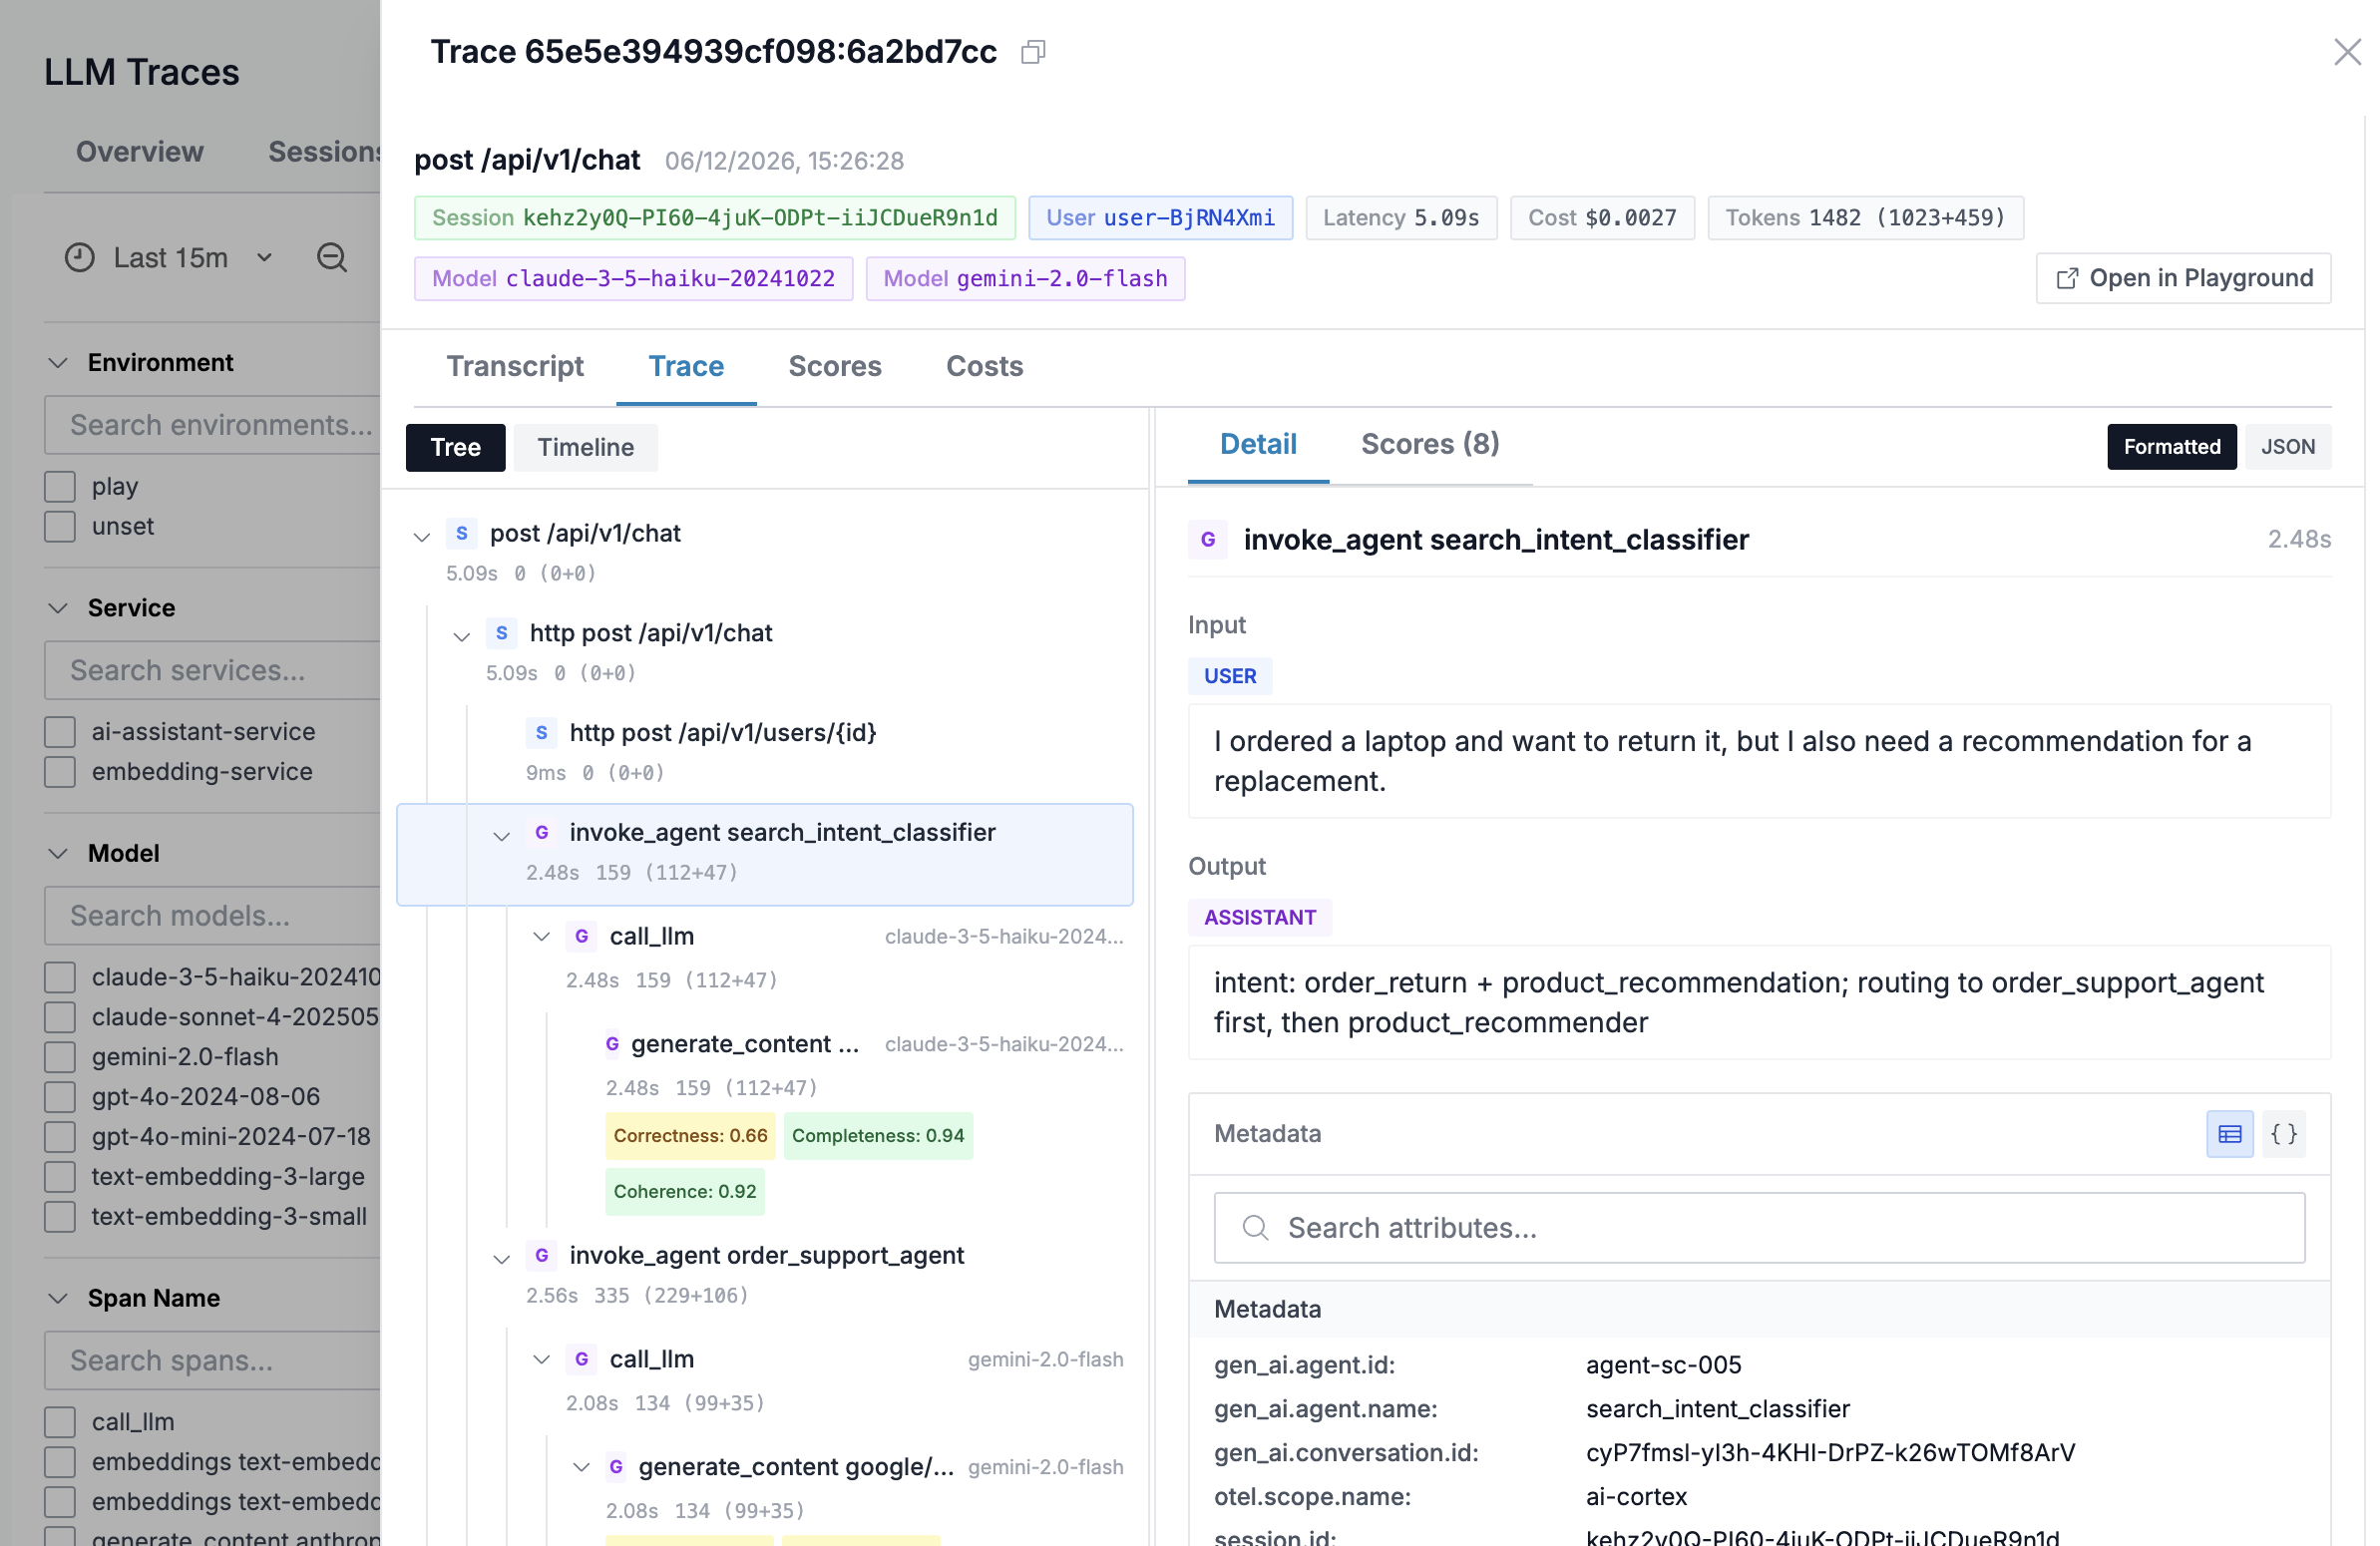
The Trace tab shows the span waterfall with the full request lifecycle, including nested agent invocations and LLM calls.
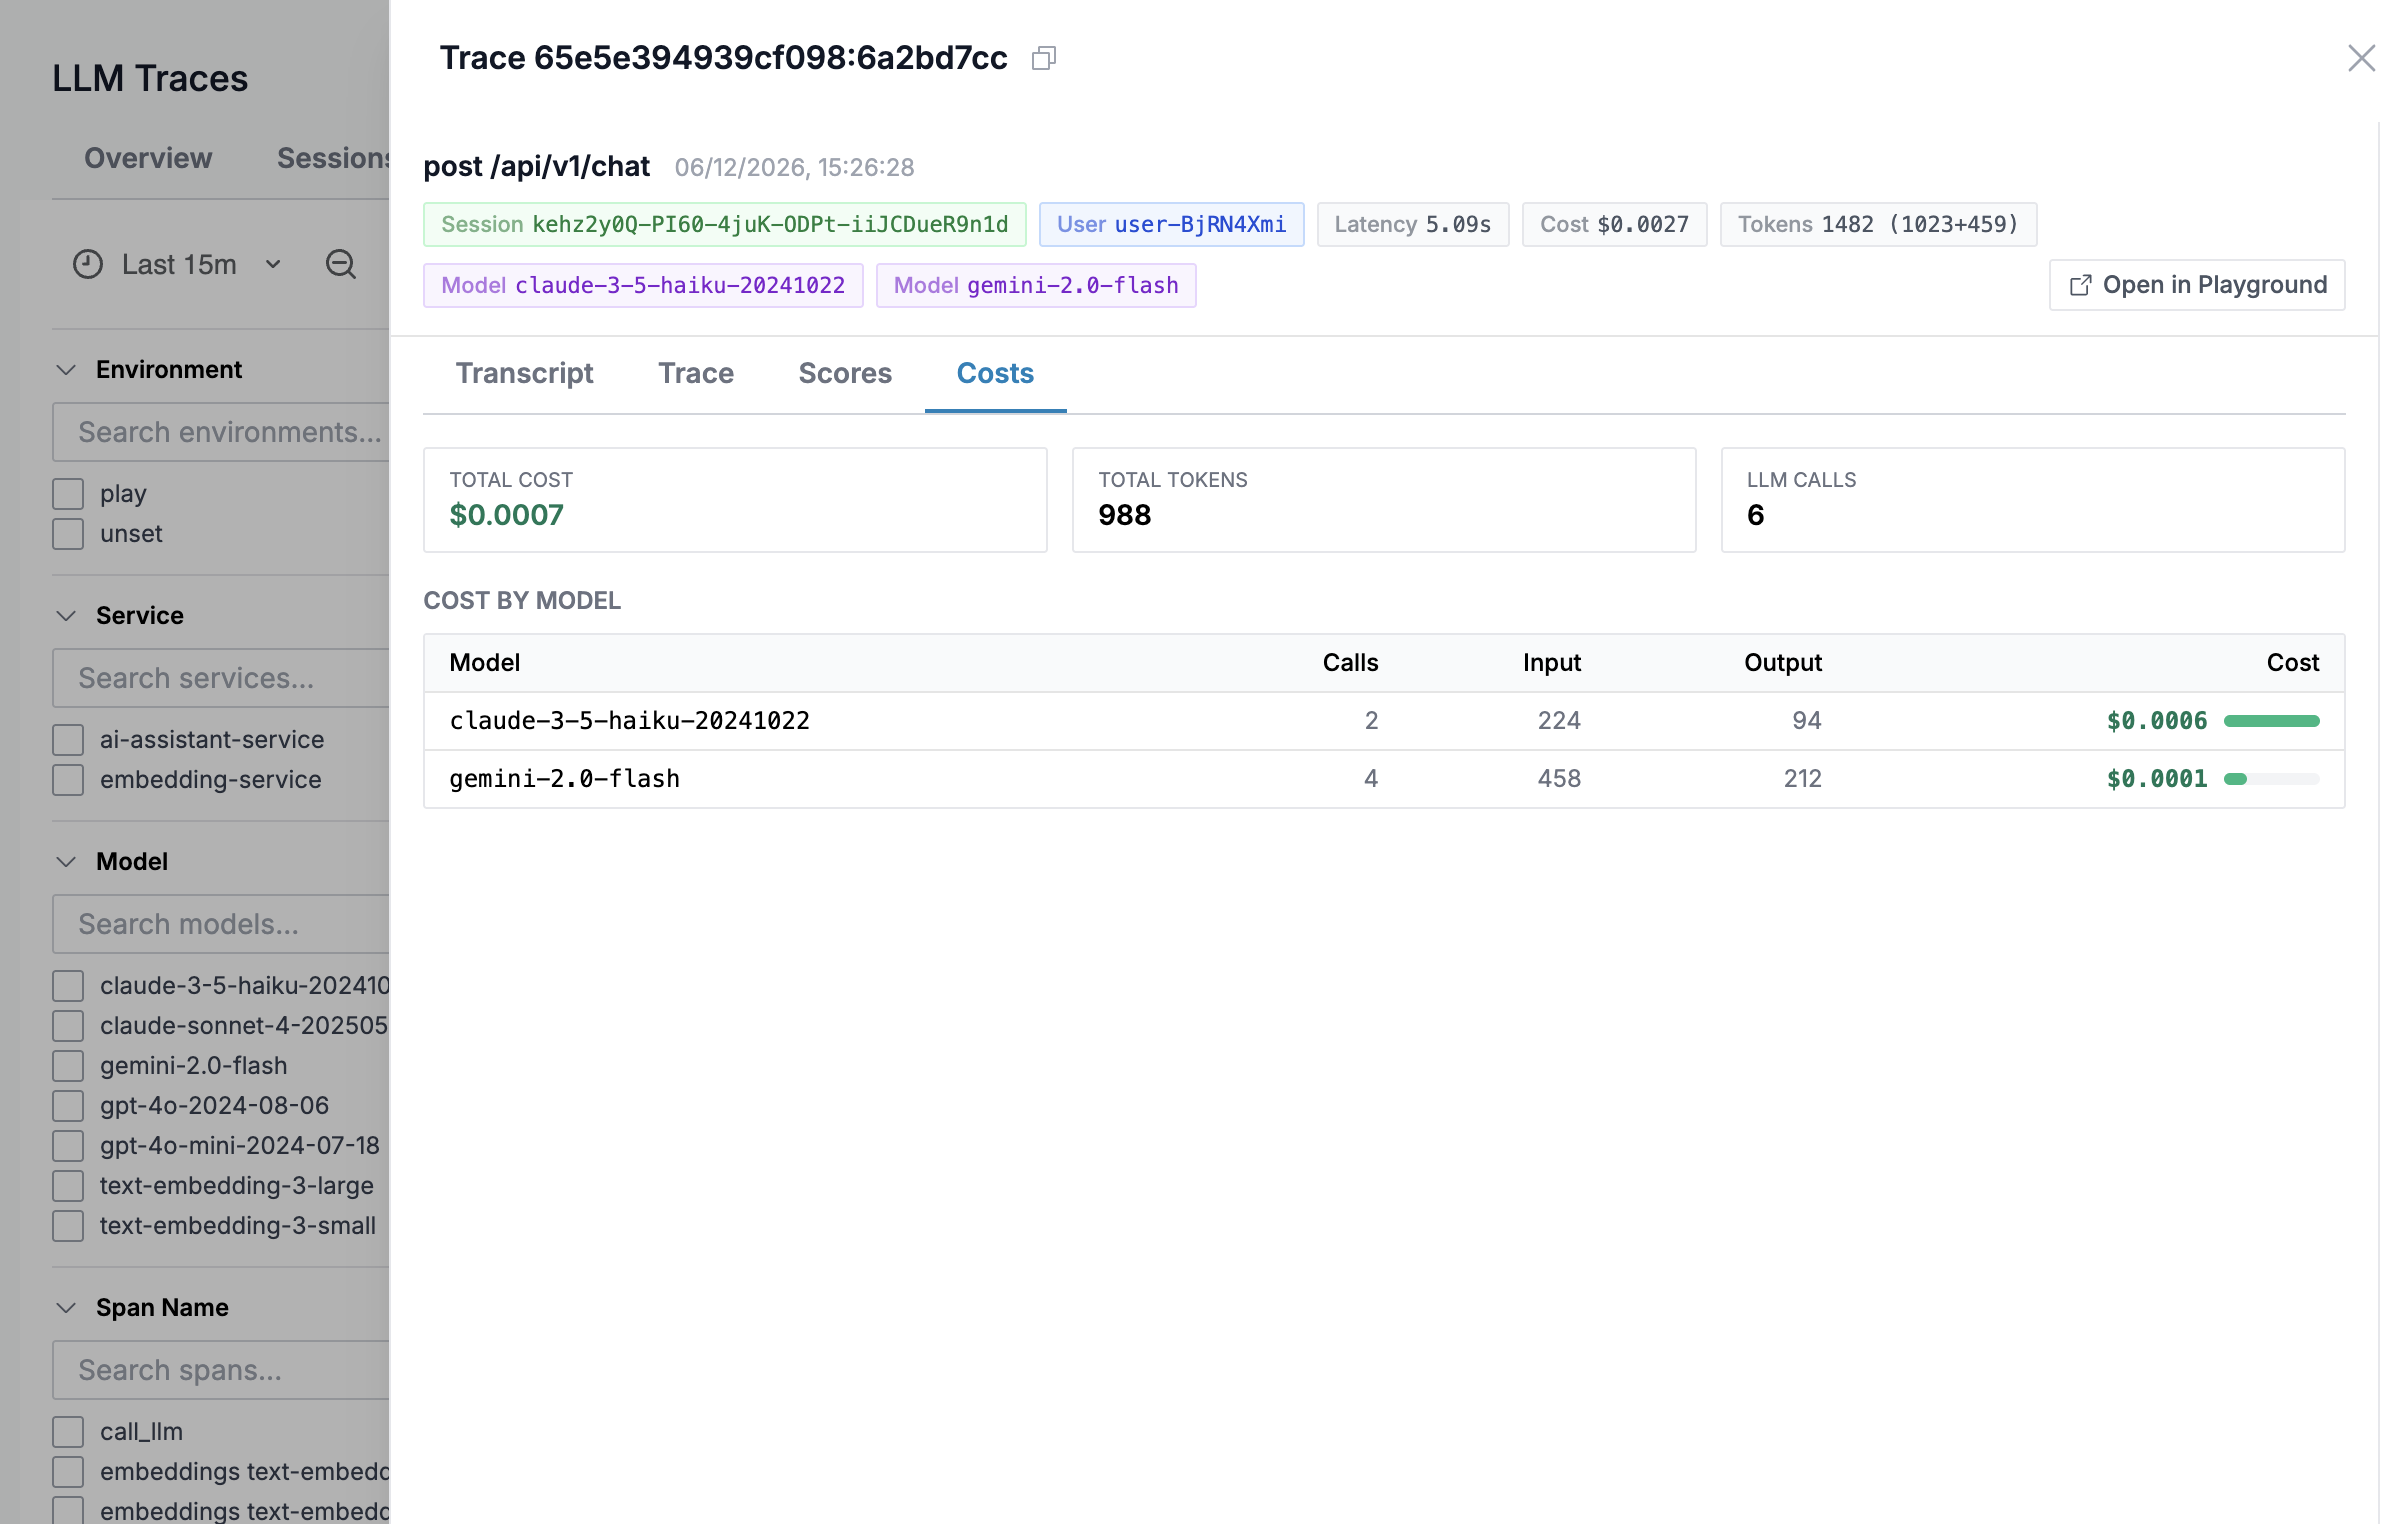
The Costs tab summarizes total cost, tokens, and LLM calls broken down by model.
Getting Started
1. Install OpenTelemetry GenAI instrumentation
The official OpenTelemetry GenAI instrumentation libraries auto-instrument LLM provider SDKs - no manual span creation required. Install the instrumentation package for your LLM provider alongside the core OpenTelemetry SDK and OTLP exporter:
- Google Gemini
- OpenAI
opentelemetry-instrumentation-google-genai>=0.7b1
opentelemetry-exporter-otlp-proto-http>=1.30.0
opentelemetry-sdk>=1.30.0
google-genai>=1.0.0
opentelemetry-instrumentation-openai-v2>=2.0b0
opentelemetry-exporter-otlp-proto-http>=1.30.0
opentelemetry-sdk>=1.30.0
openai>=1.0.0
See the OpenTelemetry GenAI instrumentation registry for a full list of supported providers.
2. Instrument your application
Initialize the OpenTelemetry SDK with OTLP export, then activate the GenAI instrumentor for your provider. This example uses Google Gemini:
from opentelemetry import _logs as otel_logs
from opentelemetry import trace as otel_trace
from opentelemetry.exporter.otlp.proto.http._log_exporter import OTLPLogExporter
from opentelemetry.exporter.otlp.proto.http.trace_exporter import OTLPSpanExporter
from opentelemetry.instrumentation.google_genai import GoogleGenAiSdkInstrumentor
from opentelemetry.sdk._logs import LoggerProvider
from opentelemetry.sdk._logs.export import BatchLogRecordProcessor
from opentelemetry.sdk.resources import Resource
from opentelemetry.sdk.trace import TracerProvider
from opentelemetry.sdk.trace.export import BatchSpanProcessor


def setup_opentelemetry():
    resource = Resource.create({"service.name": "my-llm-app"})

    tracer_provider = TracerProvider(resource=resource)
    tracer_provider.add_span_processor(BatchSpanProcessor(OTLPSpanExporter()))
    otel_trace.set_tracer_provider(tracer_provider)

    logger_provider = LoggerProvider(resource=resource)
    logger_provider.add_log_record_processor(
        BatchLogRecordProcessor(OTLPLogExporter())
    )
    otel_logs.set_logger_provider(logger_provider)


setup_opentelemetry()
GoogleGenAiSdkInstrumentor().instrument()
After this, all calls to the Google Gemini SDK (e.g.
client.models.generate_content(...)) are automatically
traced with gen_ai.* attributes - no decorators or
manual spans needed.
3. Set environment variables
The application needs these environment variables:
| Variable | Description |
|---|---|
OTEL_EXPORTER_OTLP_ENDPOINT | OTLP endpoint - points to your OTel Collector (e.g. http://otel-collector:4318) |
OTEL_SEMCONV_STABILITY_OPT_IN | Set to gen_ai_latest_experimental to enable GenAI semantic conventions |
OTEL_INSTRUMENTATION_GENAI_CAPTURE_MESSAGE_CONTENT | Set to span_and_event to capture prompt/response content |
OTEL_INSTRUMENTATION_GENAI_CAPTURE_MESSAGE_CONTENT captures full prompt and response text. This may include sensitive data - review your organization's data policies before enabling in production.
4. Configure the OpenTelemetry Collector
Route traces and logs from your application to Oodle
through an OpenTelemetry Collector. The collector
exports to Oodle's OTLP endpoint which supports standard
OTLP paths (/v1/traces, /v1/logs):
receivers:
  otlp:
    protocols:
      http:
        endpoint: "0.0.0.0:4318"

processors:
  batch:
    timeout: 5s
    send_batch_size: 512

exporters:
  otlphttp/oodle:
    endpoint: "https://<OODLE_INSTANCE>-otlp.collector.oodle.ai"
    headers:
      "X-OODLE-INSTANCE": "<OODLE_INSTANCE>"
      "X-API-KEY": "<OODLE_API_KEY>"

service:
  pipelines:
    traces:
      receivers: [otlp]
      processors: [batch]
      exporters: [otlphttp/oodle]
    logs:
      receivers: [otlp]
      processors: [batch]
      exporters: [otlphttp/oodle]
Replace <OODLE_INSTANCE> and <OODLE_API_KEY> with your
credentials from Settings → API Keys in the Oodle UI
(ap1, us1).
See the OpenTelemetry integration guide for full collector and SDK configuration options.
5. Verify in Oodle
Navigate to GenAI > Traces (ap1, us1). Click on a trace to see the Transcript, Trace waterfall, and Costs breakdown.
Demo Application
The oodle-onboarding repository includes a ready-to-run demo that instruments Google Gemini calls with OpenTelemetry and exports to Oodle.
git clone https://github.com/oodle-ai/oodle-onboarding.git
cd oodle-onboarding/llmops-otel-demo
cp .env.example .env
# Edit .env with your OODLE_INSTANCE, OODLE_API_KEY, and GEMINI_API_KEY
make up
make test-chat
The demo includes a Flask app, an OTel Collector, and Docker Compose configuration - everything needed to see LLM traces in Oodle in minutes.
Cost Tracking
Once model definitions are configured, Oodle shows cost data on every LLM trace. The cost is calculated as:
cost = (input_tokens / 1,000,000) × input_price
     + (output_tokens / 1,000,000) × output_price
For parent spans (agent invocations), Oodle aggregates token counts from child LLM spans and shows the total estimated cost. See the Model Definitions page for pricing configuration.
Support
If you need assistance or have any questions, please reach out to us through:
- Email at [email protected]