Metrics Explore
Metrics Explore is an interactive query workbench for running ad-hoc PromQL queries against your metrics data. Use it to investigate metric behavior, prototype dashboard queries, and troubleshoot issues in real time.
Getting Started
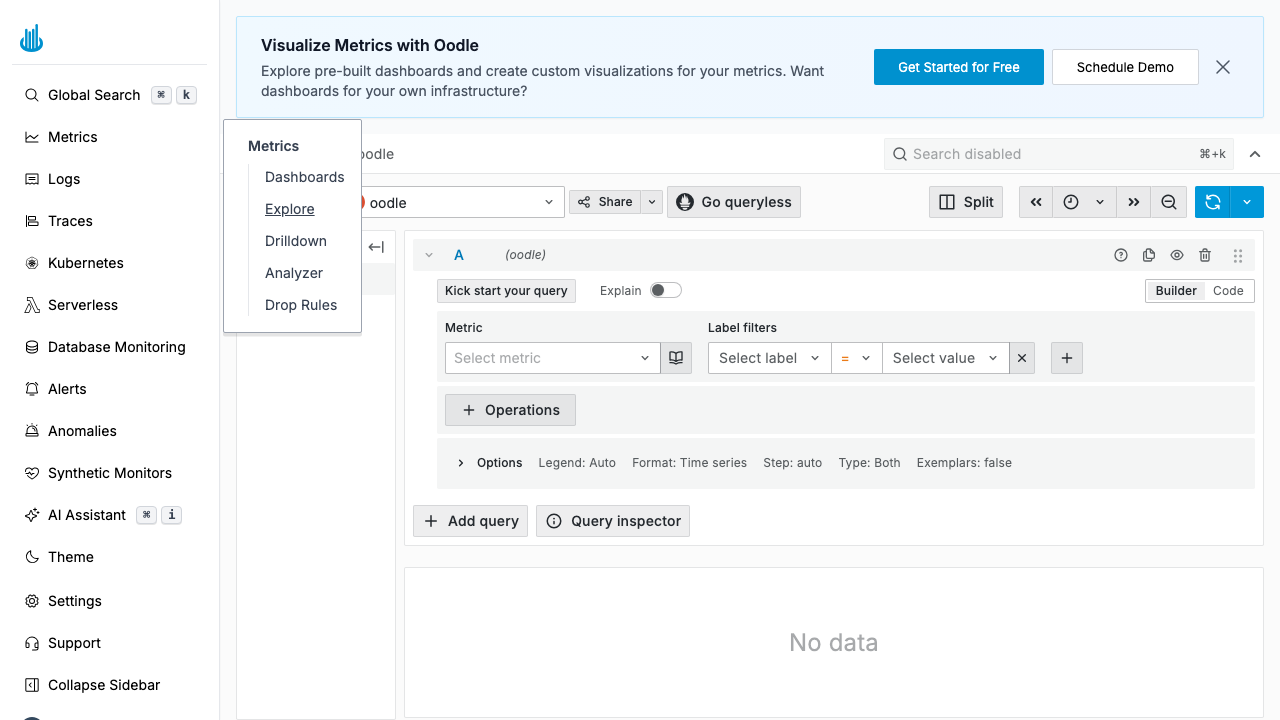
Navigate to Metrics → Explore in the sidebar. The Explore page opens with an empty query panel ready for you to build or type a PromQL query.
Query Modes
Explore supports two modes for composing queries, toggled via the Builder / Code switch in the top-right of the query panel.
Builder Mode
Builder mode provides a guided, form-based experience:
- Metric — Select the metric name from a searchable dropdown. Click the book icon next to the dropdown to browse available metrics.
- Label Filters — Narrow results by adding one or more label
matchers. Choose a label, an operator (
=,!=,=~,!~), and a value. - Operations — Click + Operations to apply PromQL
functions such as
rate(),sum(),avg(),histogram_quantile(), and more. Operations are added as visual blocks that you can reorder or remove.
Code Mode
Code mode gives you a raw PromQL editor with syntax highlighting and autocompletion. Use it when you need full control over the query expression.
Query Options
Expand the Options row beneath the query to fine-tune how results are returned:
| Option | Description |
|---|---|
| Legend | Template for series legend labels (default: Auto) |
| Format | Result format — Time series, Table, Heatmap |
| Step | Evaluation step / resolution (default: auto) |
| Type | Query type — Range, Instant, or Both |
Running Queries
- Click the Run query button (or press Shift + Enter) to execute the query.
- Results render as a time-series graph by default. Switch to Table format in the Options to see raw data points.
Additional Features
Kick Start Your Query
Click Kick start your query to see a curated list of common query templates. This is a quick way to get started if you are not sure which metric or function to use.
Explain
Toggle Explain to see a plain-English breakdown of what the current PromQL expression does, step by step.
Multiple Queries
Click + Add query to add additional query panels. Each query is assigned a letter (A, B, C, …) and results are overlaid on the same graph, making it easy to compare metrics side by side.
Split View
Click the Split button in the toolbar to open a second Explore pane. This is useful for correlating metrics across different datasources or time ranges.
Share
Use the Share button to copy a short link to the current Explore state, including the query, time range, and options. Share it with teammates for collaborative debugging.
Time Range Controls
The toolbar provides time-range navigation:
- Time picker — Select a preset range or enter a custom absolute / relative range.
- Back / Forward arrows — Shift the time window.
- Zoom out — Widen the visible time window.
Best Practices
- Start with Builder mode if you are new to PromQL. It prevents syntax errors and helps you discover available metrics and labels.
- Use label filters early to keep result sets small and queries fast.
- Leverage
rate()andincrease()for counter metrics instead of plotting raw values. - Check Query Inspector when a query is slow — it shows the number of series returned and backend execution time.
- Prototype here, then copy to dashboards — once your query looks good, copy the PromQL expression into a dashboard panel.
Related Pages
- Metrics Drilldown — Browse metrics visually without writing PromQL.
- Metrics Analyzer — Understand cardinality and usage of your metrics.
Support
If you need assistance or have any questions, please reach out to us through:
- Email at [email protected]