GPU Monitoring
Oodle's GPU Monitoring gives you full visibility into
your GPU fleet — utilization, memory allocation,
temperature, power draw, and per-process resource
consumption. Works with NVIDIA GPUs using either the
nvidia_gpu_exporter (nvidia-smi based) or
dcgm-exporter.
Overview Tab
The Overview tab provides a high-level health summary of your entire GPU fleet.
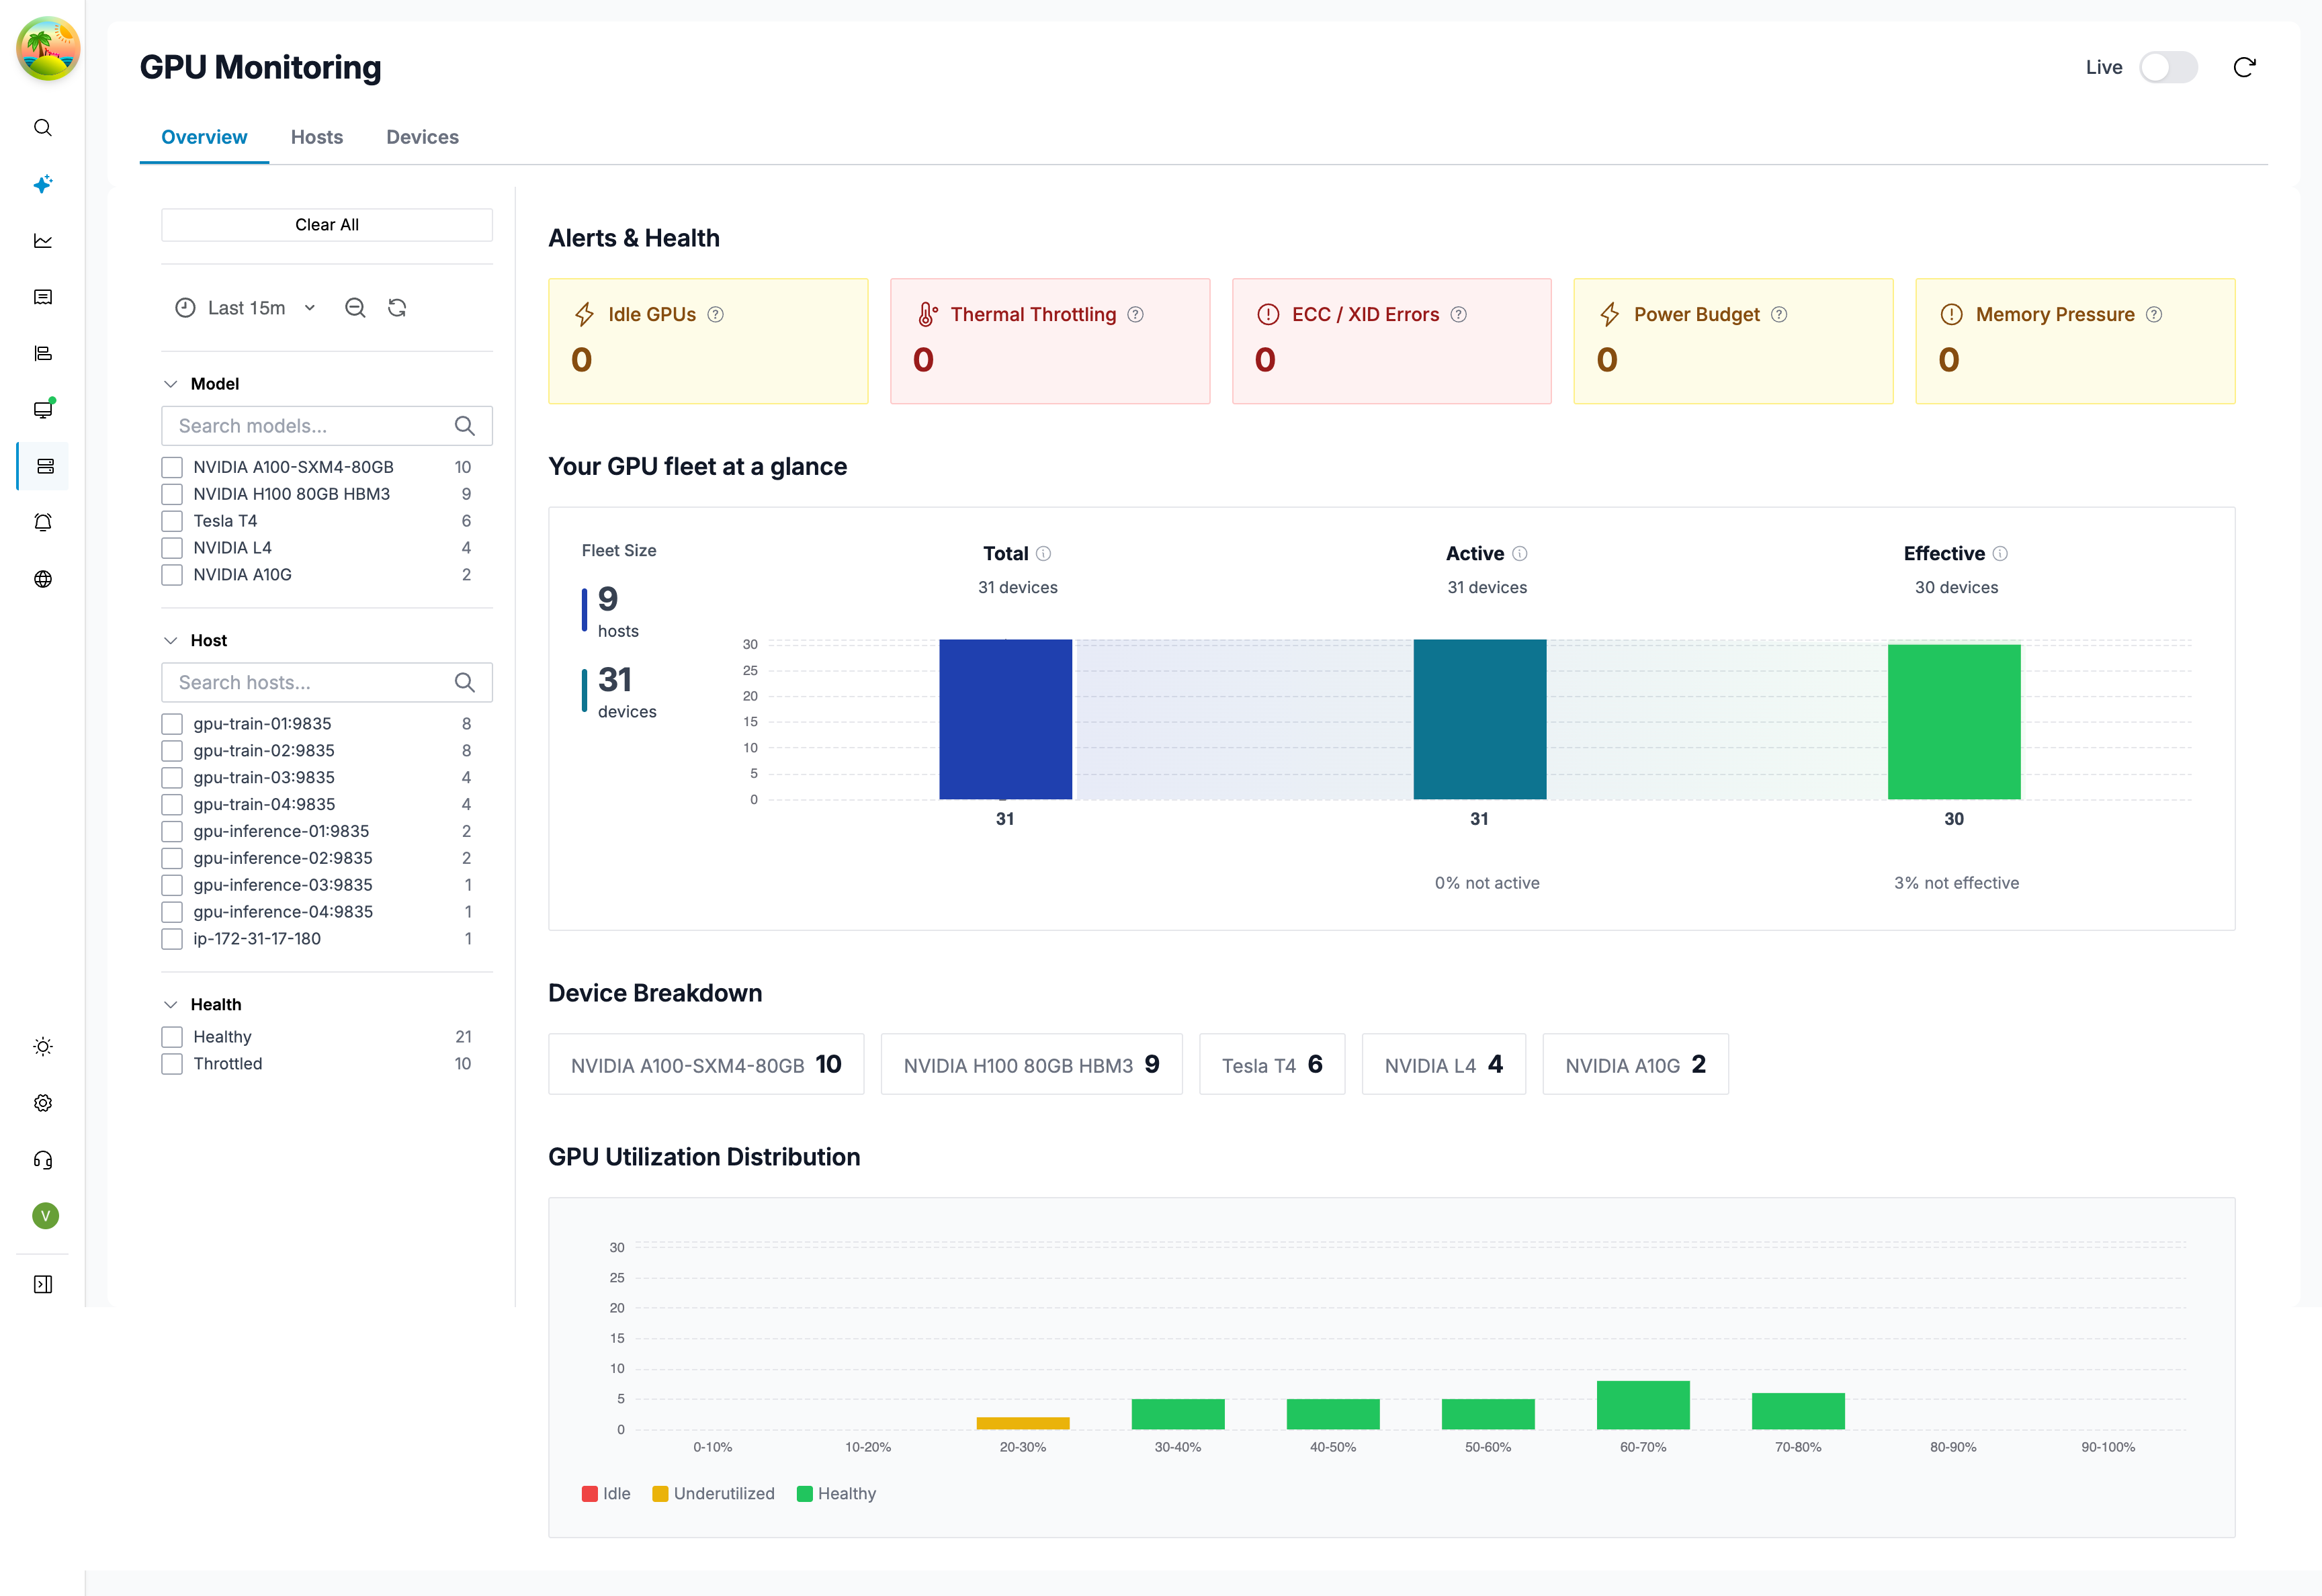
Summary Cards
| Card | Description |
|---|---|
| Total GPUs | Number of monitored GPU devices |
| Active GPUs | GPUs with utilization > 5% |
| Total Hosts | Number of hosts with GPUs |
| Avg Utilization | Fleet-wide average GPU utilization |
Alerts & Health
| Alert | Trigger |
|---|---|
| Idle GPUs | Devices with < 5% utilization |
| Thermal Throttling | Devices with active thermal throttle or temp ≥ 85°C |
| ECC / XID Errors | Devices reporting memory or XID errors |
| PCIe Degradation | Active devices with zero PCIe throughput |
Hosts Tab
The Hosts tab lists every host that has at least one GPU installed.
| Column | Description |
|---|---|
| Host | Hostname (instance label) |
| Device | GPU model name |
| Health | Healthy, Throttled, or Error state |
| Active | Number of active / total GPUs |
| CPU | Host CPU utilization % |
| Memory | Host system memory utilization % |
| GPU | Average GPU compute utilization % |
| GPU Mem | Average GPU VRAM allocation % |
| ECC | ECC error count |
| XID | XID error count |
Click any host row to open a detail drawer with devices, processes, and embedded Grafana dashboards.
Devices Tab
The Devices tab lists every individual GPU device across all hosts.
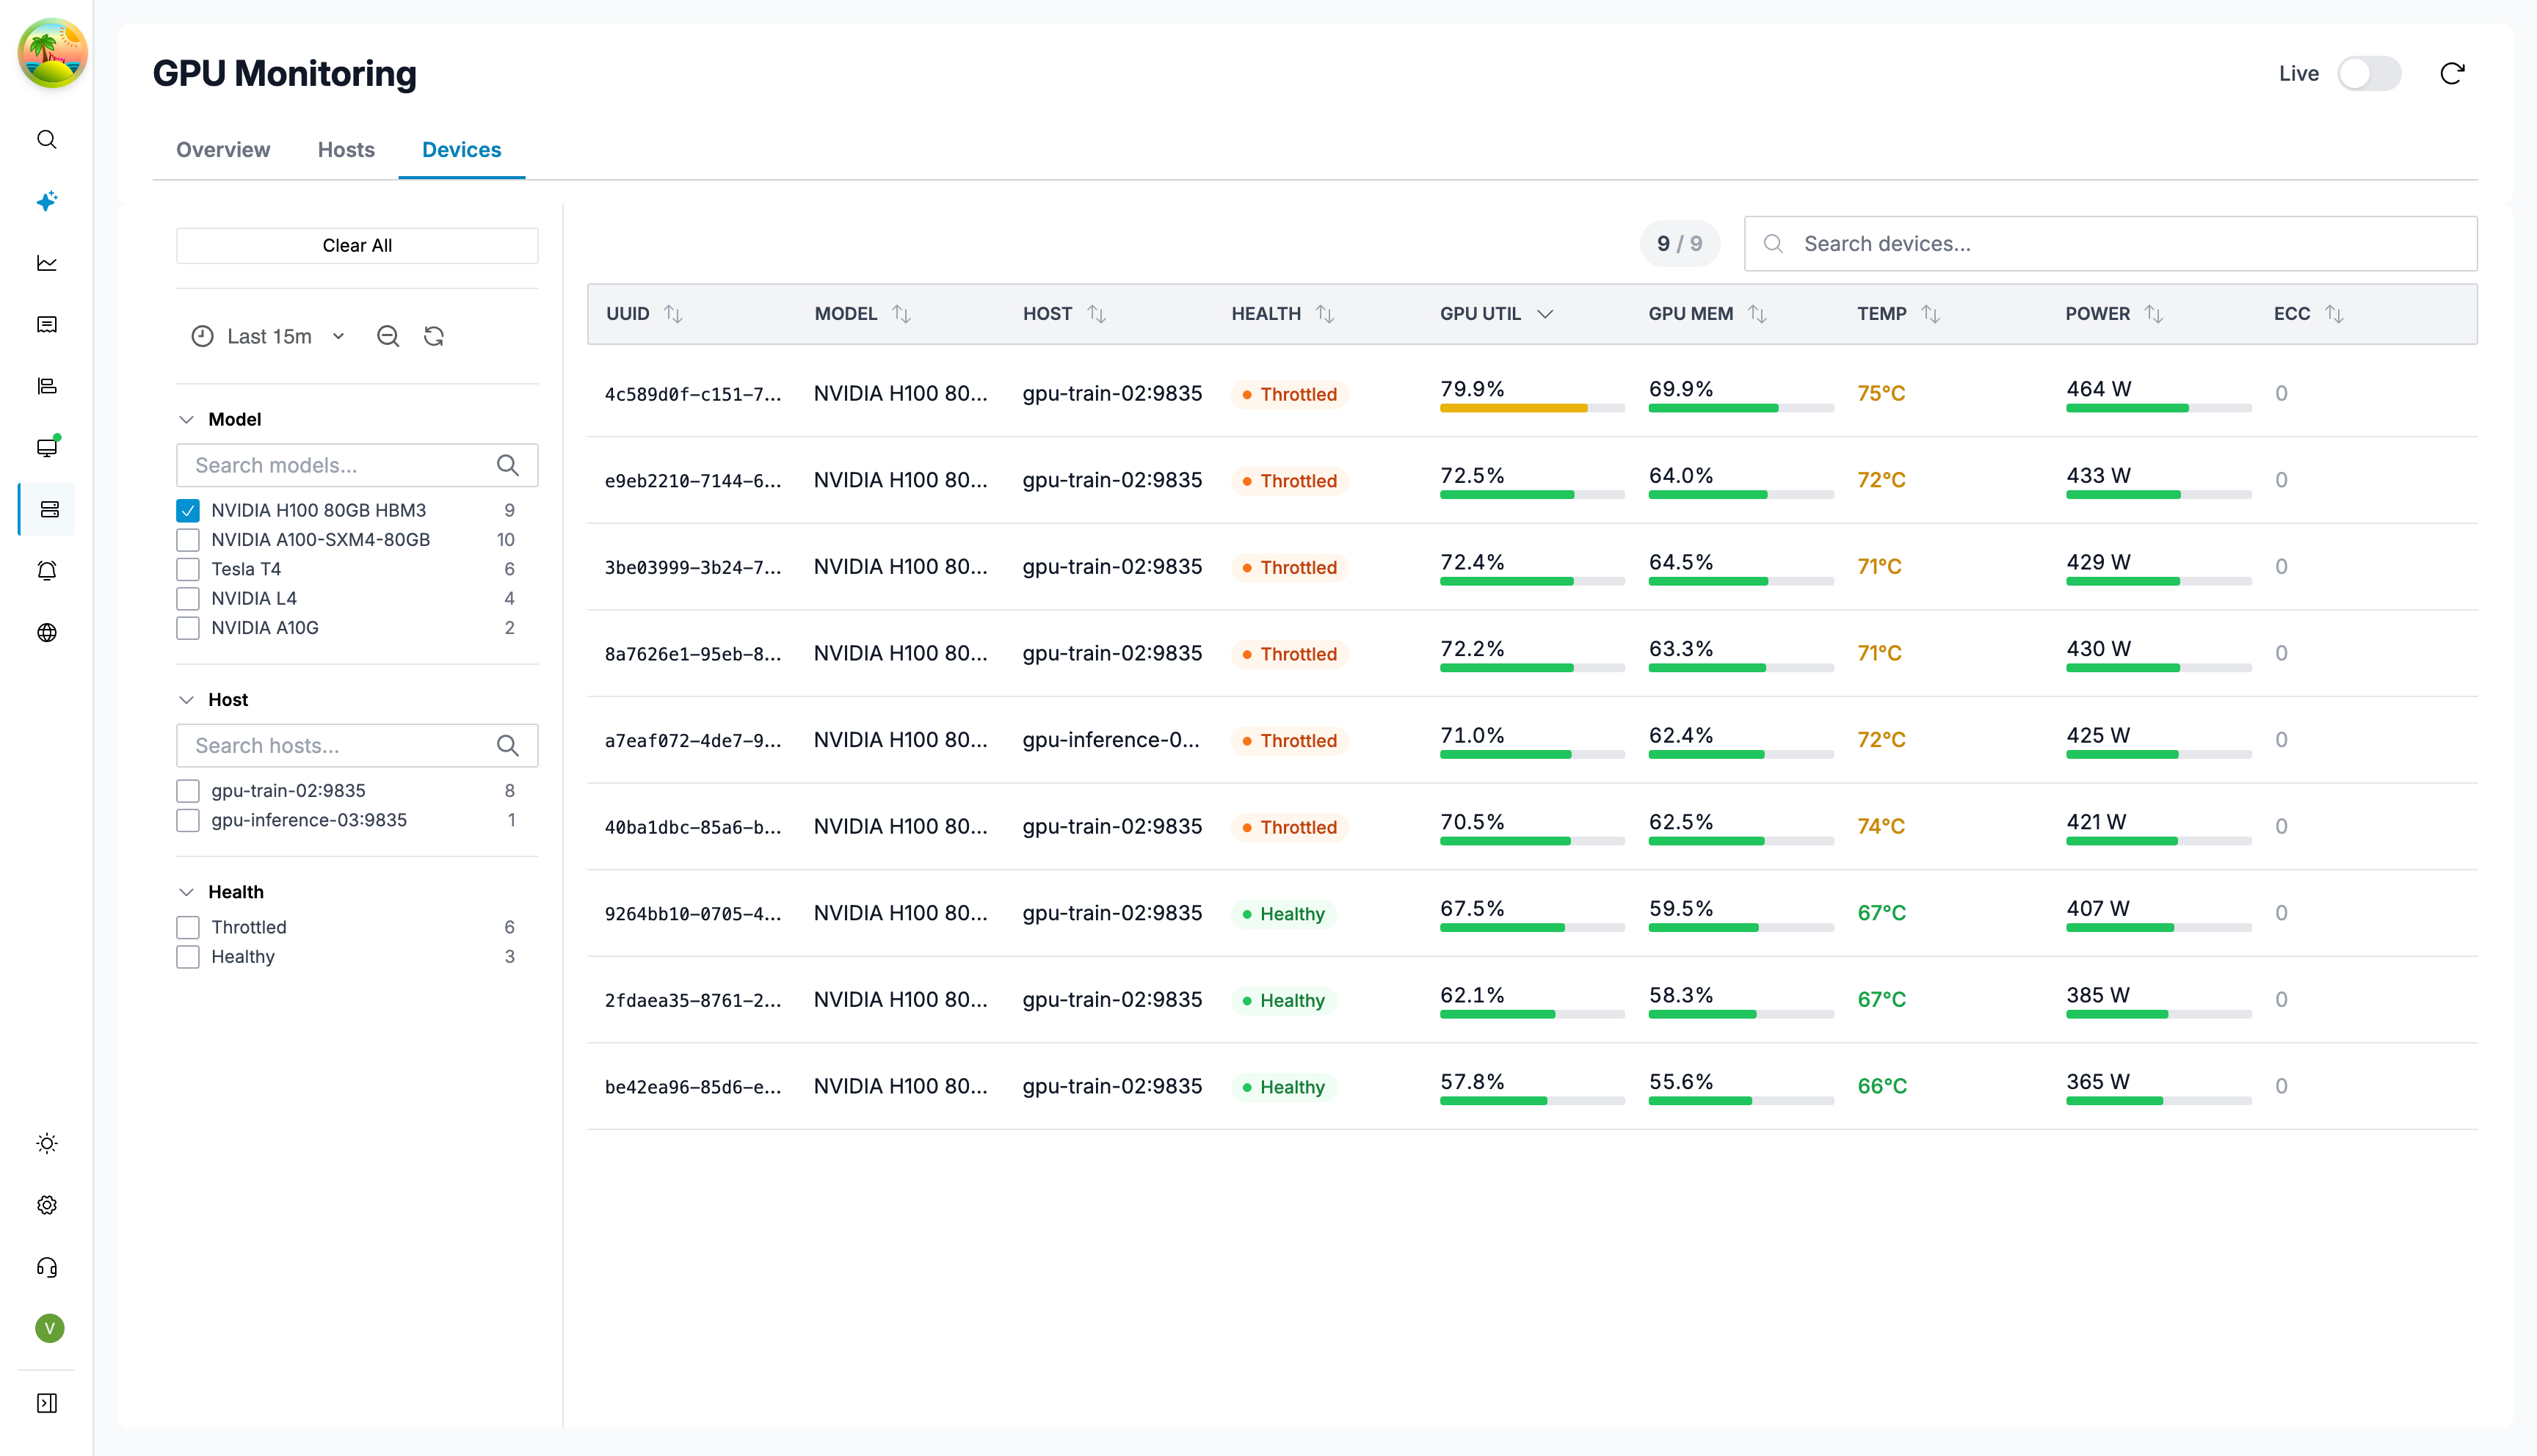
| Column | Description |
|---|---|
| UUID | GPU device UUID |
| Model | GPU model name |
| Host | Host the GPU is installed in |
| Health | Health status |
| GPU Util | Compute utilization % |
| GPU Mem | VRAM allocation % |
| Temp | Current temperature in °C |
| Power | Current power draw in watts |
| ECC | ECC error count |
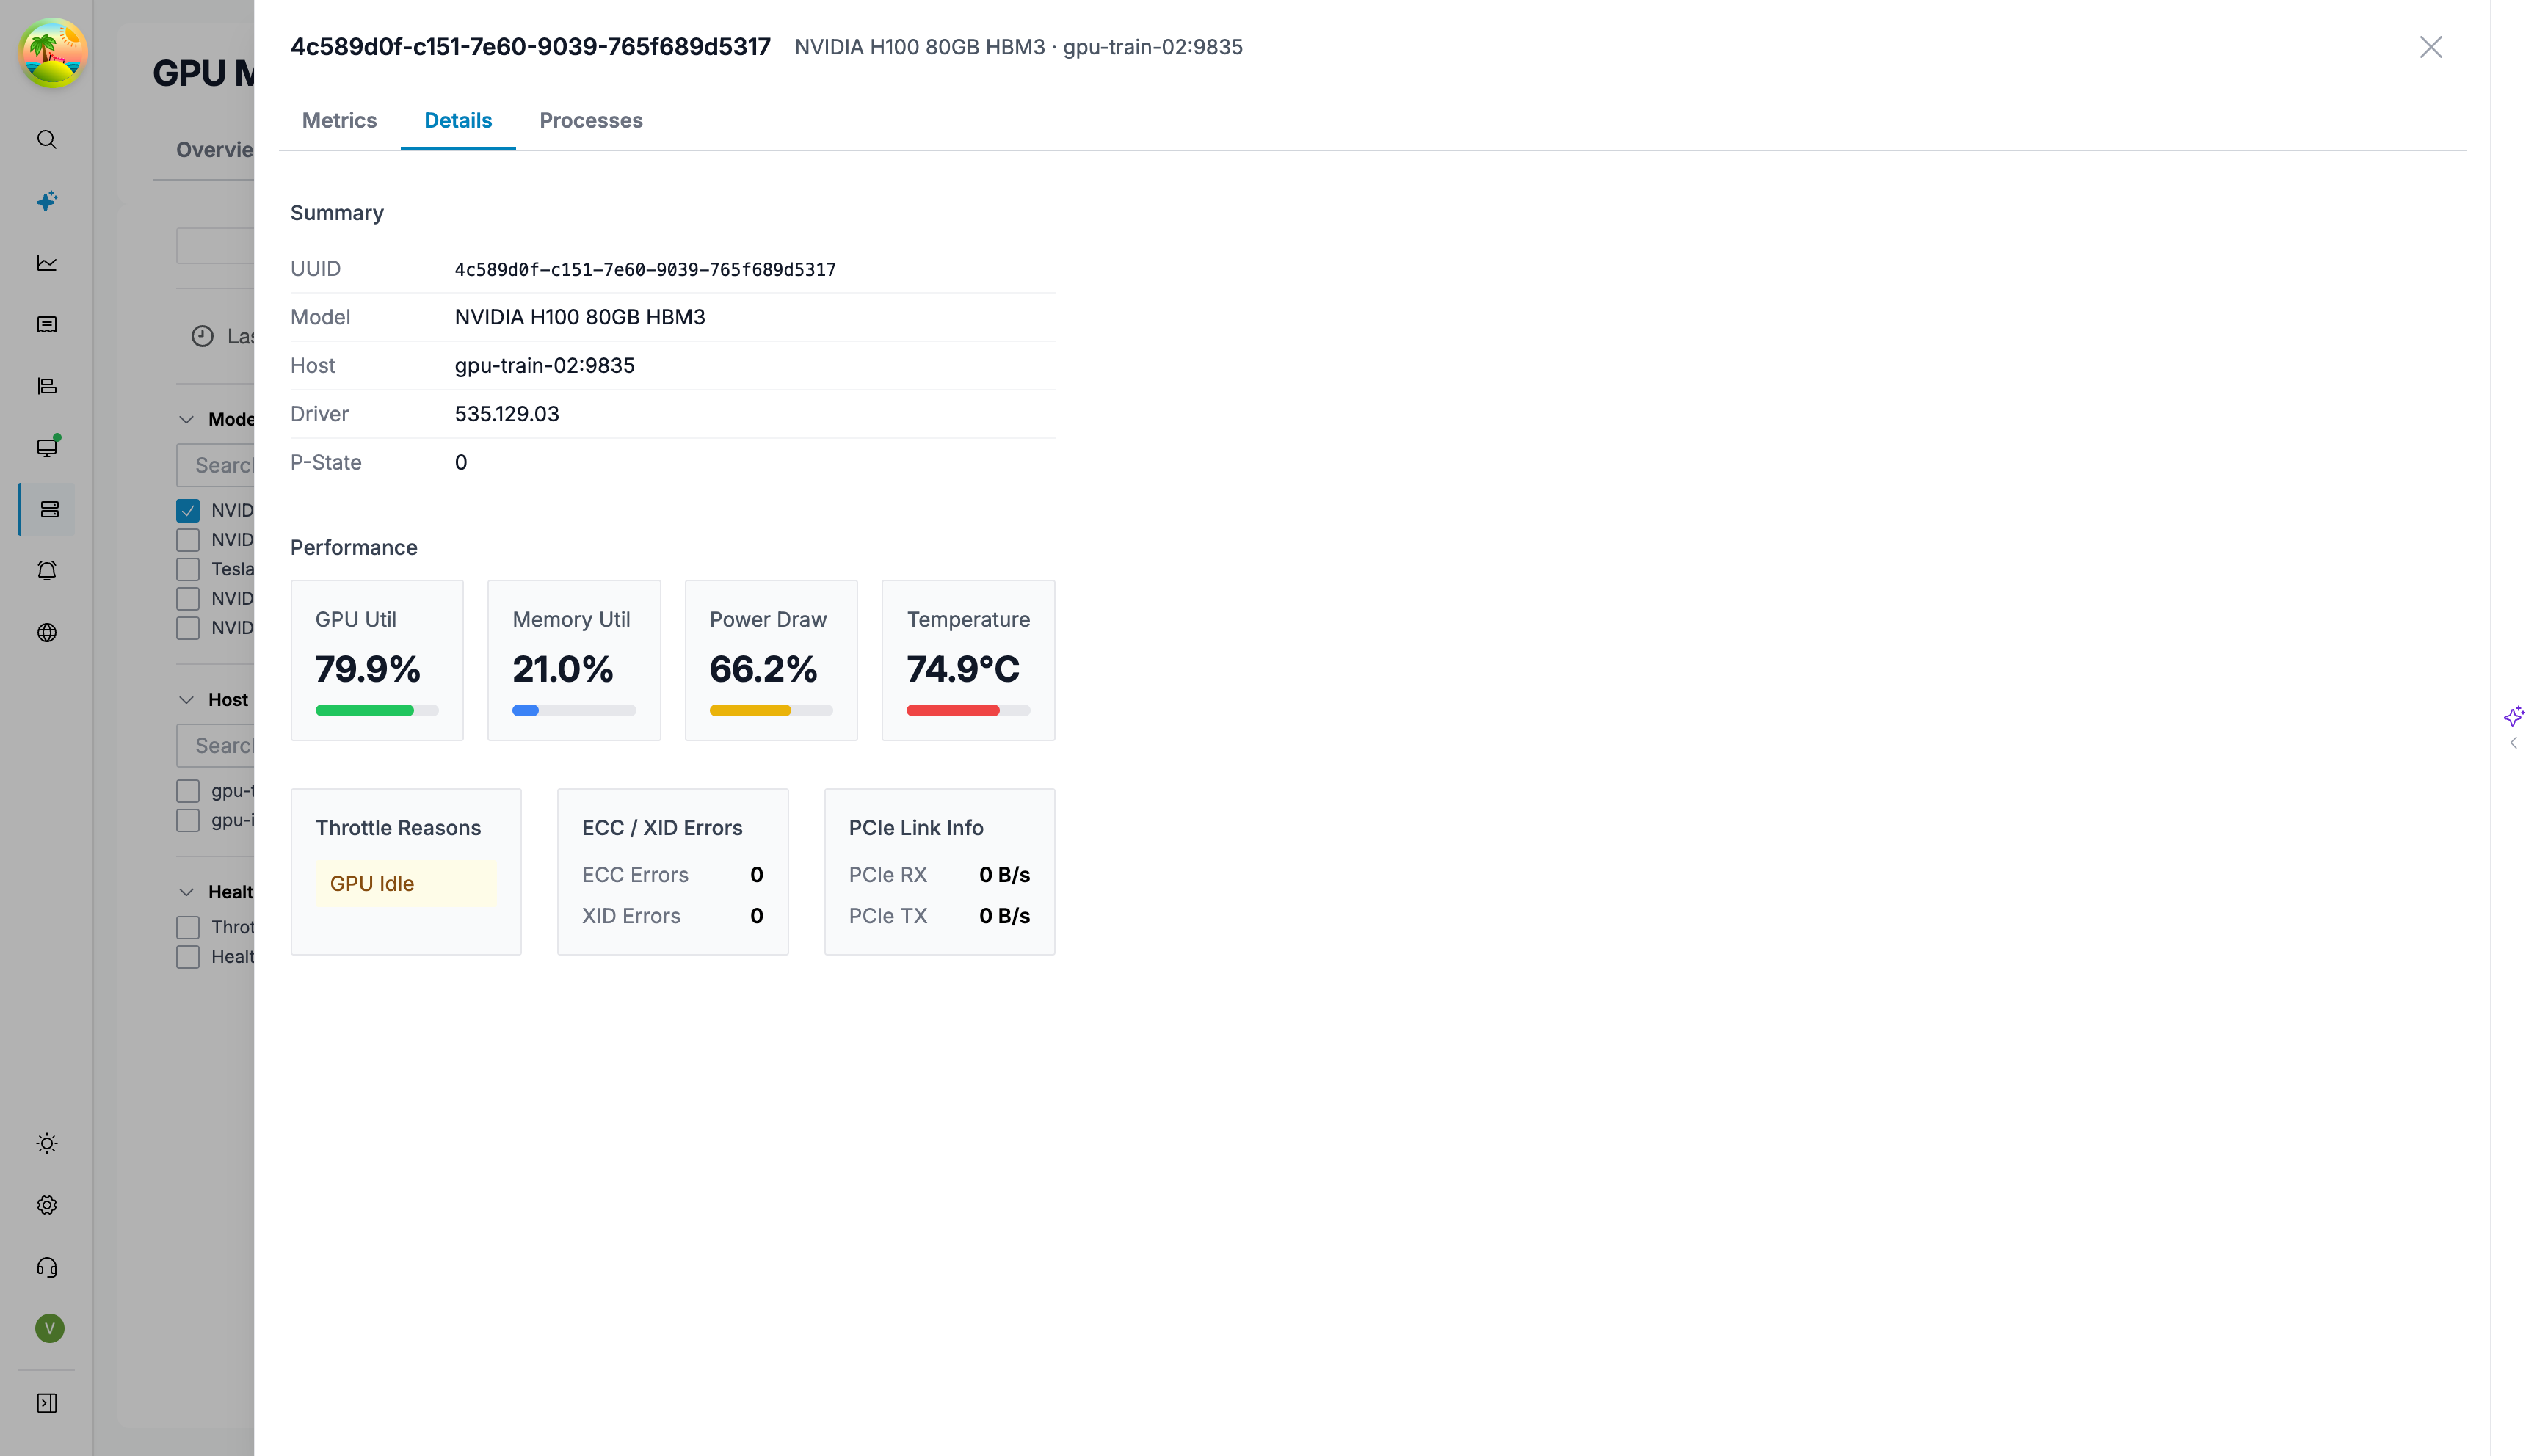
Click any device row to open a detail drawer with GPU-specific Grafana dashboards and process information.
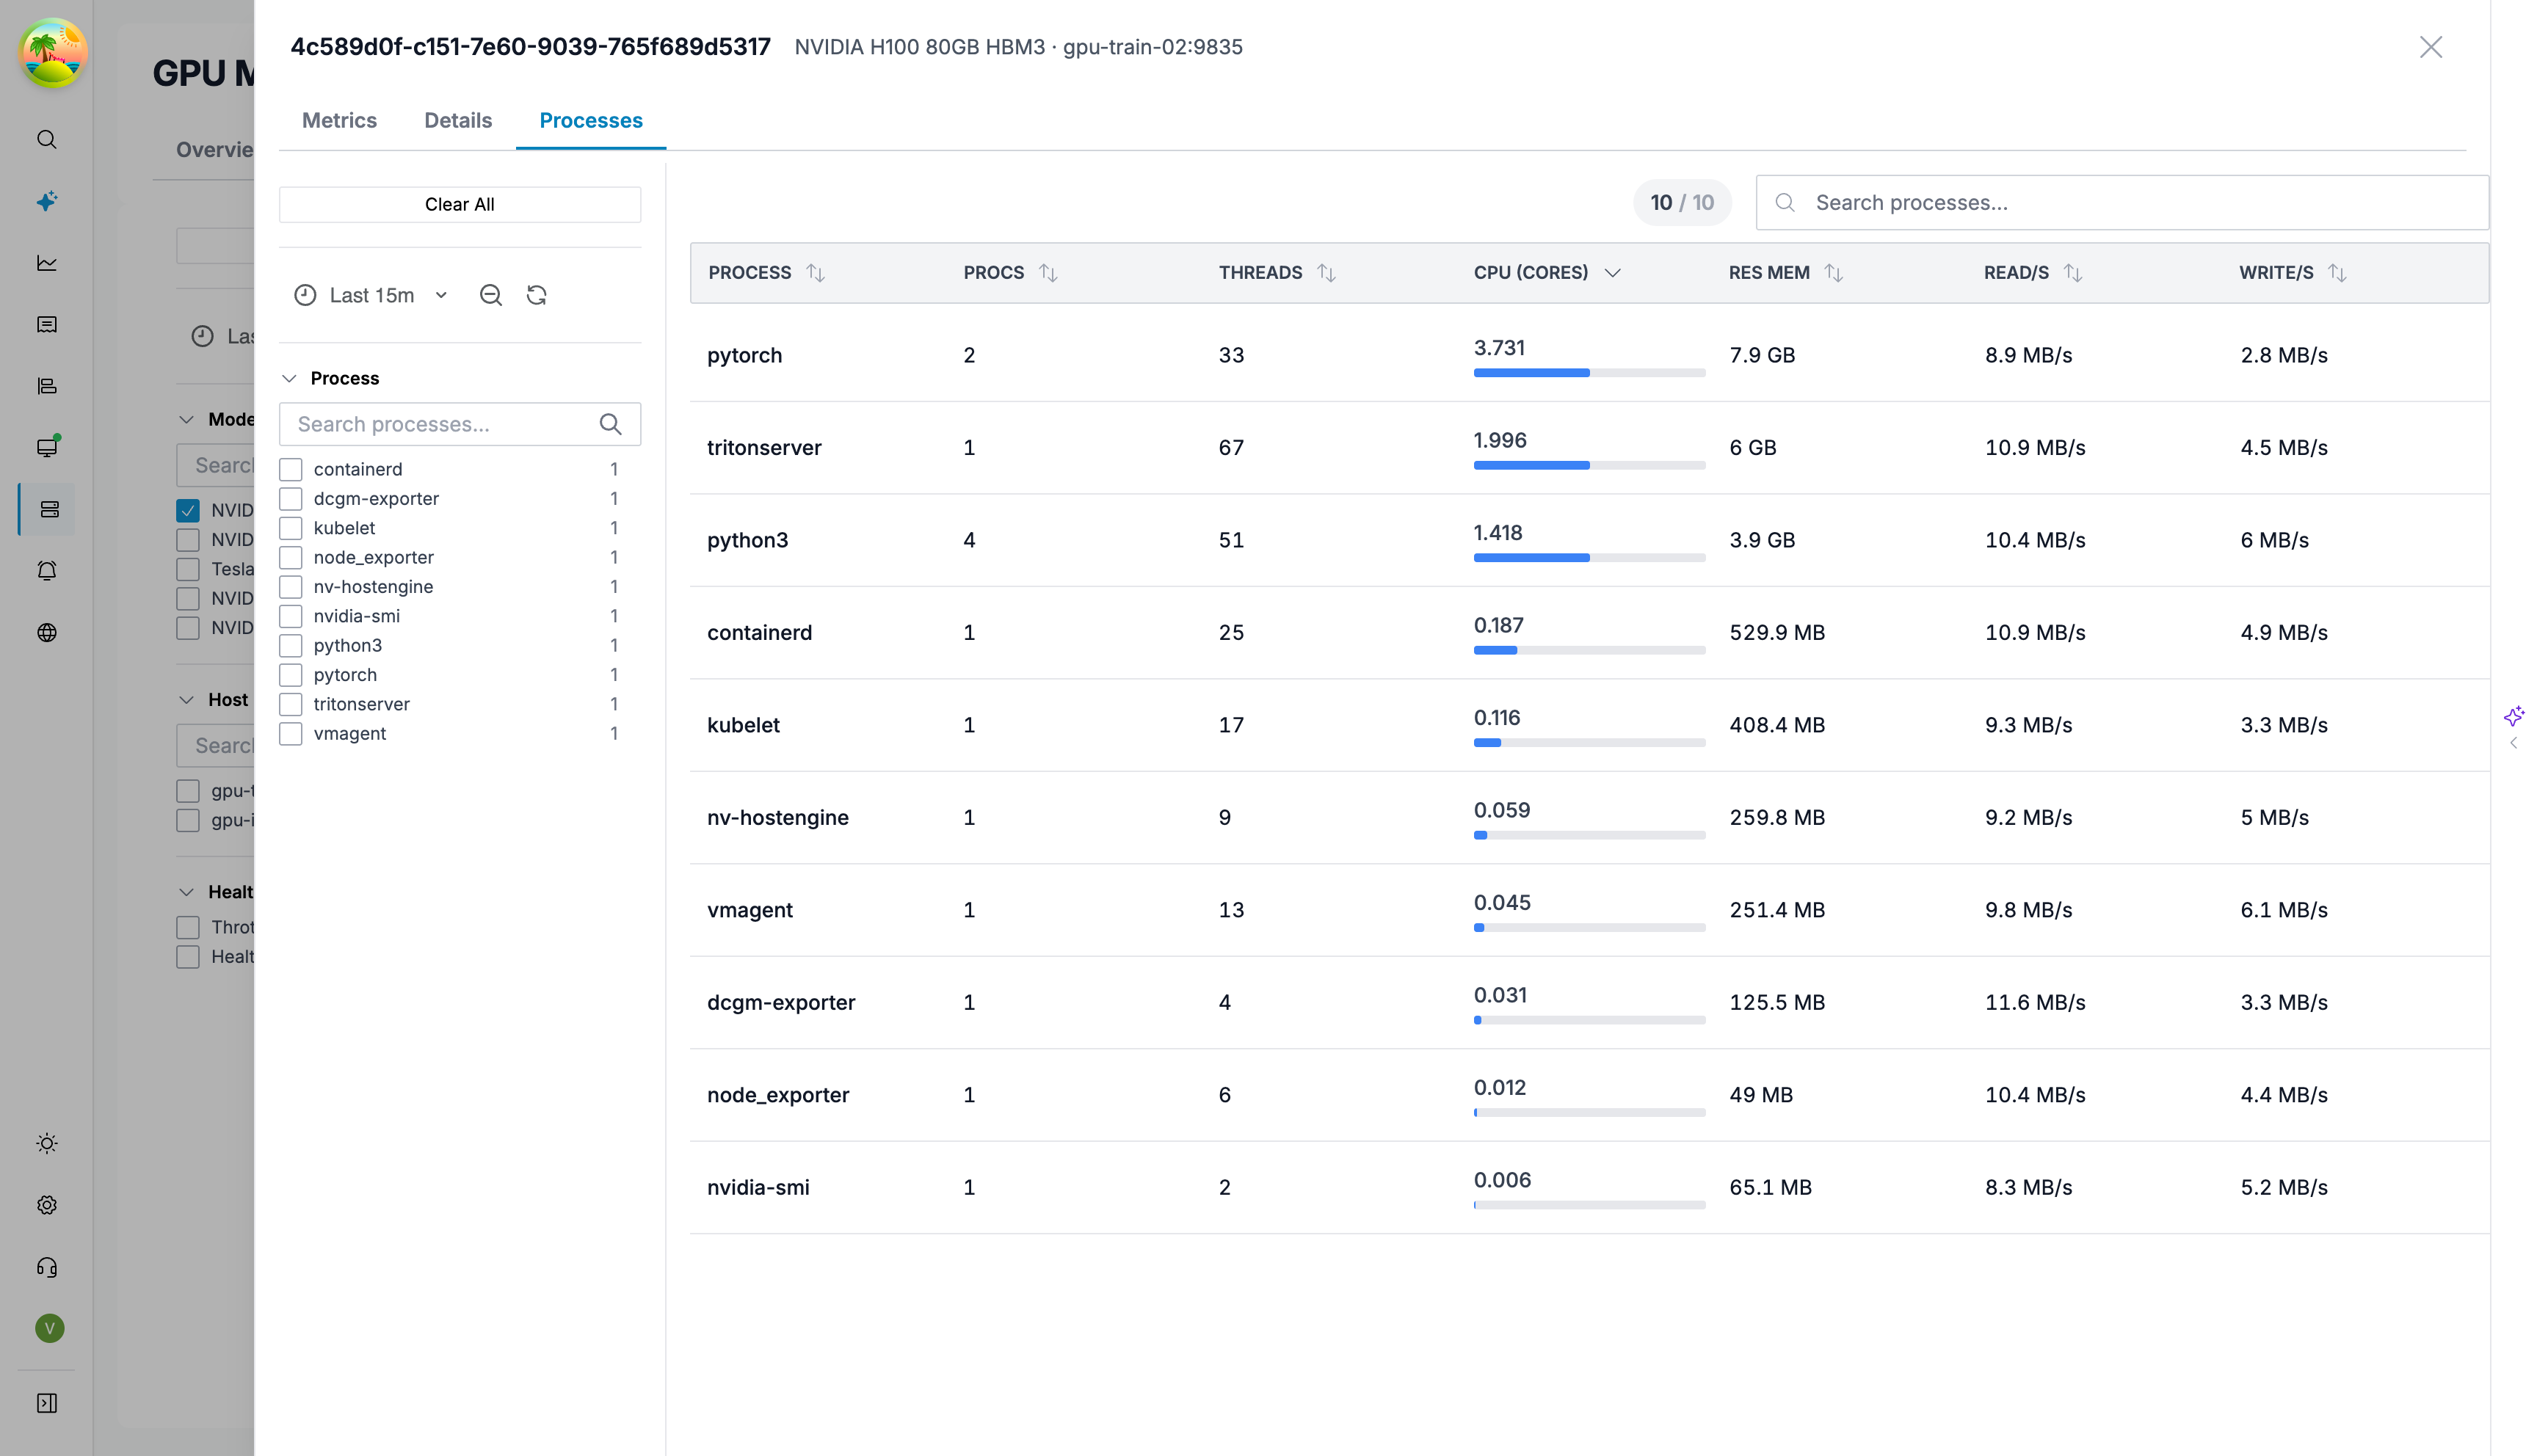
Process Monitor
The process monitor shows per-process resource usage on
GPU hosts using process_exporter metrics.
| Metric | Description |
|---|---|
| CPU Rate | CPU cores consumed |
| Resident Memory | Physical memory usage |
| Read / Write Bytes | Disk I/O rate |
| Context Switches | Rate of context switches |
| FD Ratio | File descriptor usage as % of limit |
Setup
Navigate to Integrations → GPU Monitoring to access the setup wizard, which guides you through:
- Choose your exporter —
nvidia_gpu_exporterordcgm-exporter - Install the exporter — Docker, systemd, or binary commands provided
- Install process exporter — for per-process visibility
- Configure scraping — Prometheus or VMAgent configuration with correct instance labeling
- Verify data — confirm metrics are flowing
Supported Exporters
| Exporter | Metrics Prefix | Use Case |
|---|---|---|
| nvidia_gpu_exporter | nvidia_smi_* | Simple setup, covers most use cases |
| dcgm-exporter | DCGM_FI_* | Advanced profiling metrics |
Instance Label
The GPU page identifies hosts by the instance label.
The setup wizard configures relabeling to strip the port
from the target address, so you get clean hostnames
(e.g. gpu-train-01 instead of gpu-train-01:9835).
Grafana Dashboards
Four built-in dashboards are embedded in the UI, accessible from host and device detail drawers:
| Dashboard | Used In |
|---|---|
| GPU Host Overview | Host drawer |
| NVIDIA GPU Metrics | Device drawer (nvidia_smi) |
| DCGM GPU Metrics | Device drawer (DCGM) |
| GPU Process Monitor | Process tab |
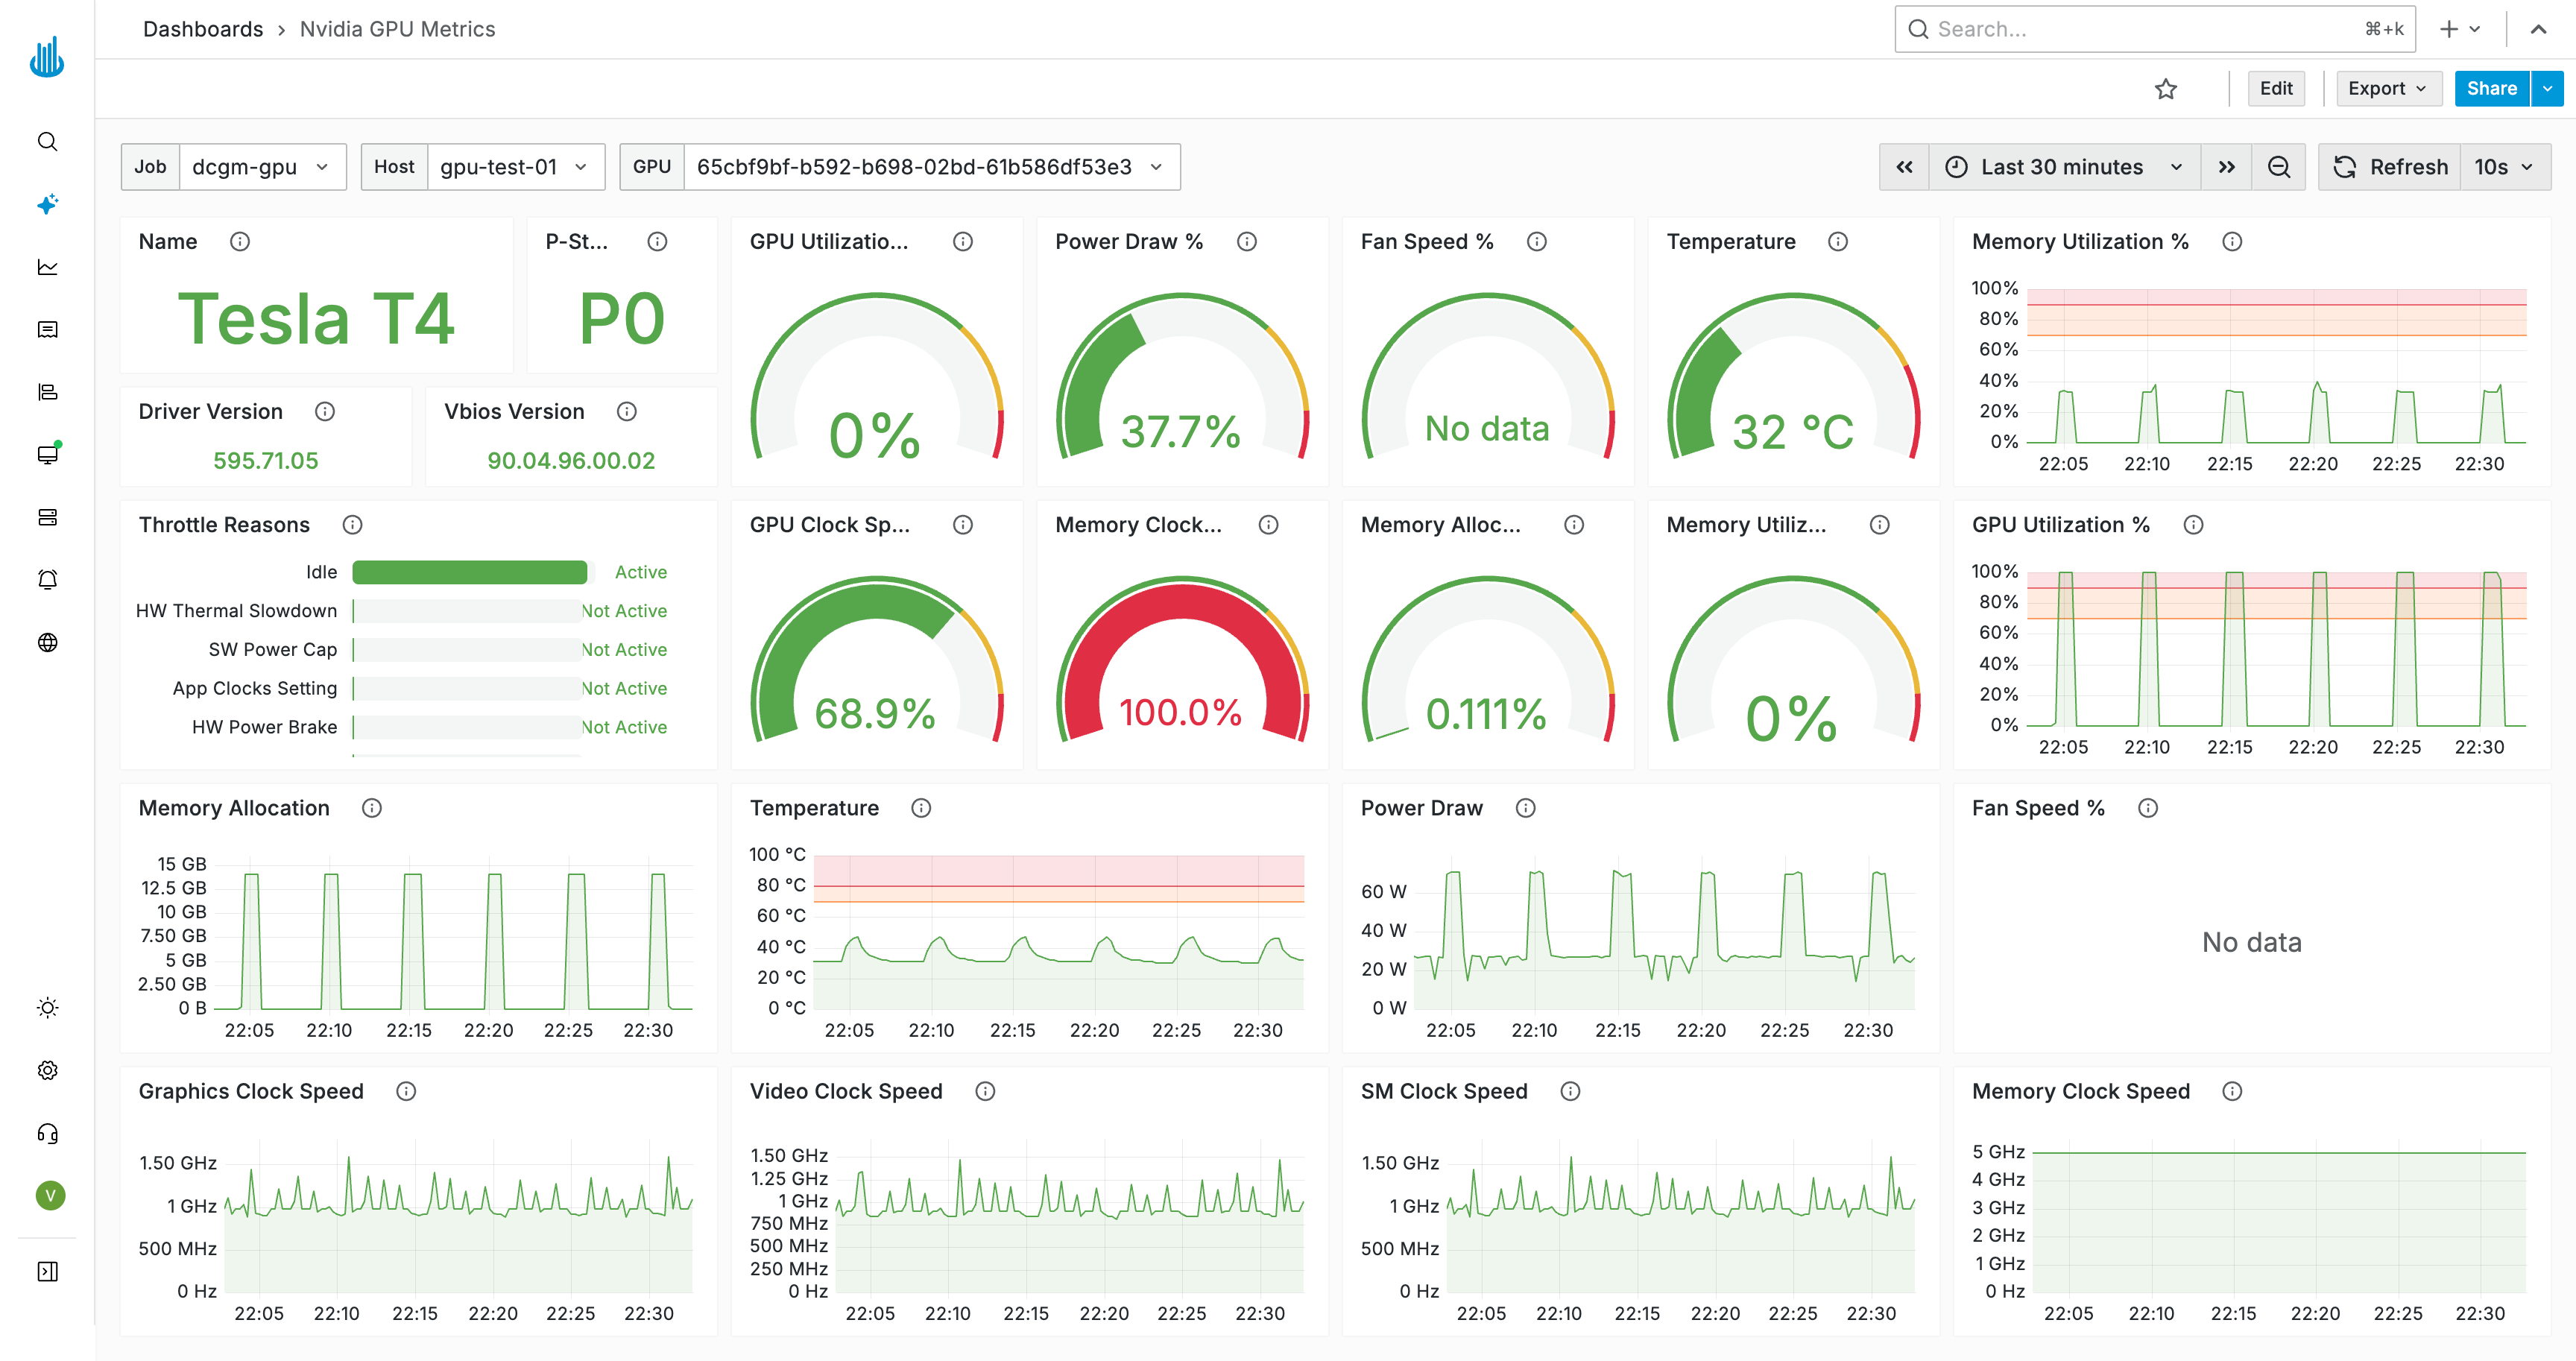
The NVIDIA GPU Metrics dashboard provides a deep dive into a single GPU — real-time utilization, clock speeds, memory allocation, power draw, fan speed, and throttle reasons. It automatically filters to the selected device when opened from the Devices tab.
Best Practices
- Use consistent instance labels — strip ports so the same host appears as one entity across all metrics.
- Monitor VRAM allocation — high usage (>90%) leads to OOM kills.
- Watch thermal throttling — sustained temps above 80°C reduce performance.
- Track idle GPUs — idle GPUs waste expensive compute; use the alert to right-size your fleet.
- Enable process_exporter — without it, you lose visibility into which processes consume resources.
Support
If you need assistance or have any questions, please reach out to us through:
- Email at [email protected]