Claude
Claude ships with built-in OpenTelemetry support across all of its coding surfaces: the Claude Code CLI, the desktop app, and Cowork. Once enabled, Oodle collects metrics and event logs and turns them into use-case dashboards covering adoption, cost and ROI, engineering impact, tool behavior, and efficiency across your organization.
Getting Started
1. Enable Telemetry
The fastest way is to use the integration tile in the Oodle UI:
- Navigate to Settings → Integrations
- Open the AI Observability section
- Click the Claude Observability tile
- Select an API key and follow the steps shown
The tile generates a ready-to-use configuration and lets
you choose how to distribute it: to a single developer,
to everyone working in a repository, or to your whole
organization. Replace <OTLP_ENDPOINT>, <API_KEY>, and
<INSTANCE_ID> in the snippets below with values from the
integration tile.
Individual
For a single developer, export the variables directly in
your shell before running claude:
export CLAUDE_CODE_ENABLE_TELEMETRY=1
export OTEL_METRICS_EXPORTER=otlp
export OTEL_LOGS_EXPORTER=otlp
export OTEL_TRACES_EXPORTER=otlp
export CLAUDE_CODE_ENHANCED_TELEMETRY_BETA=1
export OTEL_EXPORTER_OTLP_PROTOCOL=http/protobuf
export OTEL_EXPORTER_OTLP_ENDPOINT=https://<OTLP_ENDPOINT>
export OTEL_EXPORTER_OTLP_HEADERS="X-API-KEY=<API_KEY>, X-OODLE-INSTANCE=<INSTANCE_ID>"
export OTEL_EXPORTER_OTLP_METRICS_TEMPORALITY_PREFERENCE=delta
export OTEL_LOG_USER_PROMPTS=1
export OTEL_LOG_TOOL_DETAILS=1

# Optional: resource attributes for team/repo breakdowns
export OTEL_RESOURCE_ATTRIBUTES="git.repository.name=my-repo,org.team.name=platform,org.department=engineering,org.cost_center=eng-123"
For faster feedback during initial setup, lower the export intervals:
export OTEL_METRIC_EXPORT_INTERVAL=10000
export OTEL_LOGS_EXPORT_INTERVAL=5000
Repository
To share telemetry settings with everyone working in a
repository, commit them to .claude/settings.json in the
project. Claude Code applies them for anyone who works in
the repo, with no per-developer setup required:
{
  "env": {
    "CLAUDE_CODE_ENABLE_TELEMETRY": "1",
    "OTEL_METRICS_EXPORTER": "otlp",
    "OTEL_LOGS_EXPORTER": "otlp",
    "OTEL_TRACES_EXPORTER": "otlp",
    "CLAUDE_CODE_ENHANCED_TELEMETRY_BETA": "1",
    "OTEL_EXPORTER_OTLP_PROTOCOL": "http/protobuf",
    "OTEL_EXPORTER_OTLP_ENDPOINT": "https://<OTLP_ENDPOINT>",
    "OTEL_EXPORTER_OTLP_HEADERS": "X-API-KEY=<API_KEY>, X-OODLE-INSTANCE=<INSTANCE_ID>",
    "OTEL_EXPORTER_OTLP_METRICS_TEMPORALITY_PREFERENCE": "delta",
    "OTEL_LOG_USER_PROMPTS": "1",
    "OTEL_LOG_TOOL_DETAILS": "1",
    "OTEL_RESOURCE_ATTRIBUTES": "git.repository.name=my-repo,org.team.name=platform,org.department=engineering,org.cost_center=eng-123"
  }
}
Server-managed (organization-wide)
To distribute settings across your whole organization
without device management (MDM), use the
Claude Code admin console.
Paste the same env configuration into Admin Settings →
Claude Code → Managed settings. Clients fetch it when
users authenticate and poll for updates hourly.
- Requires a Claude for Teams or Enterprise plan, and the Owner or Primary Owner role to edit.
- OpenTelemetry settings take effect after a full Claude Code restart.
See the server-managed settings documentation for delivery, caching, and precedence details.
2. Verify Data
Once telemetry starts flowing (metrics export every 60 s, events every 5 s by default), navigate to AI Cost Management → Claude in the Oodle sidebar.
Dashboards
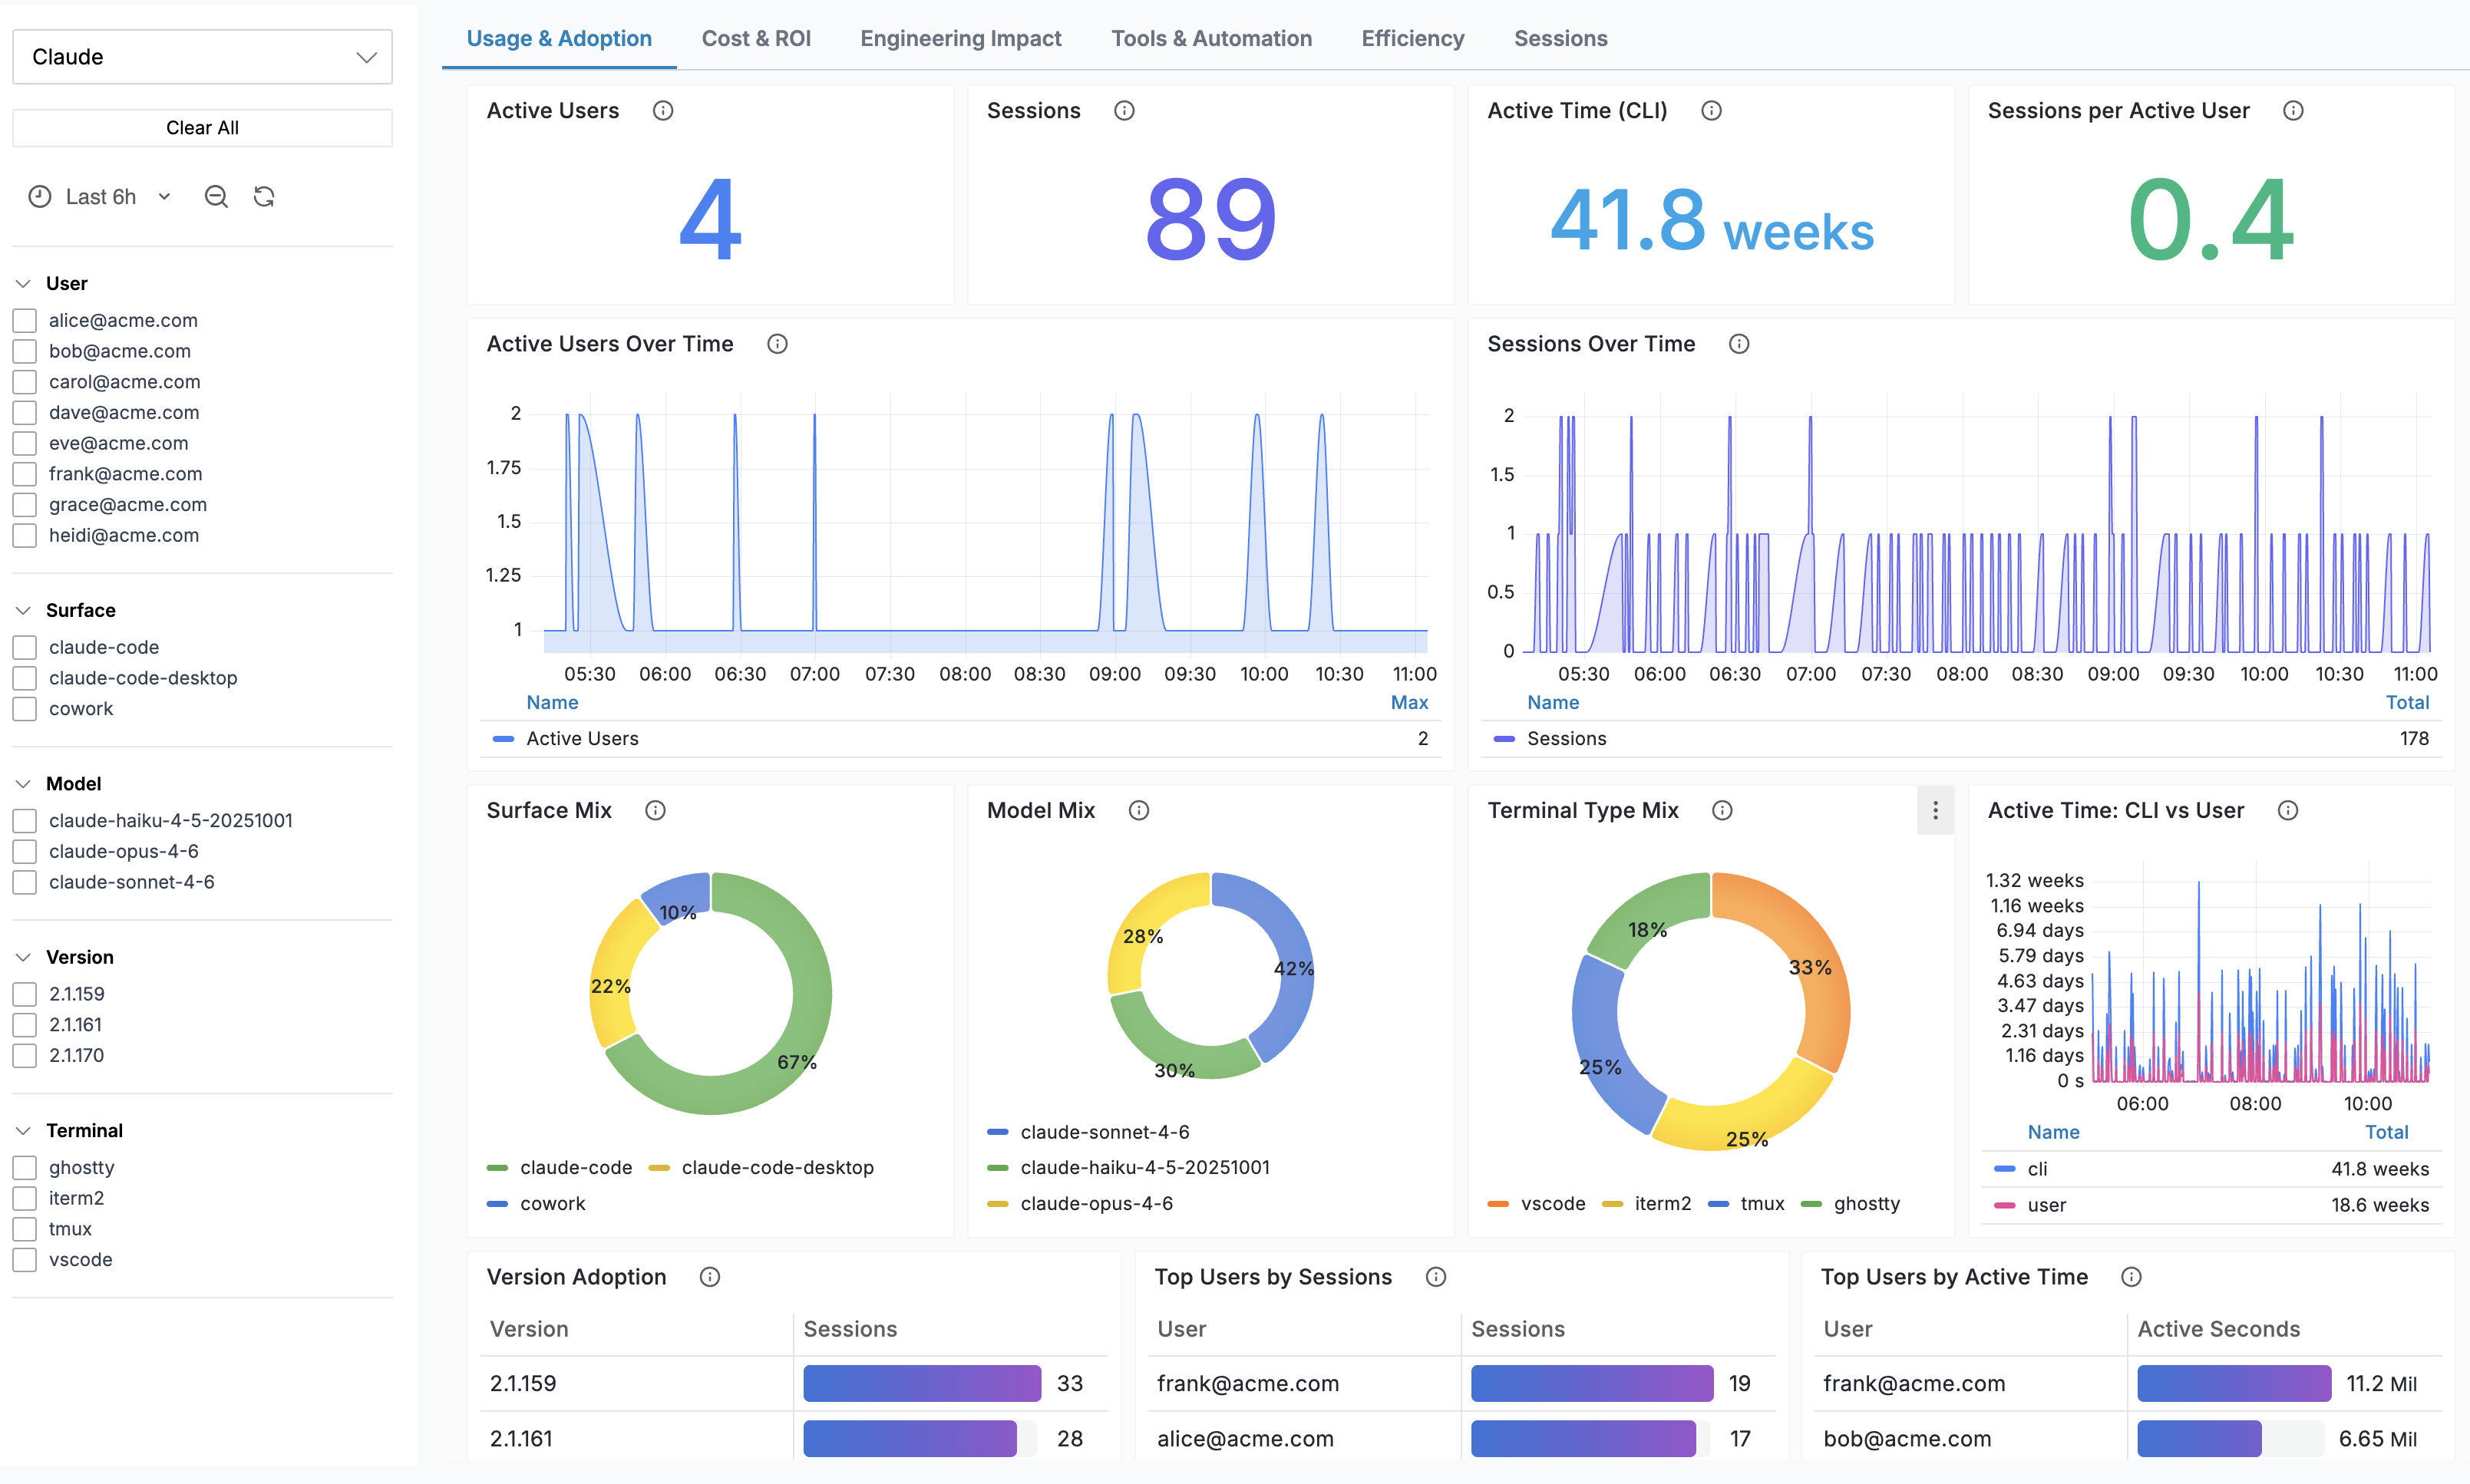
The Claude analysis page is organized around the questions engineering leadership asks of a coding agent. Each tab embeds a dashboard that leads with headline numbers, followed by trends and ranked breakdowns.
Usage and Adoption
Is the team using it?
| Panel | Description |
|---|---|
| Active Users | Distinct engineers who ran Claude |
| Sessions | Sessions started, plus sessions per active user |
| Active Time | CLI processing time vs user interaction time |
| Surface / Model / Terminal Mix | Where and how sessions run (CLI, desktop, Cowork; model share; editor terminals) |
| Version Adoption | Activity by CLI version, to track upgrade velocity |
| Top Users | Engineers ranked by sessions and active time |
Cost and ROI
What are we paying, and what do we get for it?
| Panel | Description |
|---|---|
| Total Spend | Estimated USD spend, the headline budget number |
| Cost per Active User | Average spend per engineer, for seat-cost modeling |
| Cost per Commit / Cost per PR | Unit economics of shipped output |
| Sessions Producing Outcomes | Share of sessions that led to a commit or PR |
| Top Spenders | Users and sessions ranked by spend |
| Spend Breakdown | Spend by model, query source, agent, and skill |
| Team and Repository Breakdown | Spend by org.team.name and git.repository.name resource attributes |
Engineering Impact
What did it produce?
| Panel | Description |
|---|---|
| Lines Added / Removed | Code throughput from accepted suggestions |
| Commits and Pull Requests | Shipped output over time |
| Edit Accept Rate | Share of suggested edits engineers accepted, with health thresholds |
| Avg Lines per Session | Output volume per session |
| Output Leaderboards | Top users by lines added, commits, and PRs |
Tools and Automation
Is the agent working well?
| Panel | Description |
|---|---|
| Tool Calls | Invocation volume, distinct tools, and per-tool trends |
| Tool Duration | Average execution time by tool |
| Result Size | Bytes returned per tool, the main driver of context growth and cost |
| Bash CLI Breakdown | Specific commands run through Bash, by count and output size |
| MCP Servers and Tools | External integration usage and latency |
| Skills | Invocations of codified team workflows |
Efficiency
Is spend being used well?
| Panel | Description |
|---|---|
| Cache Hit Rate | Share of context served from cache, with health thresholds |
| Token Split | Input vs cache read vs cache creation volume |
| Ghost Cost Leaderboard | Sessions ranked by cache re-priming relative to new input |
| Cost per Line of Code | Output per dollar, overall and by model |
| Prompt Length Analysis | Prompt size distribution and cost per prompt |
Sessions
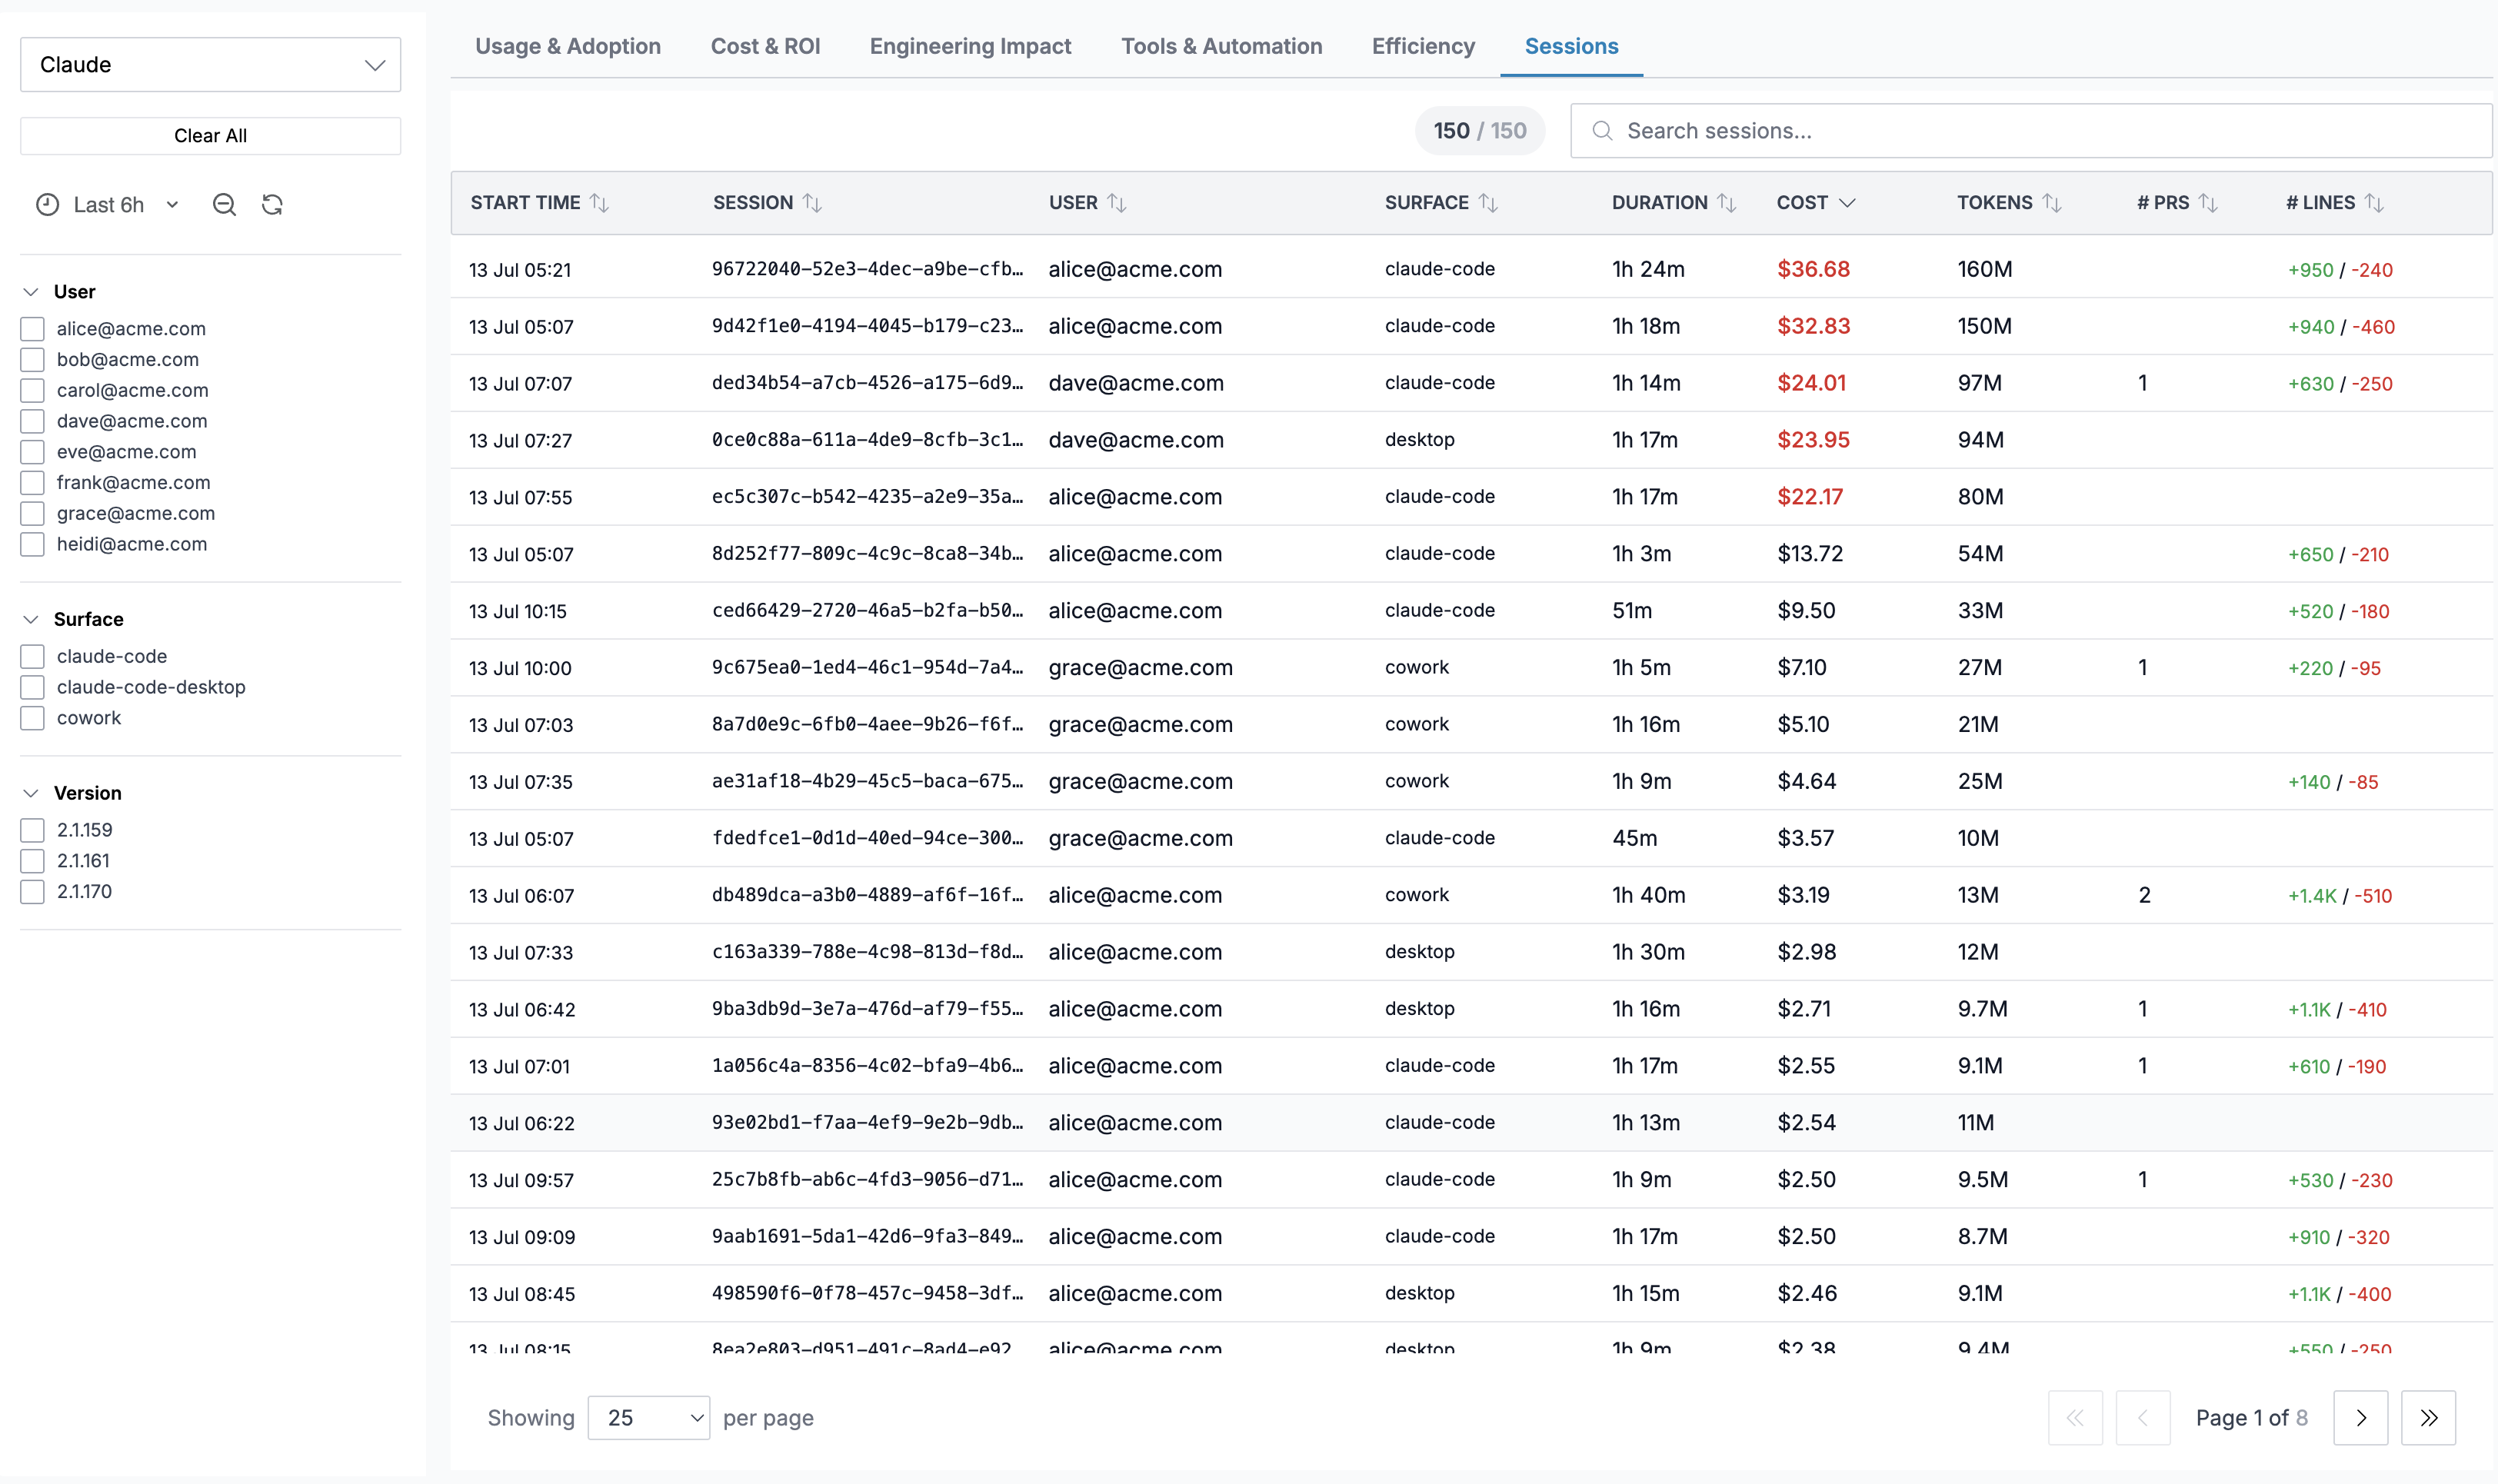
The Sessions tab shows individual Claude sessions:
| Column | Description |
|---|---|
| Start Time | When the session began |
| User | Email of the developer |
| Model | Primary model used |
| Prompts | Number of user prompts |
| Duration | Wall-clock duration |
| Cost | Total estimated cost |
| Tools | Number of tool calls |
| Tokens | Total tokens (input + output) |
| Errors | Count of errors |
Click any row to open a Session Detail drawer showing a turn-by-turn timeline of every event.
Session Detail Drawer
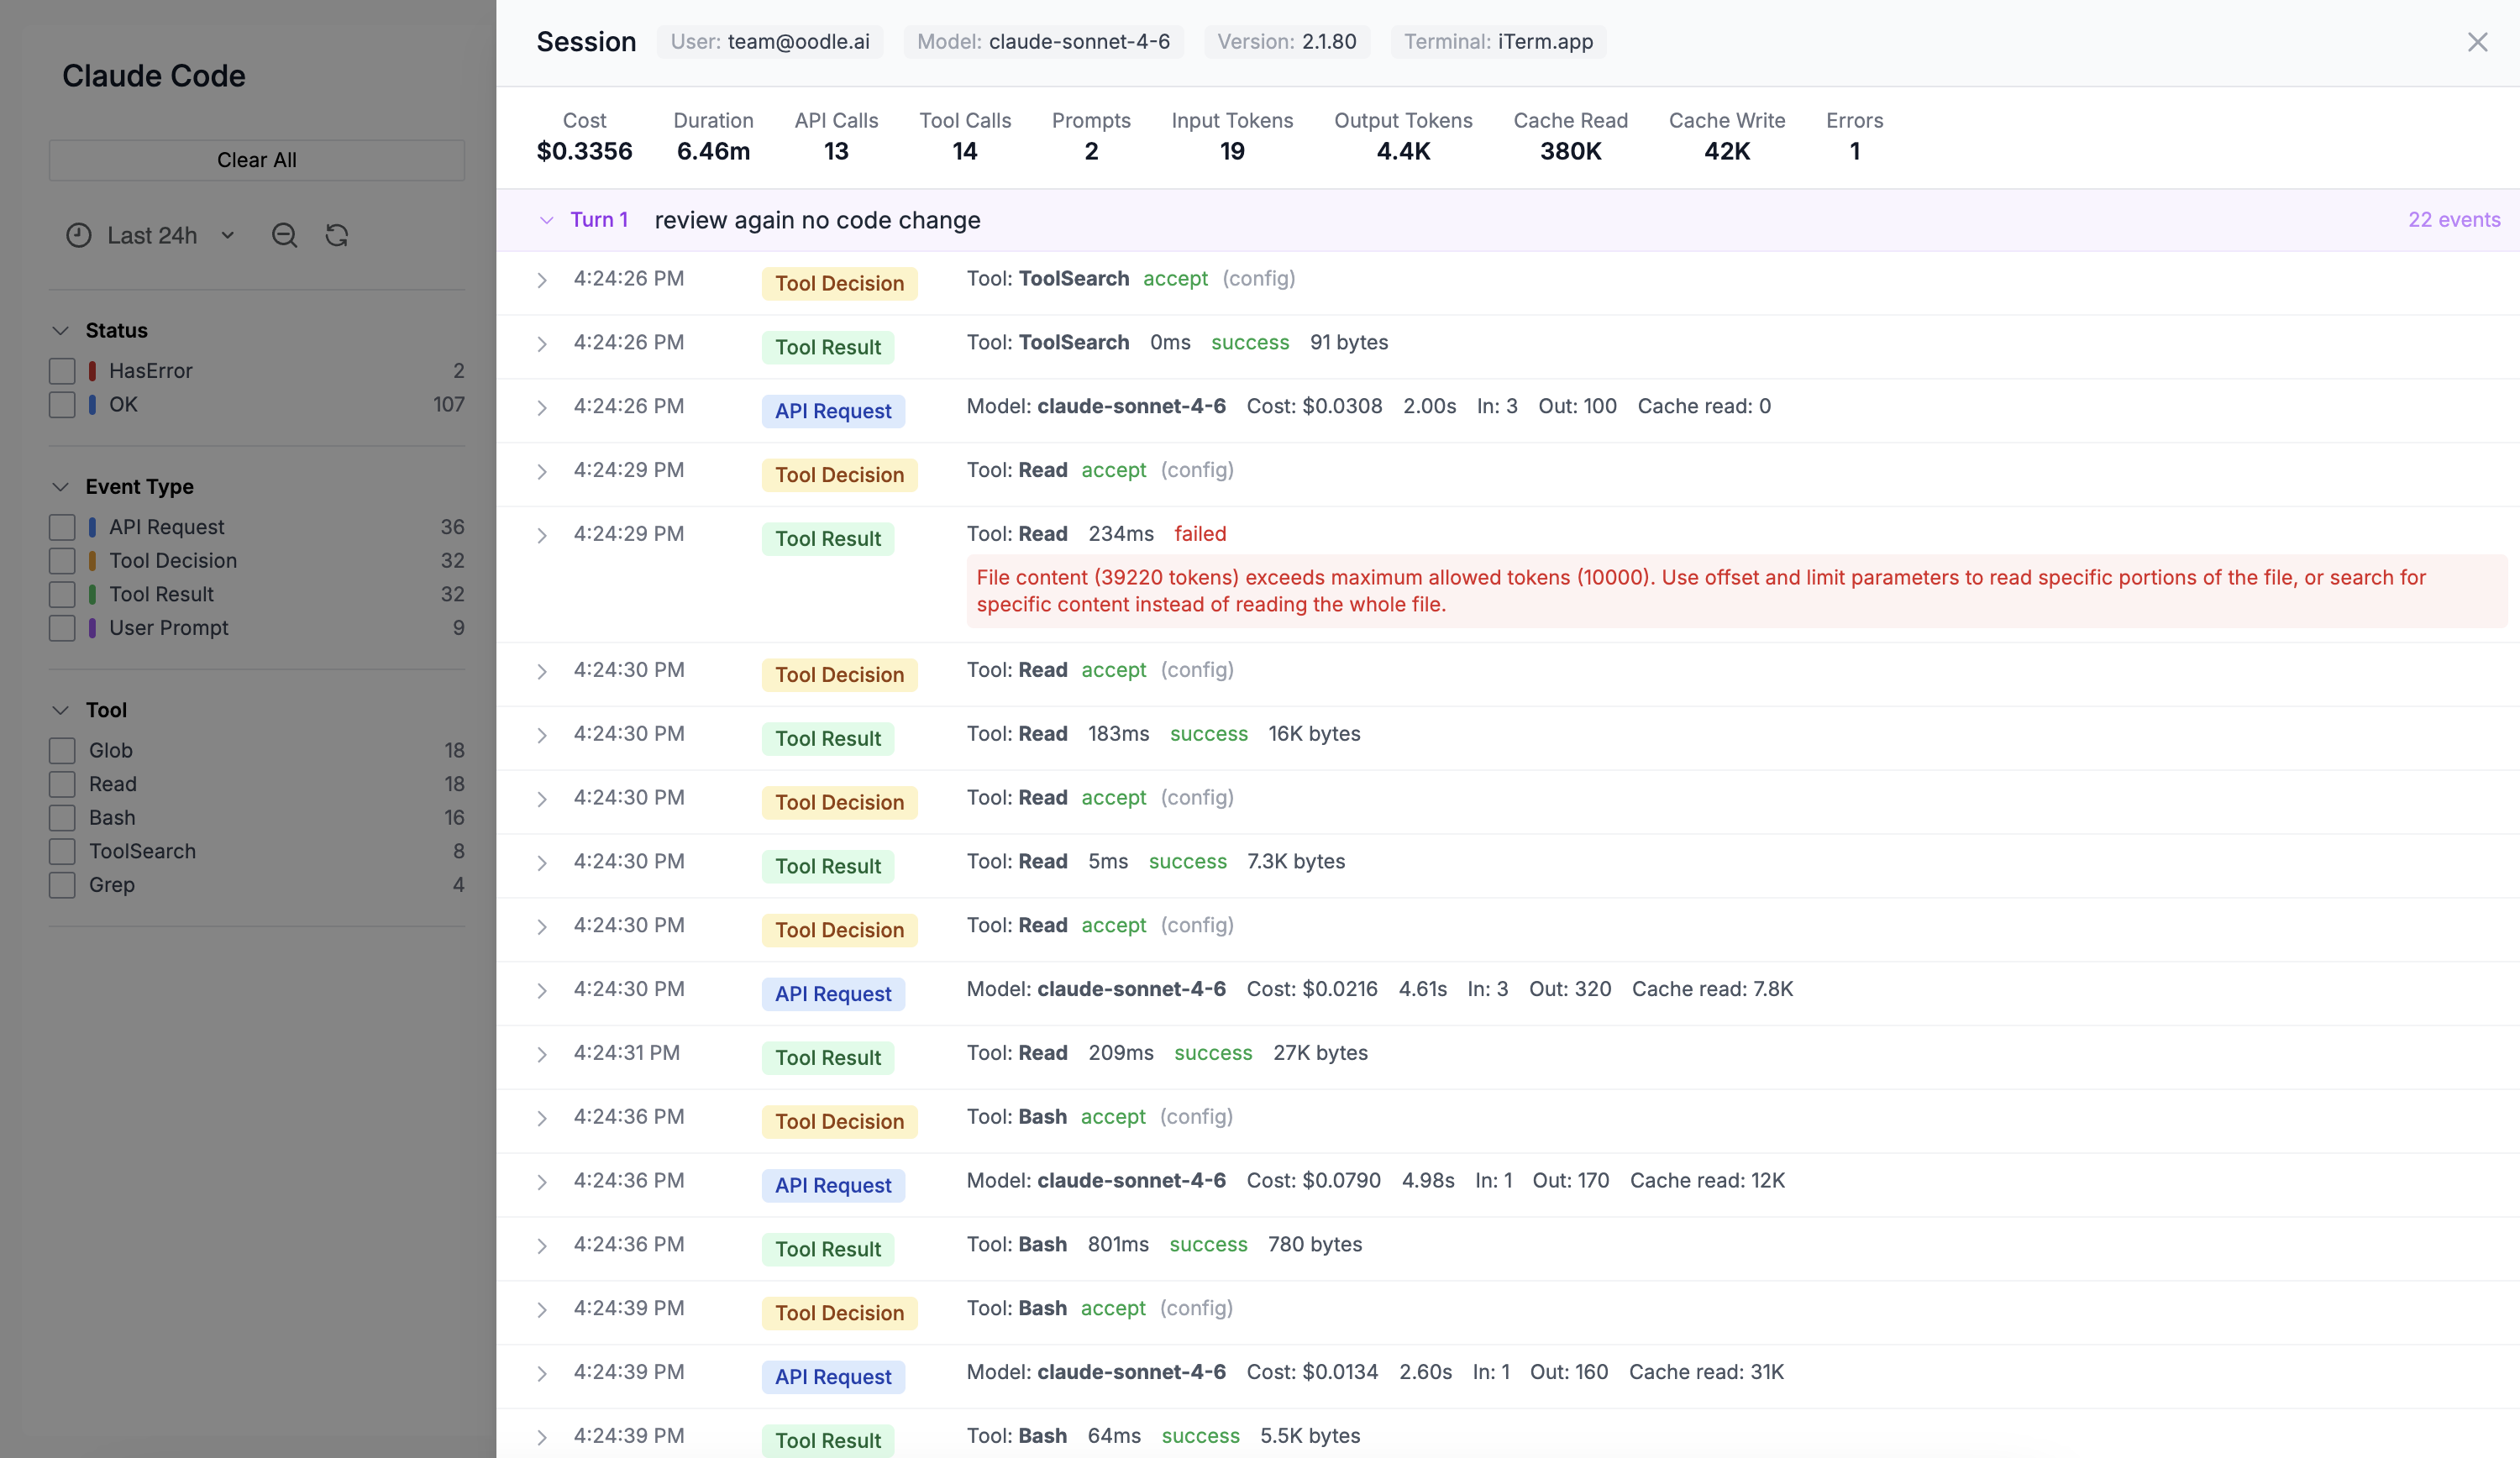
The drawer displays:
- Session metadata: user, model, app version, terminal type
- Aggregated stats: total cost, tokens, tool calls, errors, duration
- Turn-by-turn timeline: each turn is collapsible and shows the user prompt followed by individual events (API requests, tool calls, decisions). Every event row is expandable to reveal the full raw JSON payload.
What Gets Collected
Metrics
Claude exports the following as OpenTelemetry metrics (delta temporality):
| Metric | Key Labels | Description |
|---|---|---|
claude_code_token_usage | type, model, user_email | Token count by type (input, output, cacheRead, cacheCreation) |
claude_code_cost_usage | model, user_email | Estimated cost in USD |
claude_code_session_count | user_email | Sessions started |
claude_code_active_time_total | type | User and CLI active time in seconds |
claude_code_lines_of_code_count | type | Lines added / removed |
claude_code_commit_count | user_email | Commits created |
claude_code_pull_request_count | user_email | Pull requests created |
claude_code_code_edit_tool_decision | decision | Edit accept / reject decisions |
All metrics also carry session_id, service_version,
terminal_type, and job (the surface: CLI, desktop app,
or Cowork). Tool call counts, durations, and result sizes
are derived from the claude_code.tool_result events
below and power the Tools and Automation dashboard.
Events (Logs)
Events are exported via the OpenTelemetry logs
protocol. Each event has a log.attributes.event_type
field:
| Event Type | Key Attributes |
|---|---|
claude_code.user_prompt | Prompt text (opt-in), character count |
claude_code.api_request | Model, cost, input/output tokens, cache tokens, duration |
claude_code.tool_result | Tool name, success, duration |
claude_code.tool_use_decision | Decision (accept/reject), source |
Events are grouped by session_id to reconstruct the
turn-by-turn timeline on the Sessions tab.
Multi-team Organization Support
Organizations with multiple teams or departments can add custom resource attributes to segment telemetry by repository, team, department, or cost center.
Recommended Attributes
| Attribute | Purpose | Example |
|---|---|---|
git.repository.name | Per-repository breakdowns | my-service |
org.team.name | Team-level filtering | platform |
org.department | Department or business unit | engineering |
org.cost_center | Charge-back / cost allocation | eng-123 |
Configuration
Set OTEL_RESOURCE_ATTRIBUTES as a comma-separated list of
key=value pairs:
export OTEL_RESOURCE_ATTRIBUTES="git.repository.name=my-repo,org.team.name=platform,org.department=engineering,org.cost_center=eng-123"
Or add it to your managed settings file (.claude/settings.json):
{
  "env": {
    "OTEL_RESOURCE_ATTRIBUTES": "git.repository.name=my-repo,org.team.name=platform,org.department=engineering,org.cost_center=eng-123"
  }
}
Values must not contain spaces. Use underscores, camelCase, or percent-encoding for special characters. See the Claude Code docs for the full specification.
Once set, these attributes appear on all metrics and events, allowing you to:
- Filter dashboards by team or department
- Track costs per cost center
- Create per-repository usage reports
- Set up team-specific alerts
Further Reading
Support
If you need assistance or have any questions, please reach out to us through:
- Email at [email protected]