LiteLLM
LiteLLM emits GenAI spans for every model call it routes, from the SDK or the Proxy, across all its providers.
Oodle is a managed observability platform for metrics, logs, traces and agent traces. It ingests OpenTelemetry natively, so the snippet on this page is the complete setup.
Each trace shows the full transcript, the token counts and cost of every call, the agent structure (runs, steps and tool calls) and Signals: labels for loops, rate limits, refusals and tool failures, detected as the trace arrives.
Sign up for free to get an instance ID and an API key, or see the Agent Observability overview first.
You will need:
OODLE_INSTANCE: your Oodle instance ID (ap1, us1)OODLE_API_KEY: an Oodle API key (ap1, us1)OTLP_ENDPOINT: your OTLP collector domain, shown on the tile
Open the LiteLLM tile on the ap1, us1 page to
get these filled in for you, or let an agent do the setup with
/oodle-onboarding set up the llm_observability_litellm integration.
Install
Install LiteLLM with the OpenTelemetry SDK and the OTLP exporter:
pip install litellm \
  opentelemetry-exporter-otlp-proto-http \
  opentelemetry-sdk
Instrument
Turn on the OTel callback. LiteLLM then traces every call it routes, whichever provider serves it:
import litellm

# LiteLLM builds its own tracer provider from the
# OTEL_EXPORTER_OTLP_* variables below, so there is no SDK
# setup to write here.
litellm.callbacks = ["otel"]

response = litellm.completion(
    model="gpt-4o-mini",
    messages=[{"role": "user", "content": "Hello!"}],
)

# LiteLLM Proxy takes the same callback in config.yaml:
# litellm_settings:
#   callbacks: ["otel"]
Environment
Point the application at Oodle:
# OTLP endpoint (points straight at Oodle)
export OTEL_EXPORTER_OTLP_ENDPOINT=https://<OTLP_ENDPOINT>

export OTEL_EXPORTER_OTLP_HEADERS="X-API-KEY=<OODLE_API_KEY>,X-OODLE-INSTANCE=<OODLE_INSTANCE>"

# Compress the export: prompt payloads are large
export OTEL_EXPORTER_OTLP_COMPRESSION=gzip

# Required. Without it LiteLLM names the span litellm_request
# and writes no gen_ai.operation.name, and Agent Observability
# lists nothing.
export OTEL_SEMCONV_STABILITY_OPT_IN=gen_ai_latest_experimental

# Capture prompt/response content. `true` here means events
# only, which leaves the span attributes empty.
export OTEL_INSTRUMENTATION_GENAI_CAPTURE_MESSAGE_CONTENT=span_and_event

# LiteLLM has no code hook for the resource, so the service
# name comes from the environment. It defaults to "litellm".
export OTEL_SERVICE_NAME=my-llm-app
Sessions, users and tool spans
The callback traces the model call and nothing around it. Each call is
its own trace, and a session_id or user_id passed in metadata is
not written to the span. To group calls into sessions and name the
user, open a span of your own around the turn and set session.id and
user.id on it, or add a span processor that stamps them from a
context variable. Oodle reads either from any span of the trace.
Tool executions are the same: LiteLLM records the calls the model asked
for and the tools it was offered, and the trace shows both on the
generation, but the execution itself is a span only if your code opens
one, with gen_ai.operation.name=execute_tool and gen_ai.tool.name.
Verify
Run your application, then open ap1, us1. Spans
carry gen_ai.* attributes: the model, token counts, and the prompt and
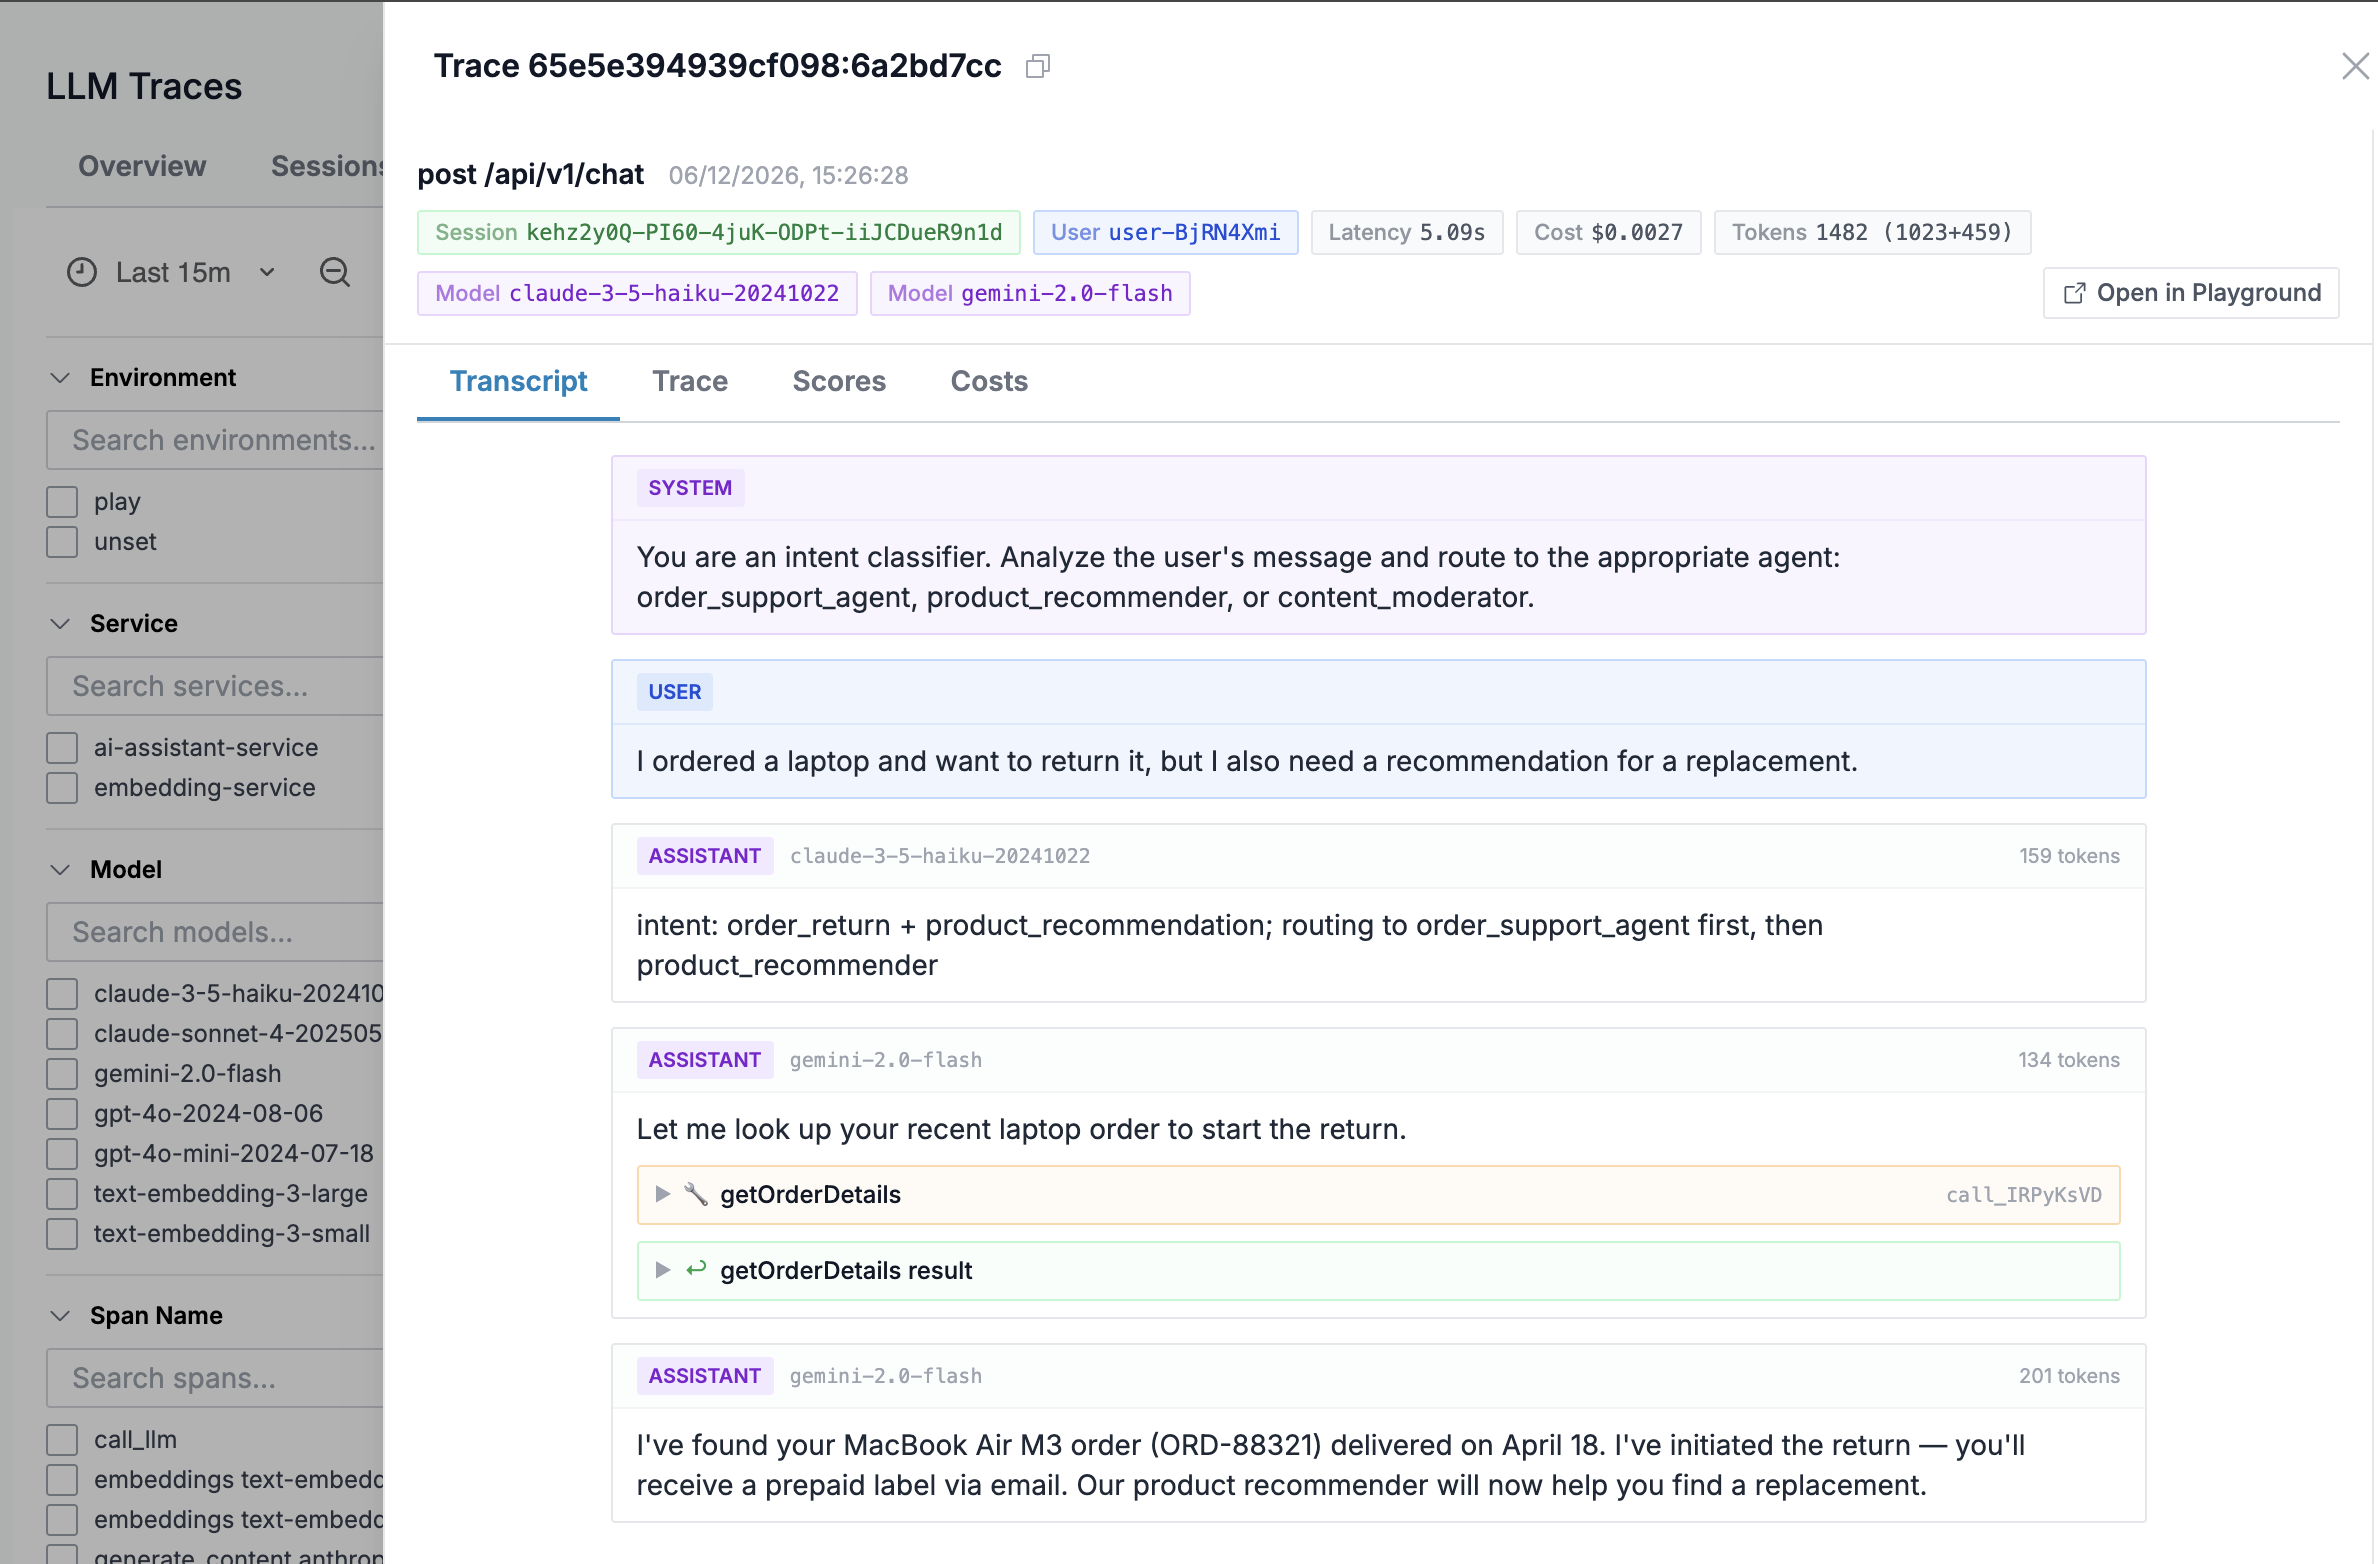
response content. Click a trace for the Transcript, the waterfall, and
the cost breakdown.
If nothing arrives, check that the exporter can reach
https://<OTLP_ENDPOINT> and that the instance and key are set: the
OTLP gateway answers 401 without them.
Support
If you need assistance or have any questions, please reach out to us through:
- Email at [email protected]