AI Cost Management
Oodle's AI Cost Management gives engineering teams visibility into how AI coding agents are used across the organization. Track token usage, costs, session activity, tool calls, and more, all in one place.
Why Monitor AI Agents?
AI coding agents are powerful but opaque. Without observability you cannot answer questions like:
- How much are we spending on AI-assisted coding?
- Which models are being used, and by whom?
- How many sessions run per day or week?
- Are tool calls succeeding, or are agents hitting errors?
- What prompts are developers sending to the agent?
Oodle collects telemetry exported by AI agents via OpenTelemetry and surfaces it through a dedicated analysis page with pre-built dashboards and a session-level event timeline.
Supported Agents
| Agent | Metrics | Events / Logs | Status |
|---|---|---|---|
| Claude | Token usage, cost, sessions, active time, lines of code, commits, PRs | User prompts, API requests, tool results, tool decisions | GA |
| OpenAI Codex | Token usage, conversations, tool calls, WebSocket requests, performance timings | SSE events, WebSocket events, conversation starts, tool decisions, tool results | GA |
| Factory Droid | Tool invocations, files read/modified, lines of code, commits, PRs, skills, repo profiles | Metrics only | GA |
Getting Started
- Navigate to Settings → Integrations
- Open the AI Observability section
- Click the tile for the agent you want to set up
- Select an API key and follow the steps shown
See the agent-specific pages for detailed setup instructions:
Analysis Page
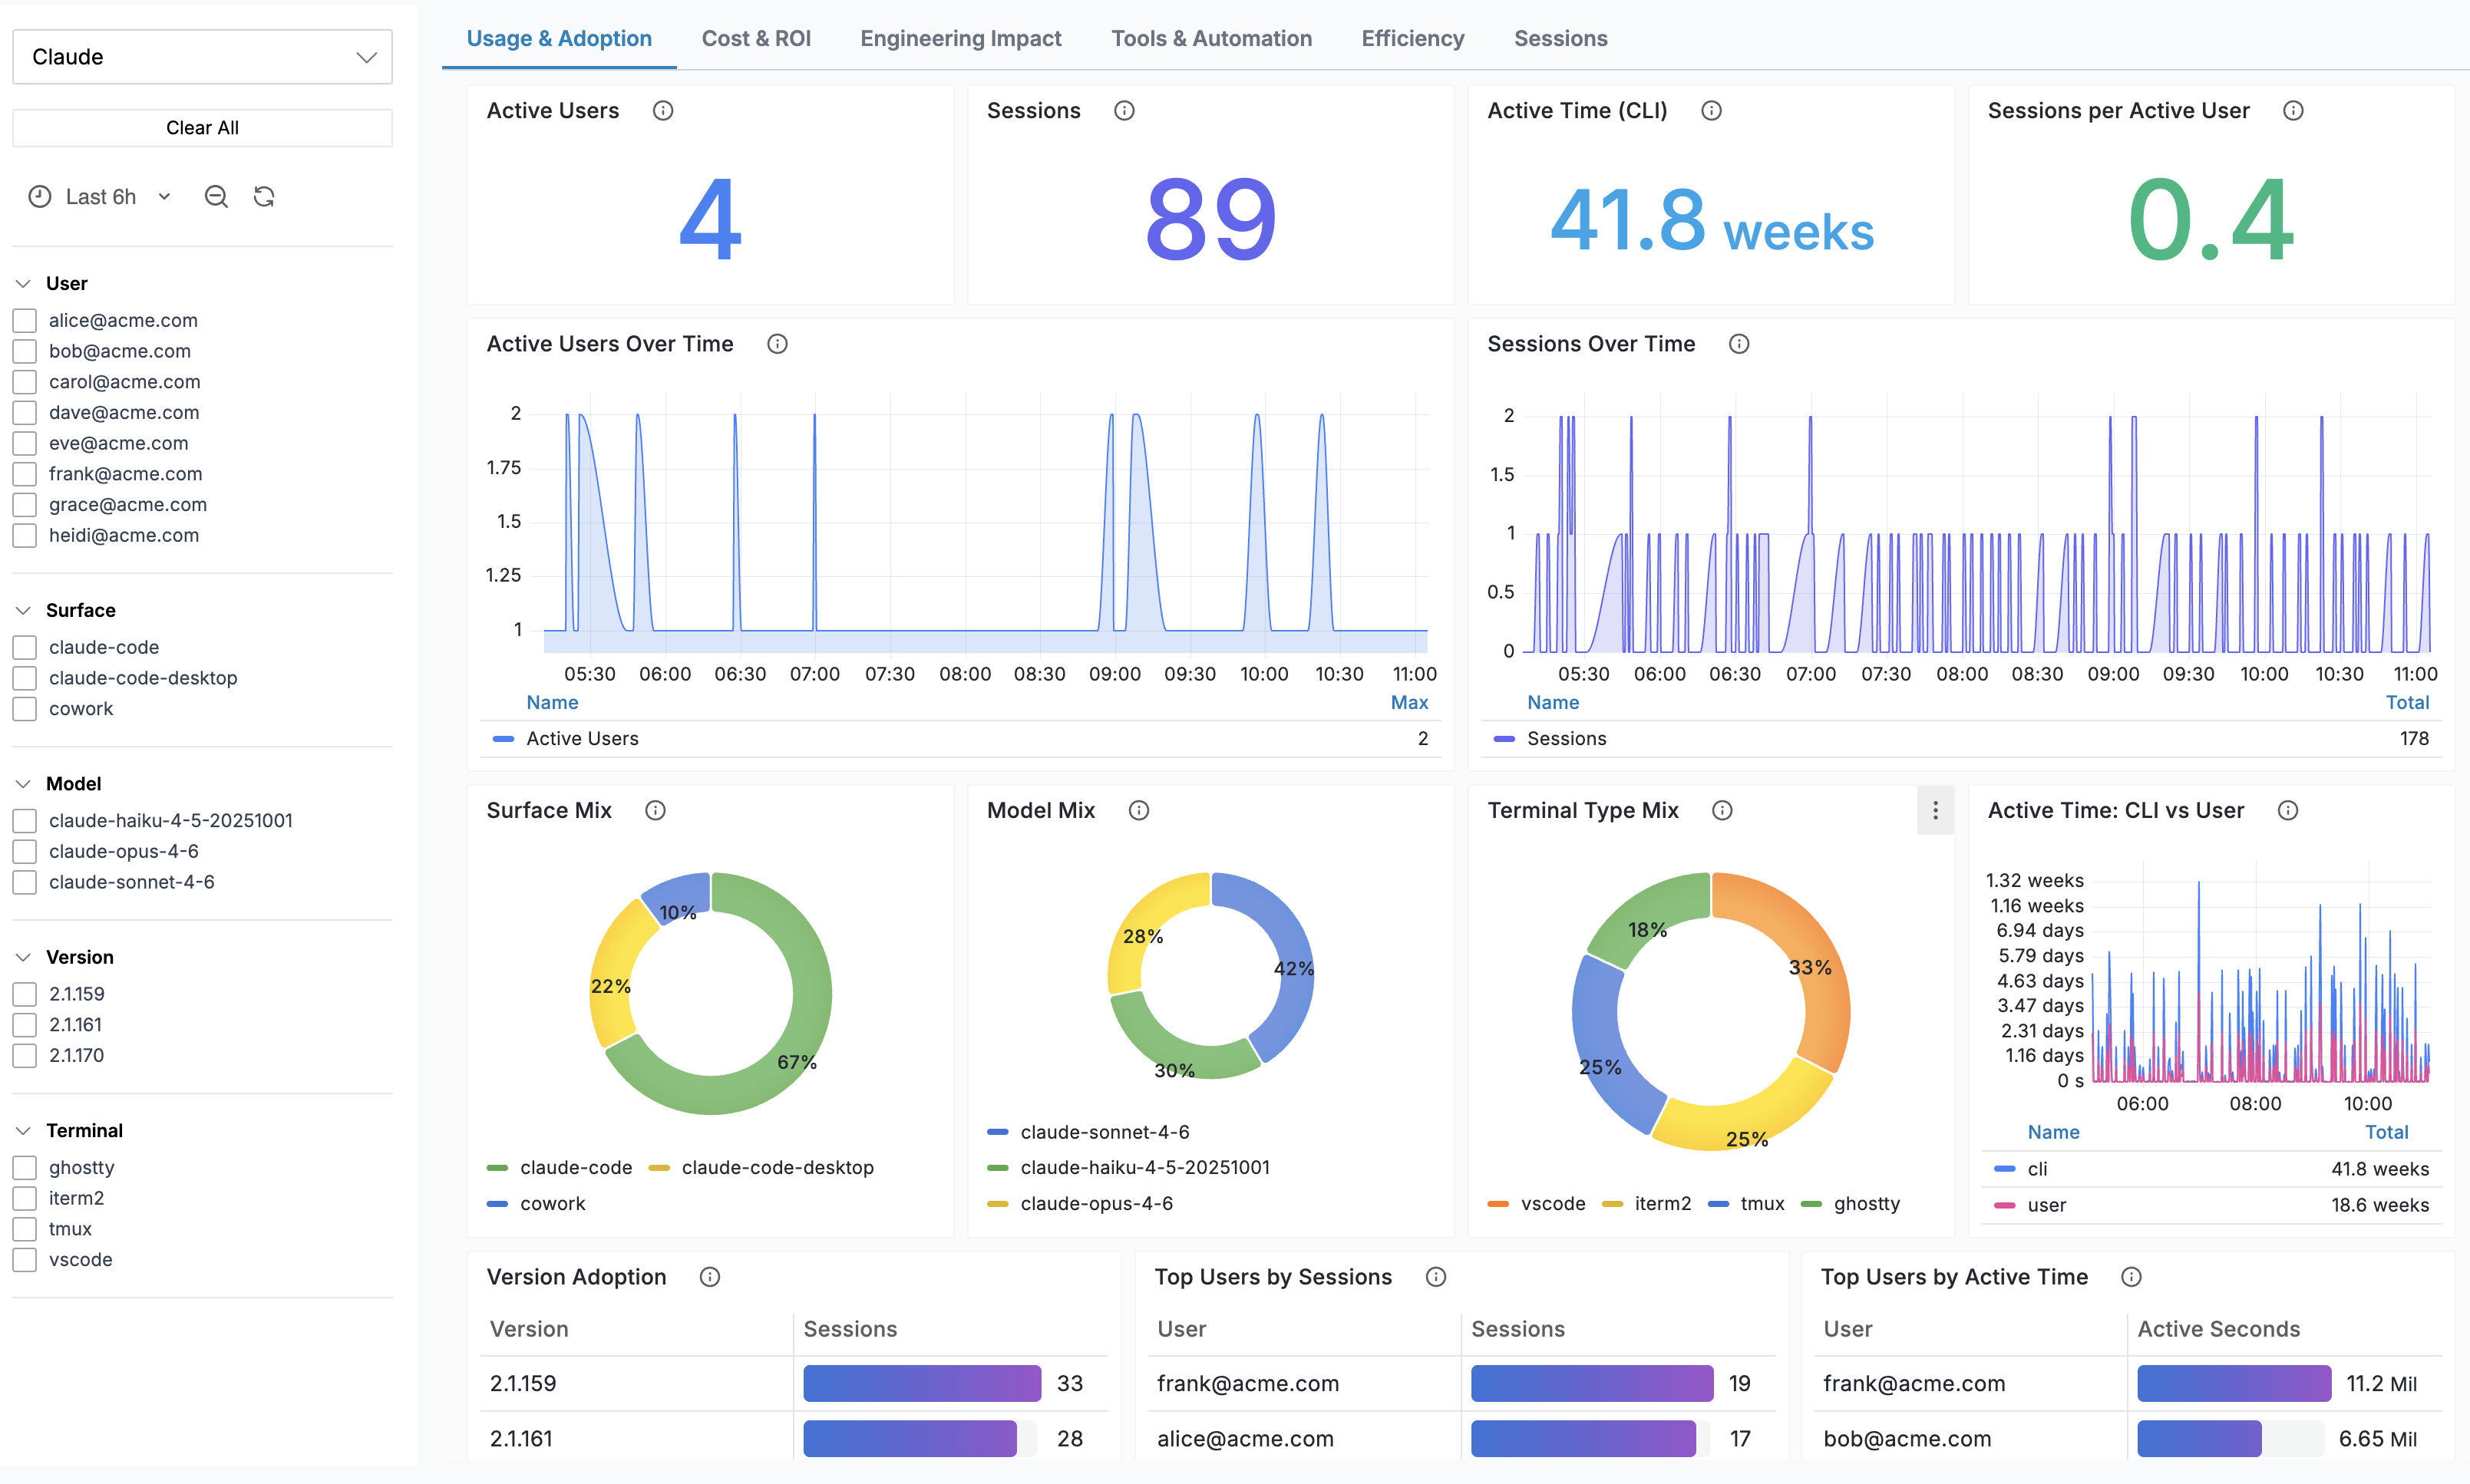
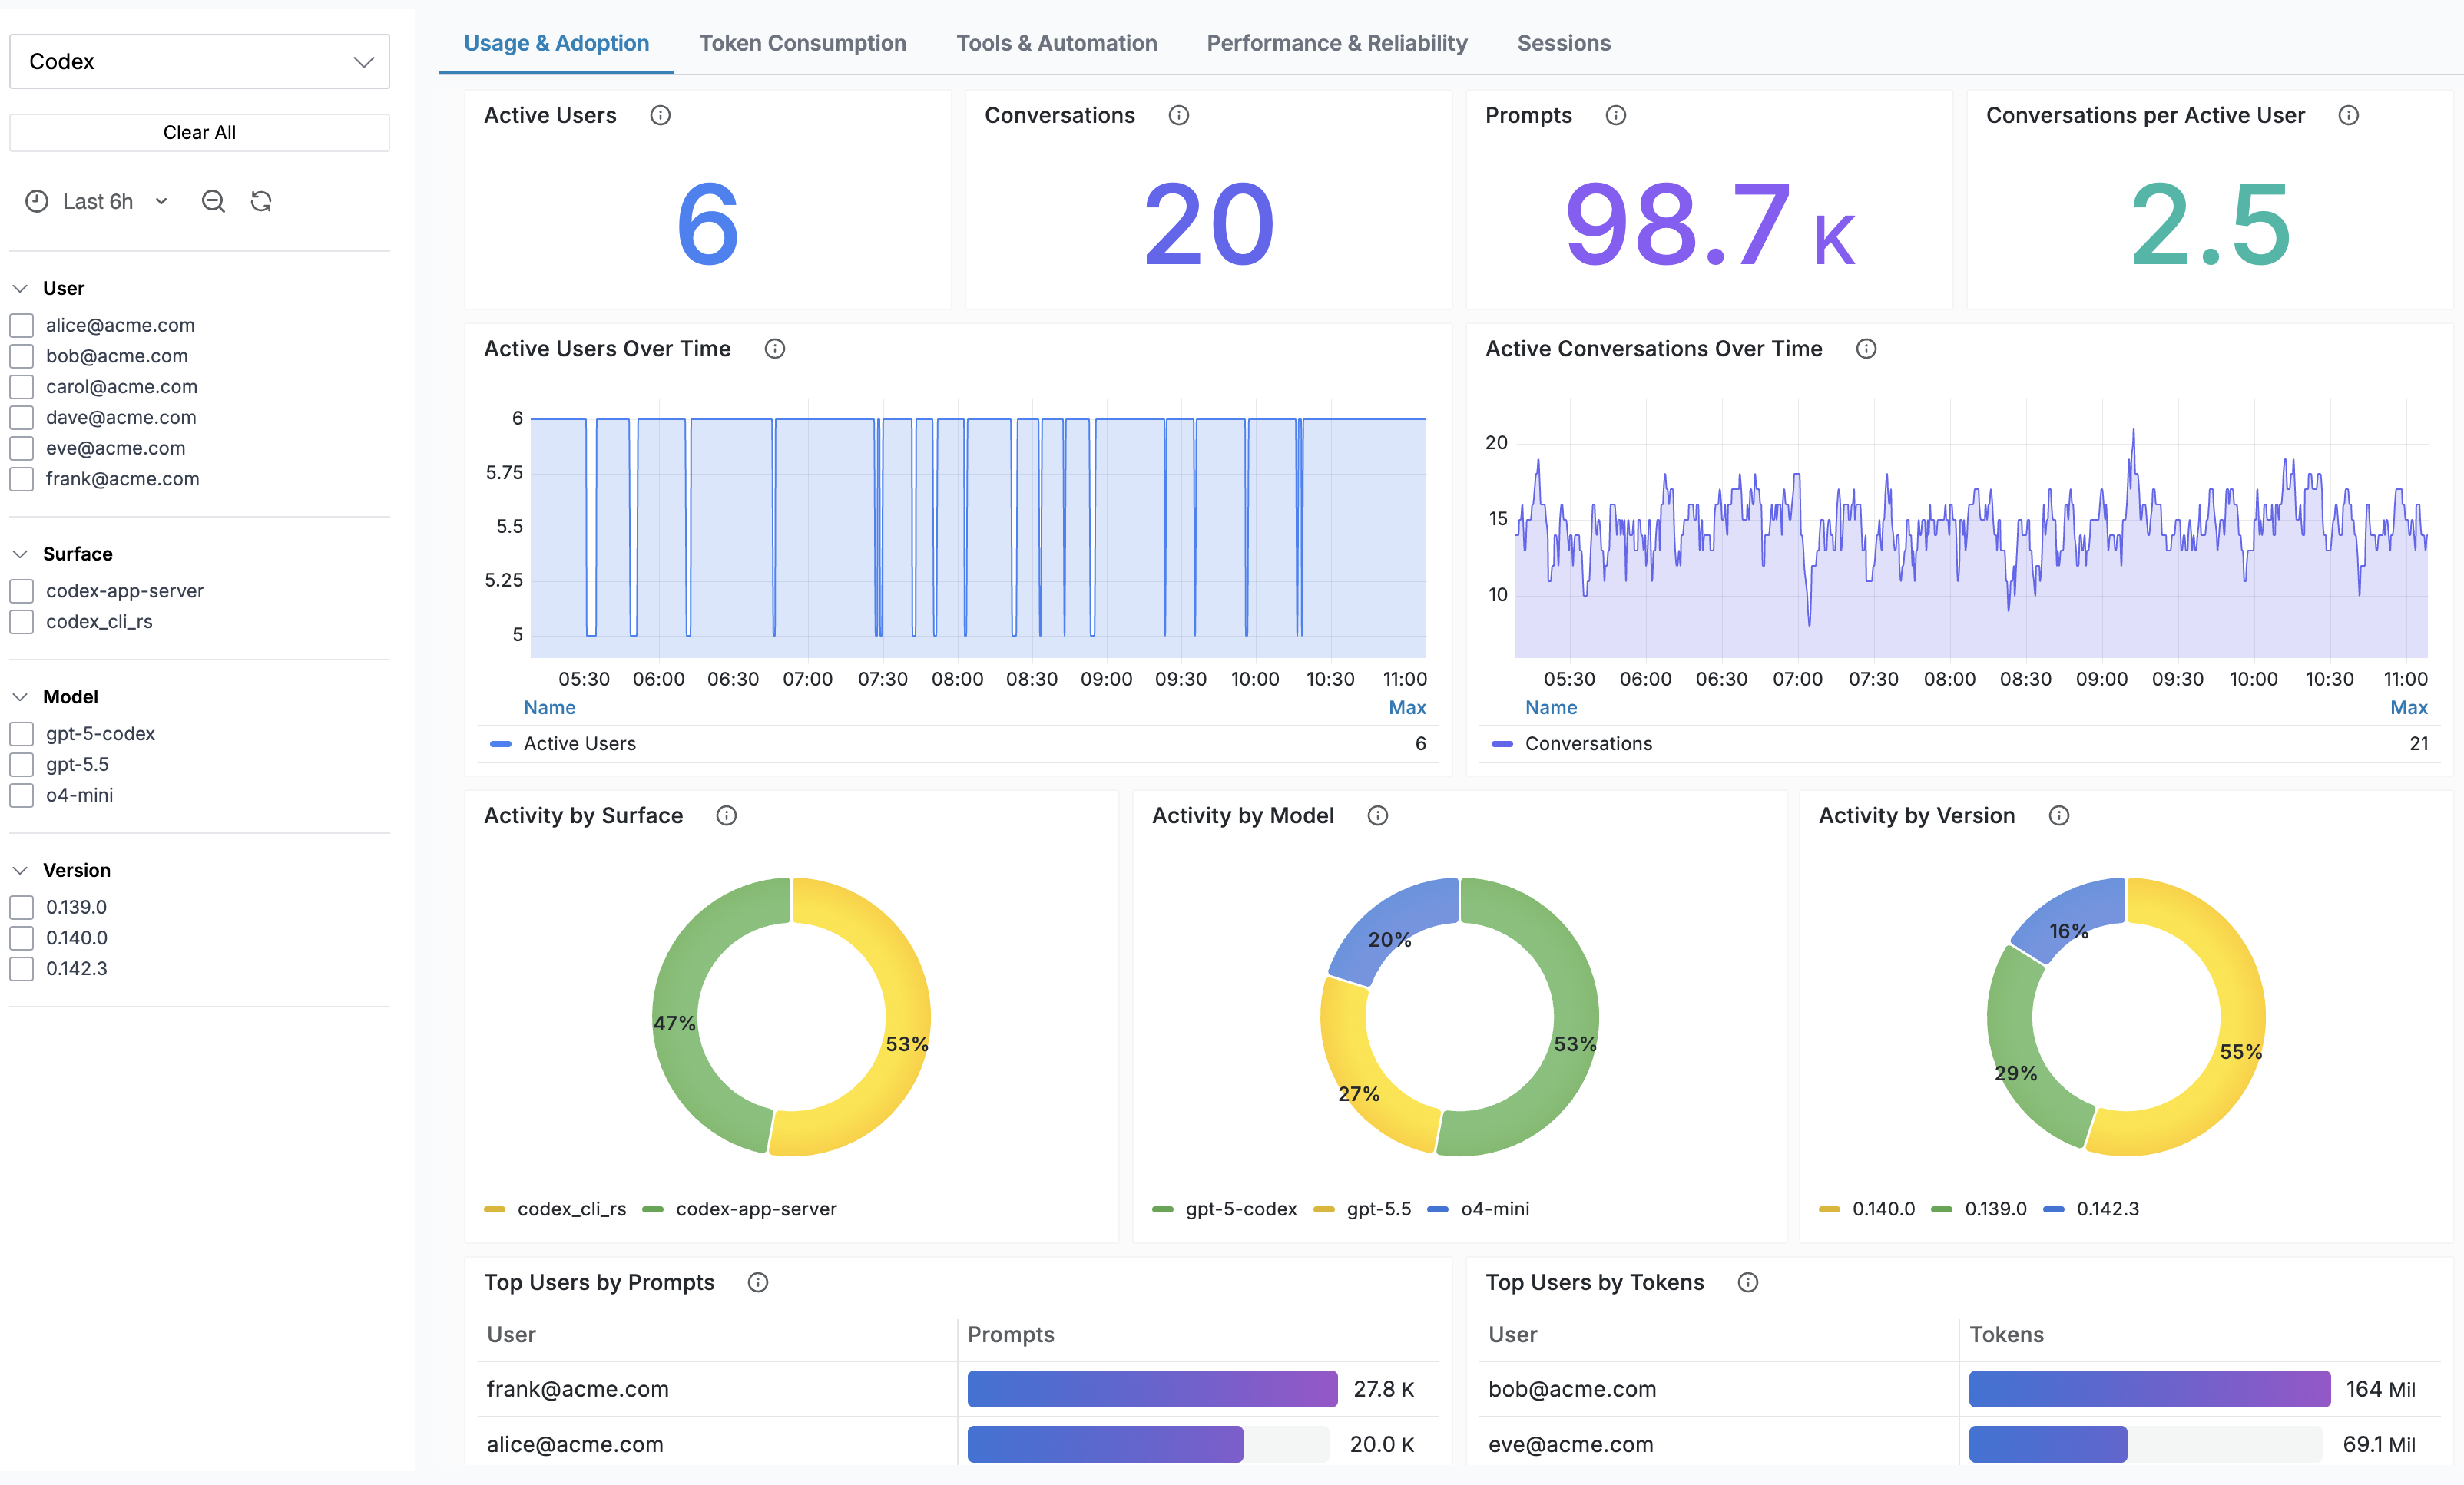
The AI Agent Analysis page is available in the sidebar under AI Cost Management. It has a set of dashboard tabs tailored to each agent, plus a Sessions tab.
Use the agent dropdown at the top of the sidebar to switch between Claude, Codex, and Factory Droid.
Dashboard Tabs
Each agent gets pre-built dashboards organized around the questions leadership asks: adoption, cost and ROI, engineering impact, and tool activity. For example, Claude has Usage and Adoption, Cost and ROI, Engineering Impact, Tools and Automation, and Efficiency tabs; see each agent's page for its tab set.
Sessions Tab
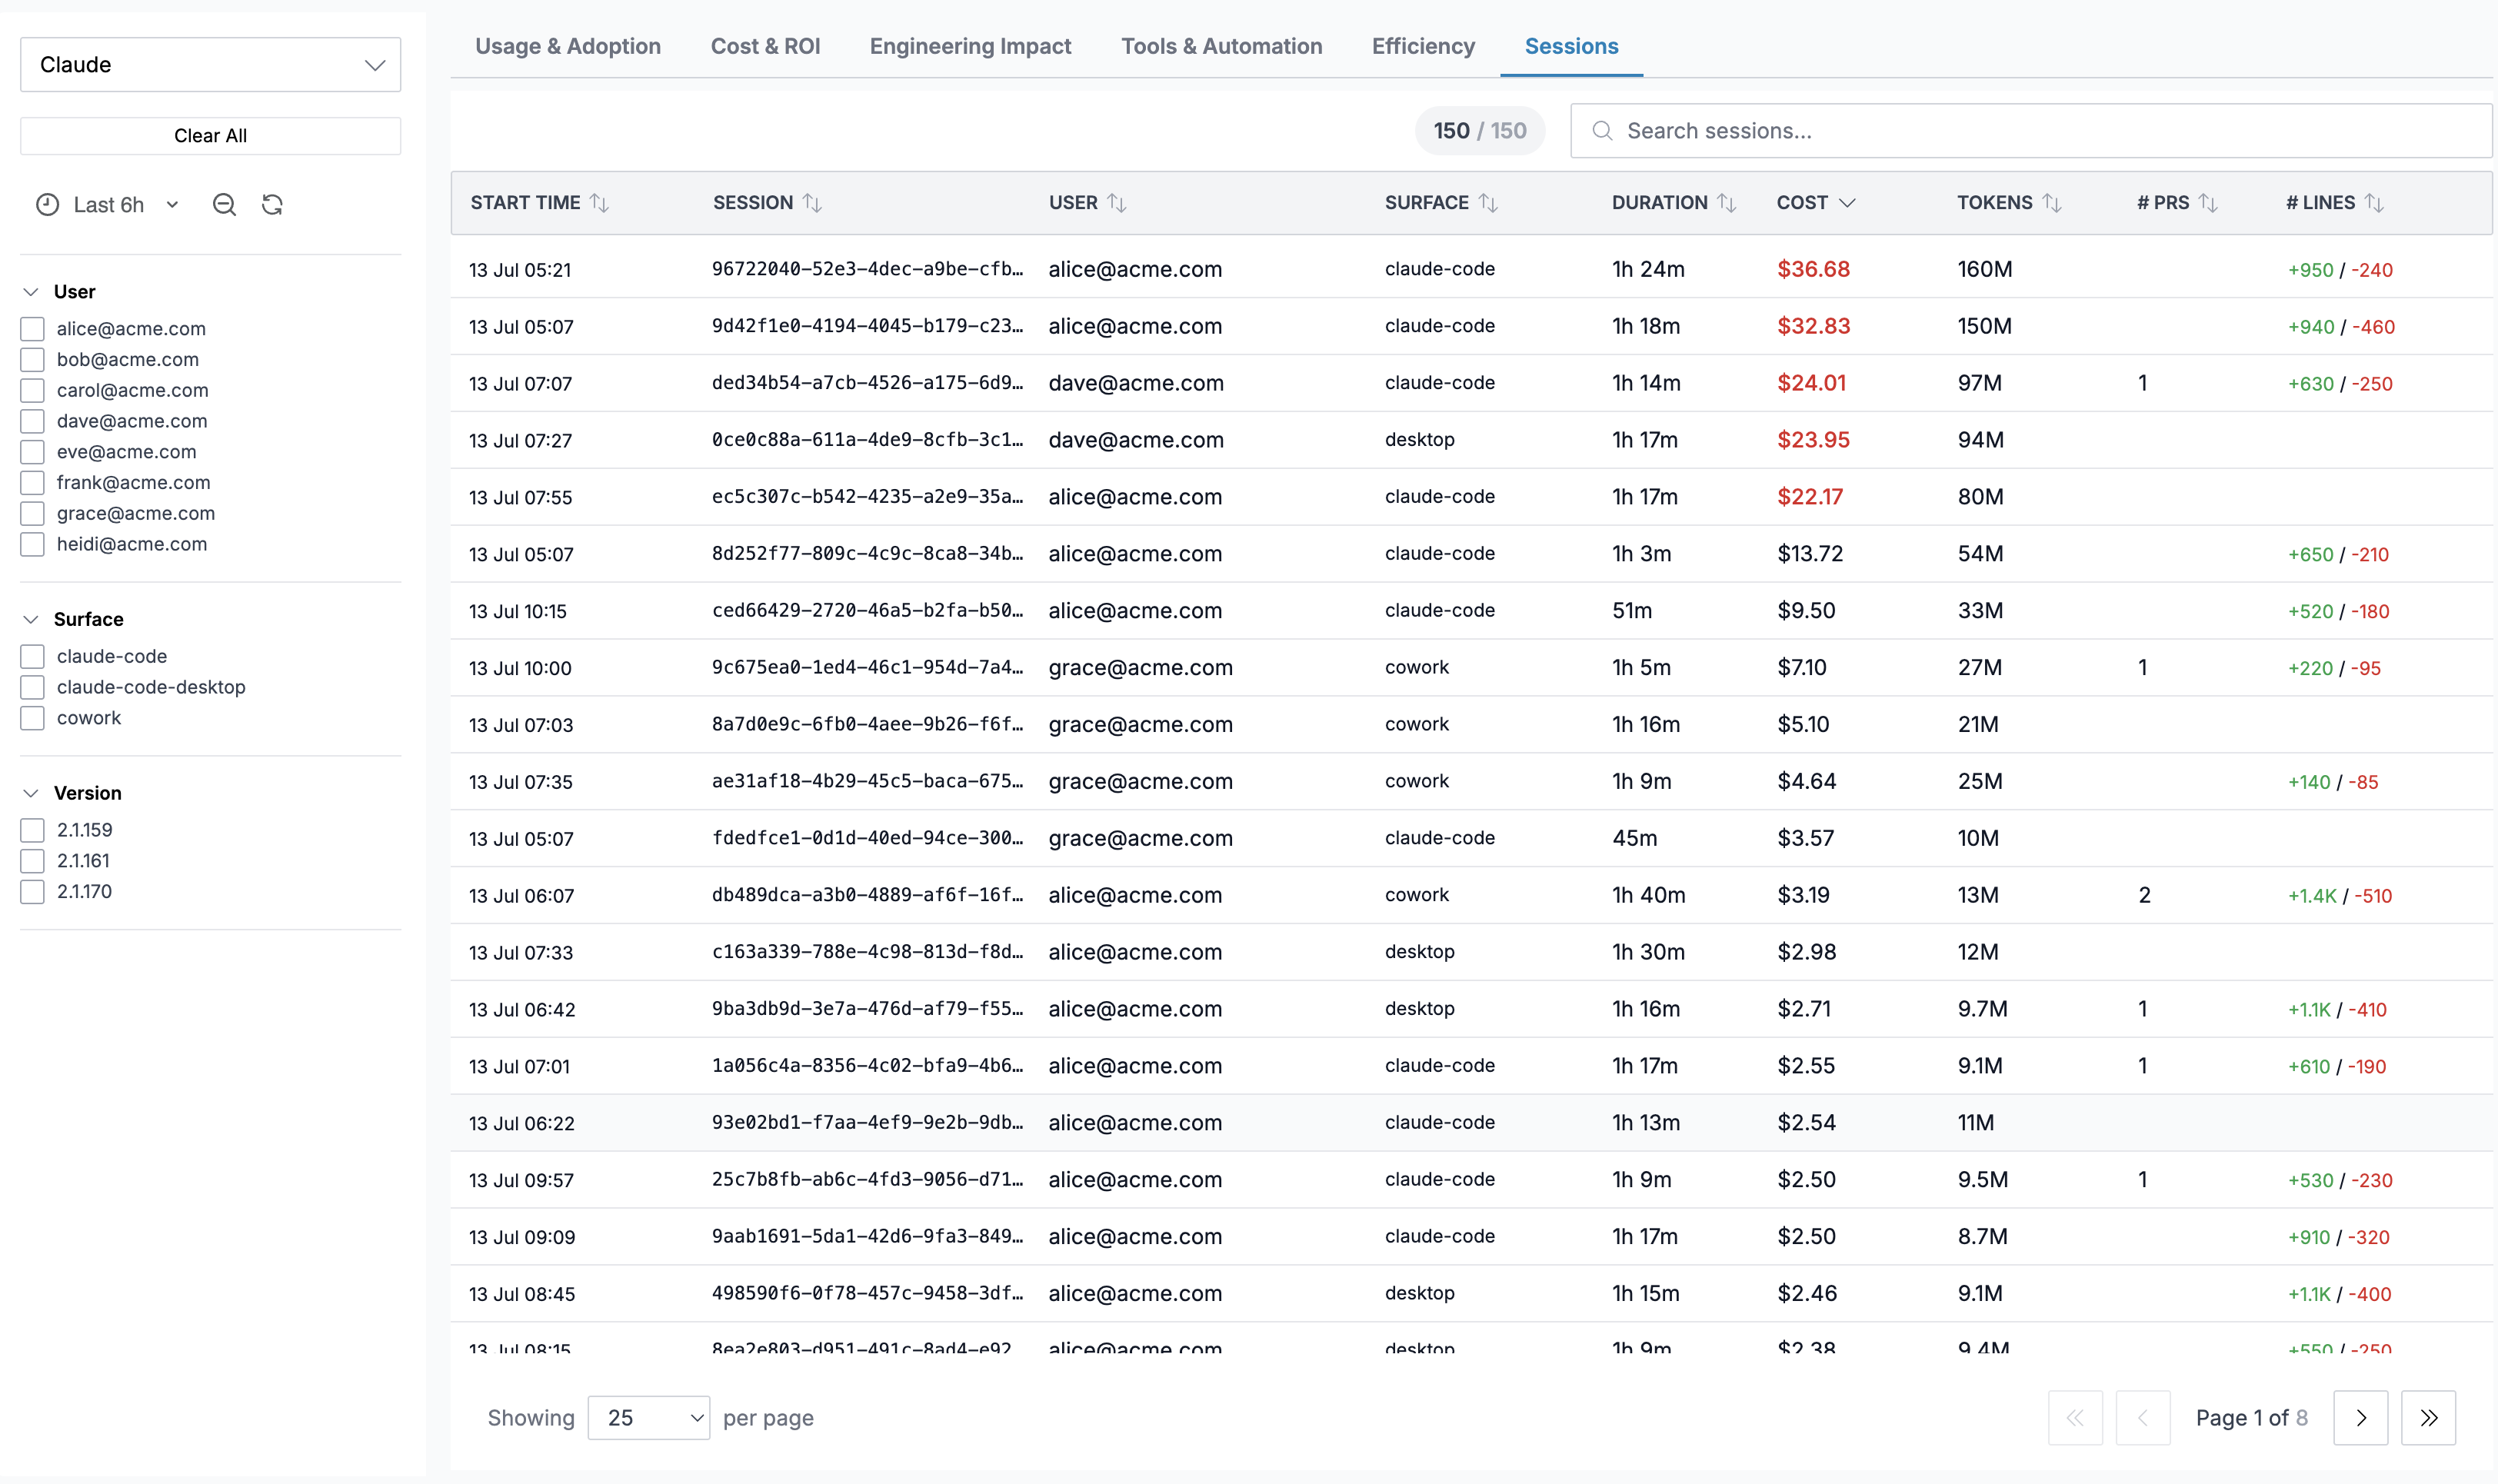
Shows a table of individual sessions with key stats. Click any row to open a Session Detail drawer showing a turn-by-turn timeline of every event.
Sidebar Filters
A sidebar on the left lets you filter data by:
- Time Range: Grafana-style time range picker
- Event Type: filter events by type (sessions tab only)
- Status: OK or HasError (sessions tab only)
- Model: filter by LLM model
- User: filter by developer email
- App Version: filter by agent version
- Terminal: filter by terminal type
Best Practices
- Start with a single user to verify telemetry is flowing before rolling out org-wide.
- Enable prompt logging to get full prompt text in the event timeline, which is useful for understanding usage patterns.
- Set up alerts on cost or token metrics to catch unexpected spending spikes.
- Use sidebar filters to drill down by user or model when investigating specific sessions.
Support
If you need assistance or have any questions, please reach out to us through:
- Email at [email protected]