Factory Droid
Factory's Droid CLI has native OpenTelemetry support. Once enabled, Oodle collects metrics so you can track adoption, engineering impact, tool activity, and the repositories Droid works in across your organization.
Getting Started
1. Enable Telemetry
The fastest way is to use the integration tile in the Oodle UI:
- Navigate to Settings → Integrations
- Open the AI Observability section
- Click the Factory Droid tile
- Select an API key and follow the steps shown
Alternatively, set two environment variables wherever Droid runs (shell profile, CI environment, or MDM-managed configuration):
# Droid appends /v1/metrics to the endpoint
export OTEL_TELEMETRY_ENDPOINT=https://<OTLP_ENDPOINT>
export OTEL_TELEMETRY_HEADERS="X-API-KEY=<API_KEY>,X-OODLE-INSTANCE=<INSTANCE_ID>"
Replace <OTLP_ENDPOINT>, <API_KEY>, and
<INSTANCE_ID> with values from the integration tile.
Metrics export every 60 seconds while sessions are active, and flow to both Factory and Oodle simultaneously. A failure to reach Oodle never affects Droid itself.
2. Roll Out to Your Team
Add the two environment variables to your dotfiles repository, developer machine images, or configuration management tool.
3. Verify Data
Once telemetry starts flowing, navigate to AI Cost Management → Factory Droid in the Oodle sidebar.
Analysis Page
The Factory Droid page is organized around the questions engineering leadership asks, with a tab per use case.
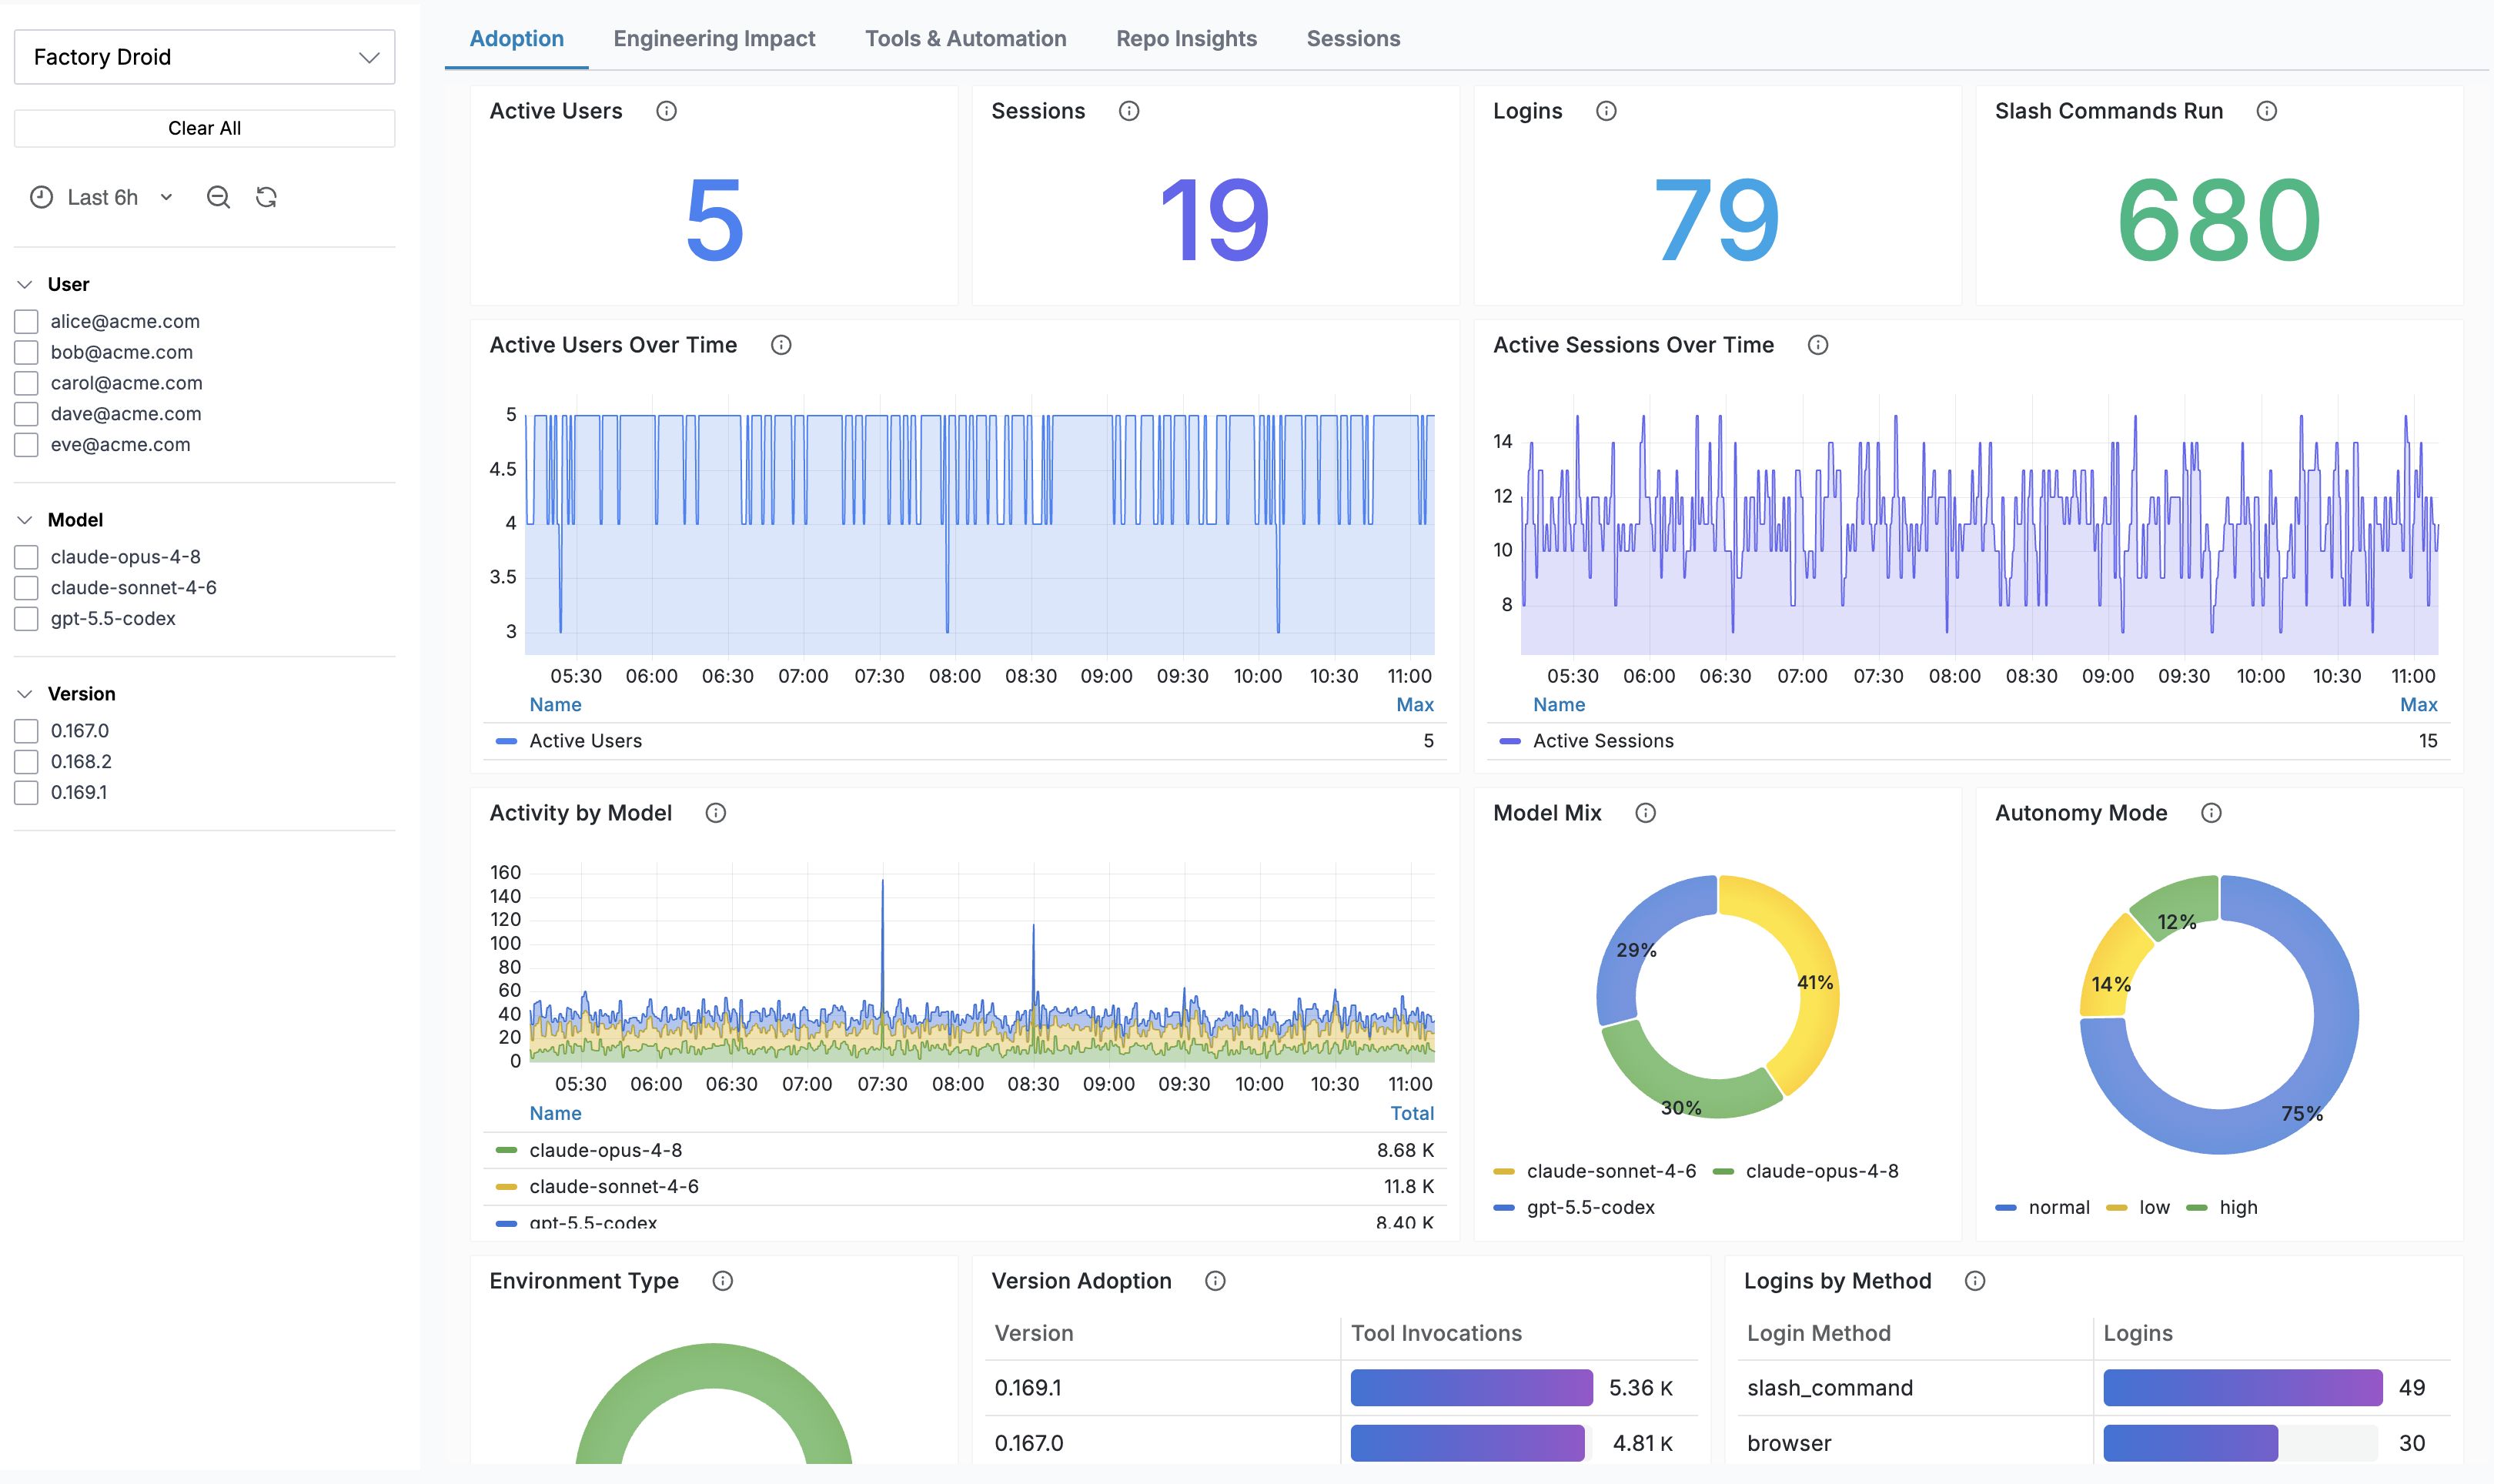
Adoption
Is Factory getting adopted, and by whom?
| Panel | Description |
|---|---|
| Active Users / Sessions | Distinct users and sessions with Droid activity |
| Logins and Slash Commands | Engagement signals over the selected range |
| Activity by Model | Which models drive Droid usage |
| Model Mix / Autonomy Mode / Environment | How Droid is run: model split, autonomy levels, interactive vs other environments |
| Version Adoption | How quickly the team upgrades the Droid CLI |
| Top Users by Activity | The power users driving adoption, sorted and paginated |
Engineering Impact
What is Droid actually producing?
| Panel | Description |
|---|---|
| Files Modified / Lines Modified | Code change volume attributable to Droid |
| Commits and PRs Created | How much of Droid's work ships |
| Files Read vs Files Modified | Exploration vs change balance |
| By Extension | Which parts of the stack Droid touches most |
| Per-User Leaderboards | Lines, commits, and PRs by developer |
Tools & Automation
How does Droid work, and where does it struggle?
| Panel | Description |
|---|---|
| Tool Invocations and Success Rate | Overall tool call volume and health |
| Execution Time (p50 / p95) | Tool latency trends and per-tool p95 |
| Tool Failures | Which tools fail most |
| MCP Tools / Skills / Hooks | Automation surface usage: MCP calls by server, skill invocations, hook activity |
| Installed Skills Inventory | Which skills are installed, and where |
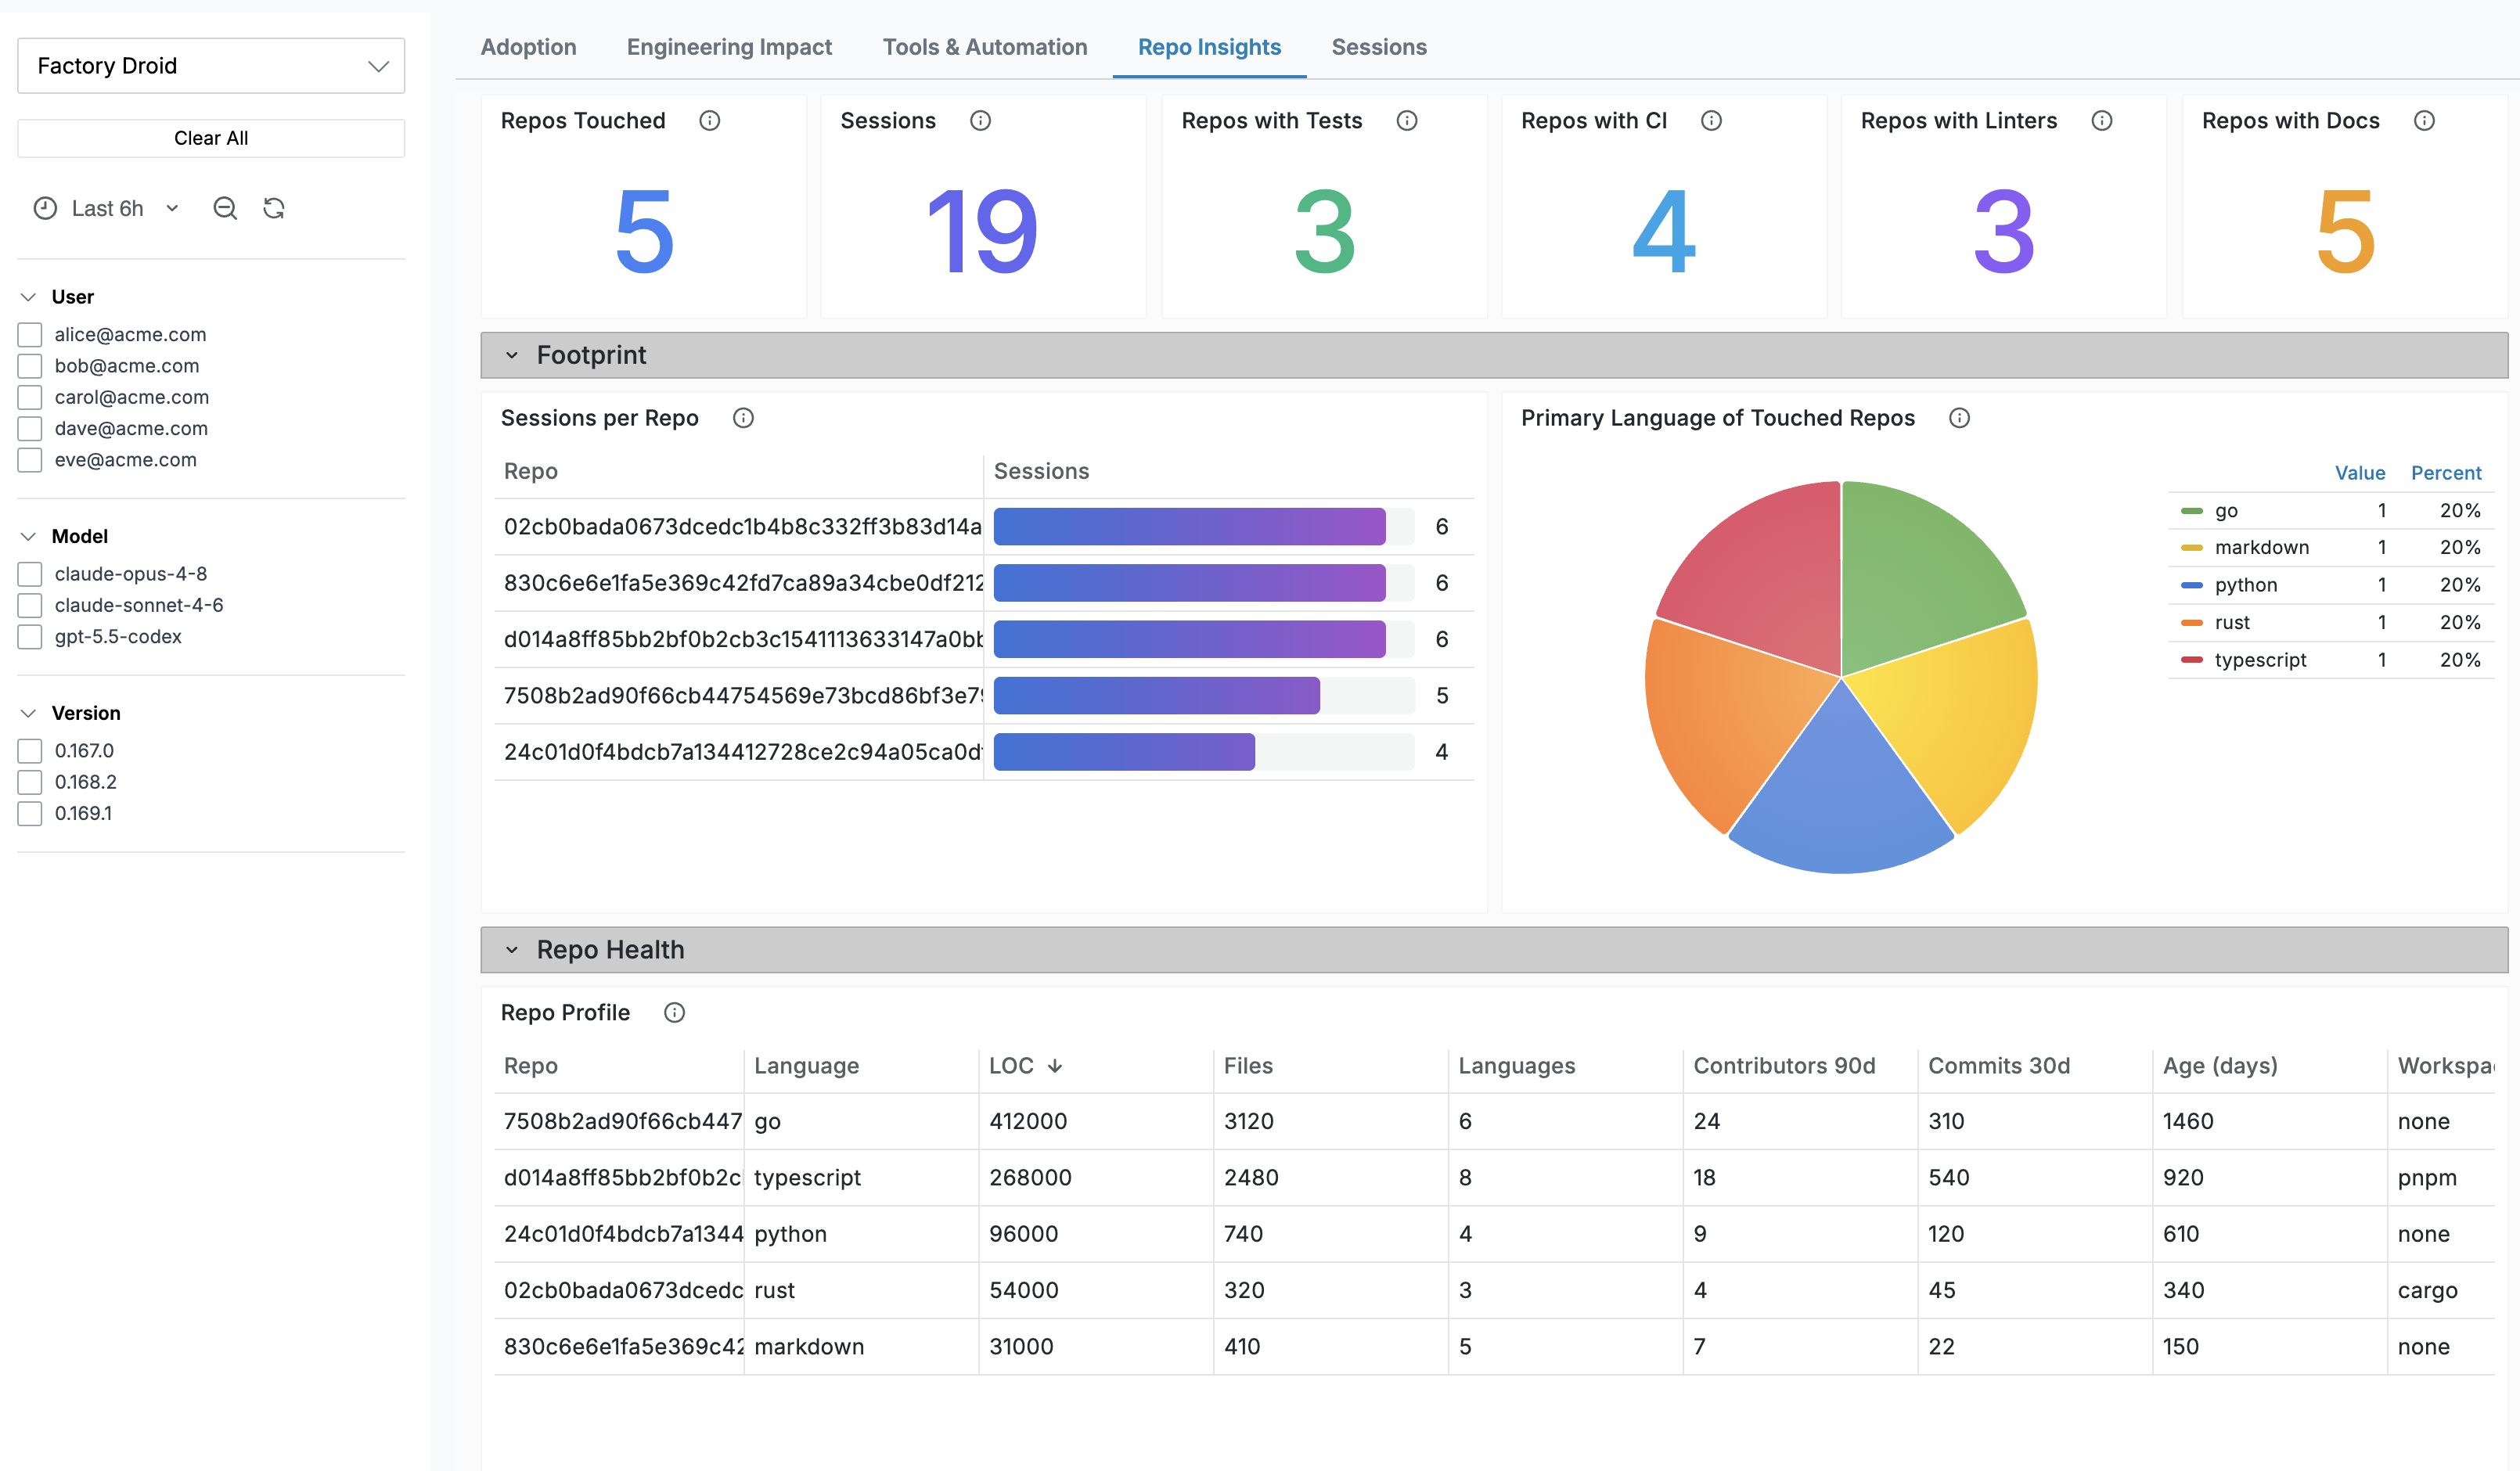
Repo Insights
Where across your codebase estate does Droid operate,
and how healthy are those repos? Built from the
droid_repo_metadata metric that Droid emits for every
session:
| Panel | Description |
|---|---|
| Repos Touched / Sessions per Repo | Coverage of your repository estate |
| Repos with Tests / CI / Linters / Docs | Guardrail coverage of the repos Droid works in |
| Primary Language Distribution | Language mix of touched repos |
| Repo Profile | Per-repo size, languages, contributors, and commit velocity |
| Repo Guardrails | Test frameworks, CI/CD, linters, security, and observability tooling per repo |
Repositories are identified by a privacy-preserving hash of the remote URL, so repository names and URLs never leave the developer's machine.
Sessions
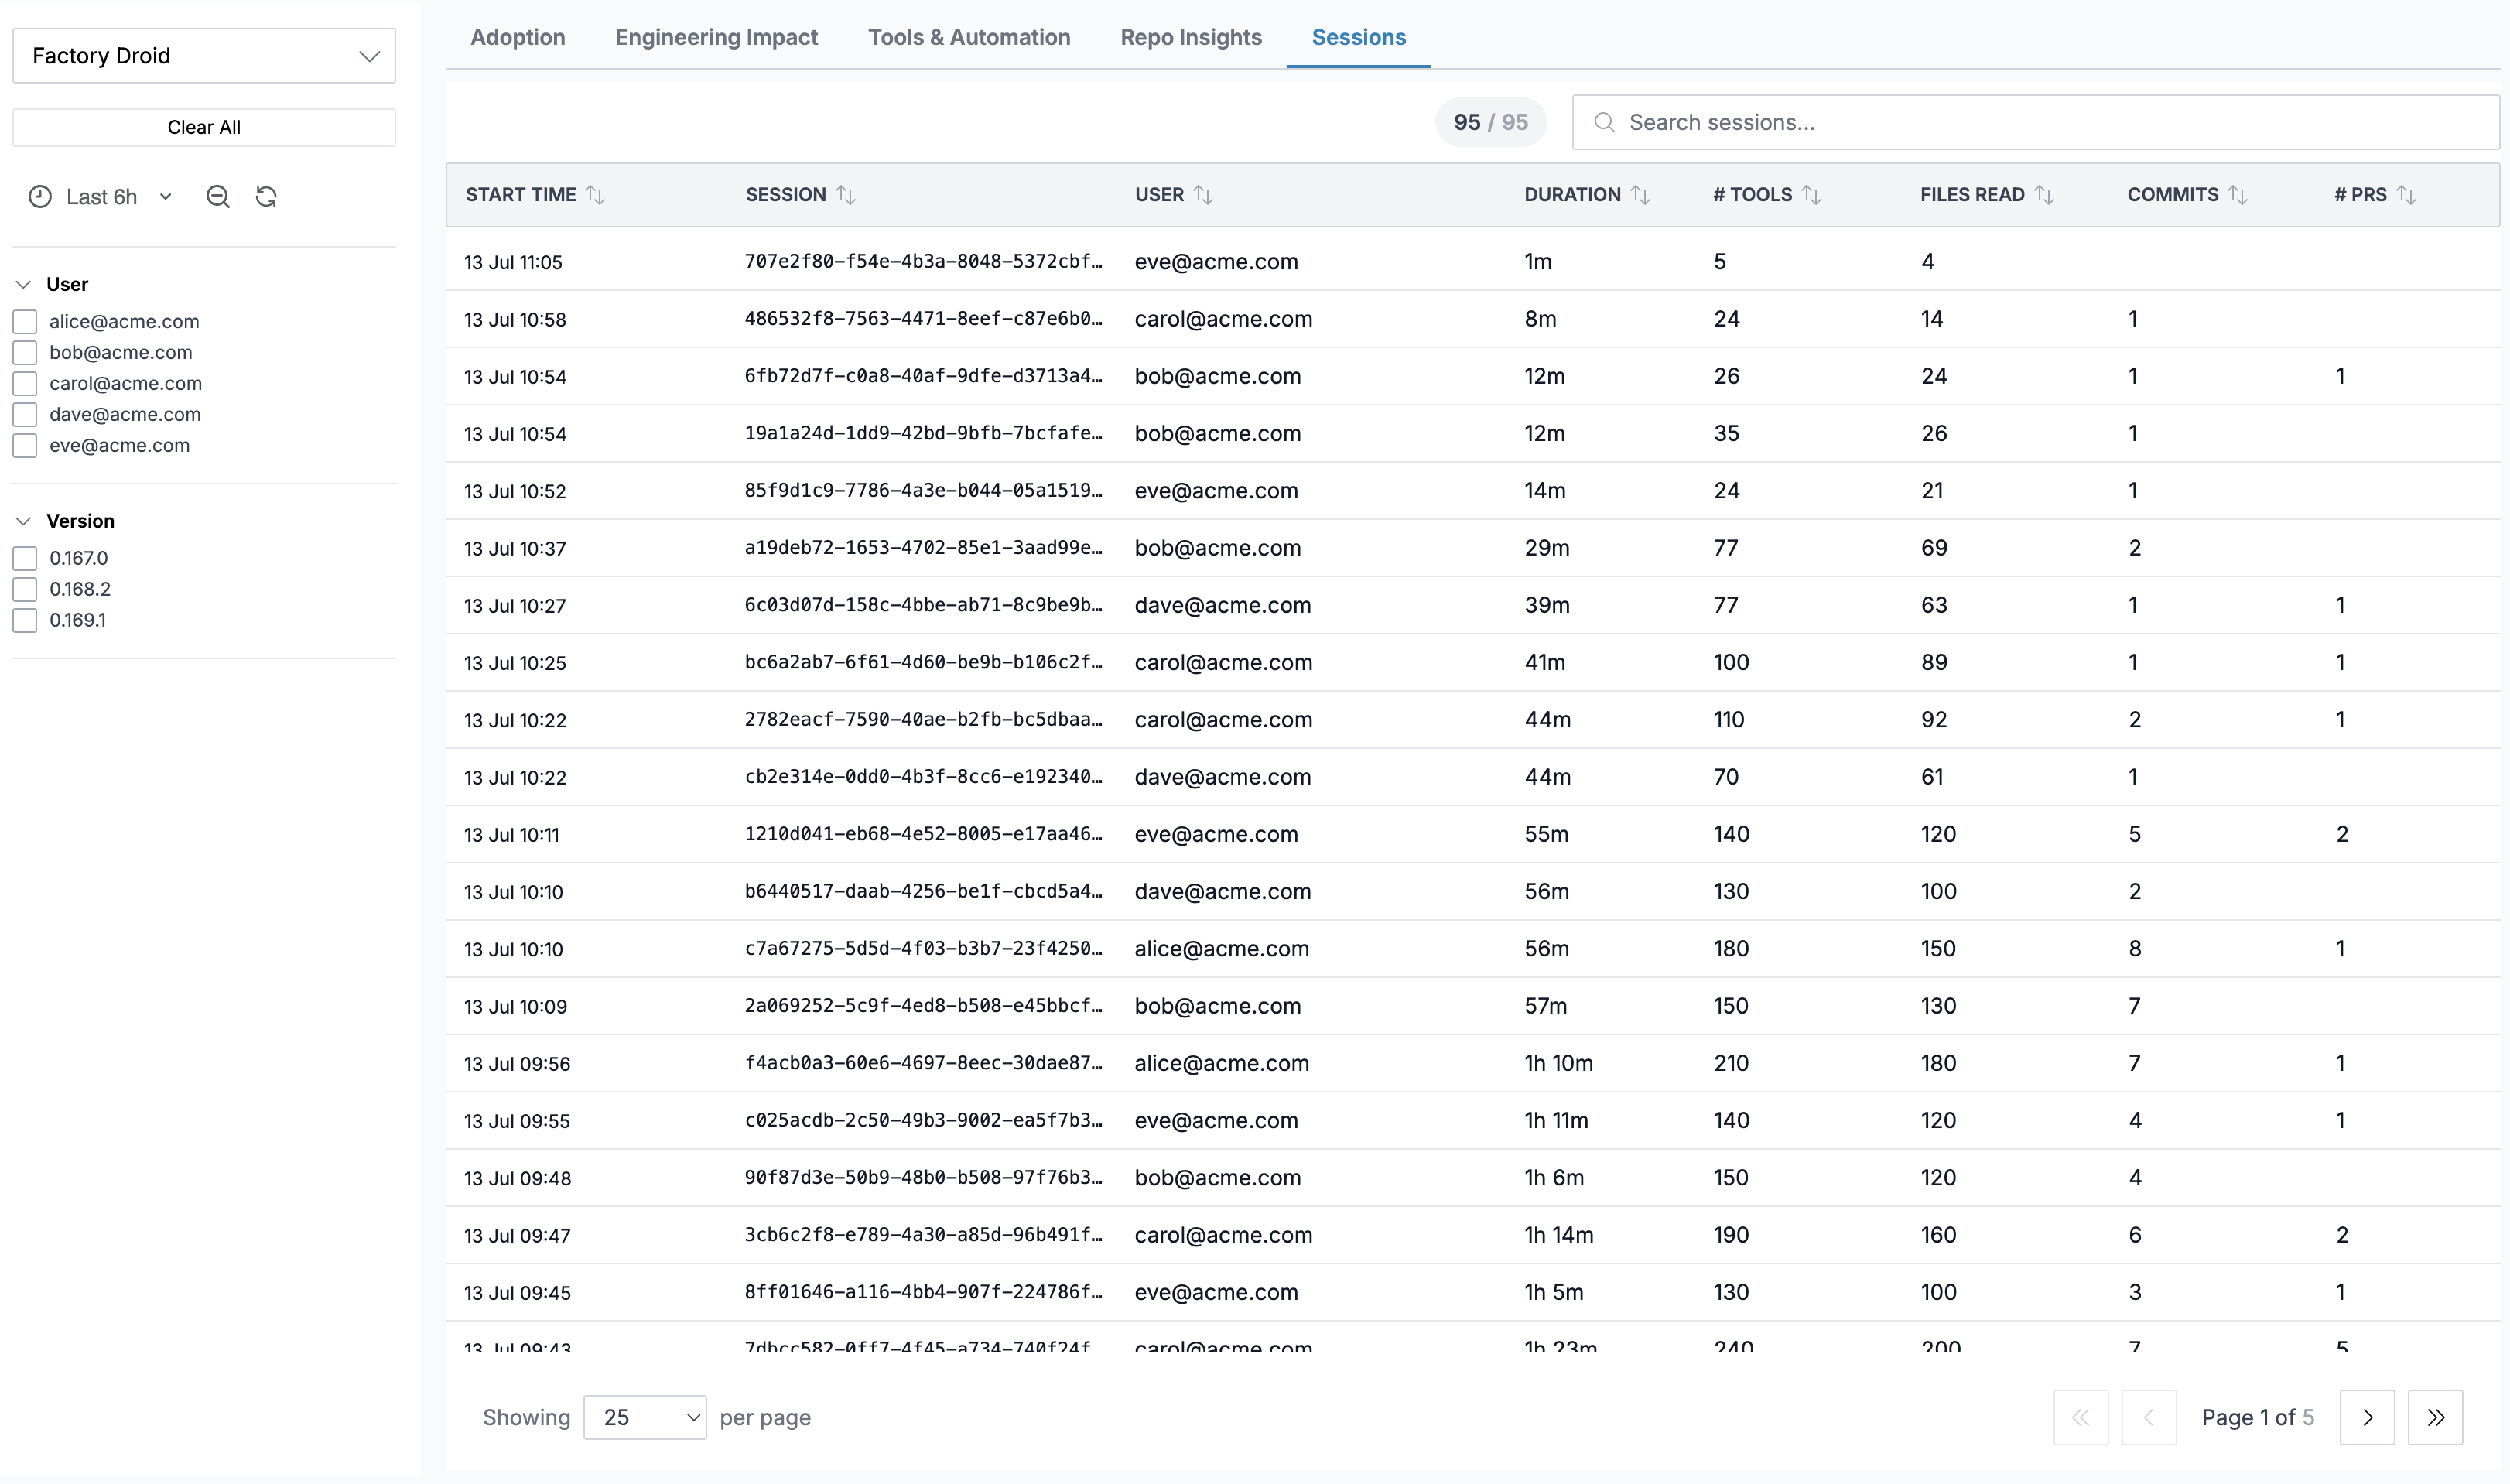
The Sessions tab lists individual Droid sessions built entirely from metrics:
| Column | Description |
|---|---|
| Start Time | When the session began |
| Session | Droid session ID |
| User | Email of the developer |
| Duration | Wall-clock duration |
| # Tools | Tool invocations in the session |
| Files Read | Files Droid read |
| Commits | Commits created |
| # PRs | Pull requests created |
What Gets Collected
Droid exports the following OpenTelemetry metrics with
delta temporality. Every data point carries
user.email, user.id, session.id, model_id,
organization.id, and service.version, so all views
can be filtered by user, model, and version.
| Metric | Extra Labels | Description |
|---|---|---|
droid.tool.invocations | tool_name, tool_category, tool_runtime, tool_succeeded, environment_type, session_autonomy_mode | Tool invocations |
droid.tool.execution_time | same as invocations | Tool execution time histogram (ms) |
droid.code.files_read | file_extension | Files read |
droid.code.files_modified | file_extension | Files modified |
droid.code.lines_modified | Lines of code modified | |
droid.git.commits | Commits created | |
droid.git.pull_requests | Pull requests created | |
droid.mcp.tool_invocations | mcp_server, tool_name | MCP tool invocations |
droid.skill.invocations | skill_name | Skill invocations |
droid.hook.invocations | Hook invocations | |
droid.slash_command.invocations | slash_command_name | Slash command usage |
droid.auth.login_success | auth_login_method | Successful logins |
droid.repo.metadata | repo_* profile labels | Per-session repository profile snapshot (language, size, tests, CI, linters, contributors, commit velocity) |
Further Reading
Support
If you need assistance or have any questions, please reach out to us through:
- Email at [email protected]