Trace Lookup
Trace Lookup lets you find a specific distributed trace by its Trace ID. Use it when you already know which trace you want to inspect — for example, from a log line, an error report, or a correlation ID in an alert.
Getting Started
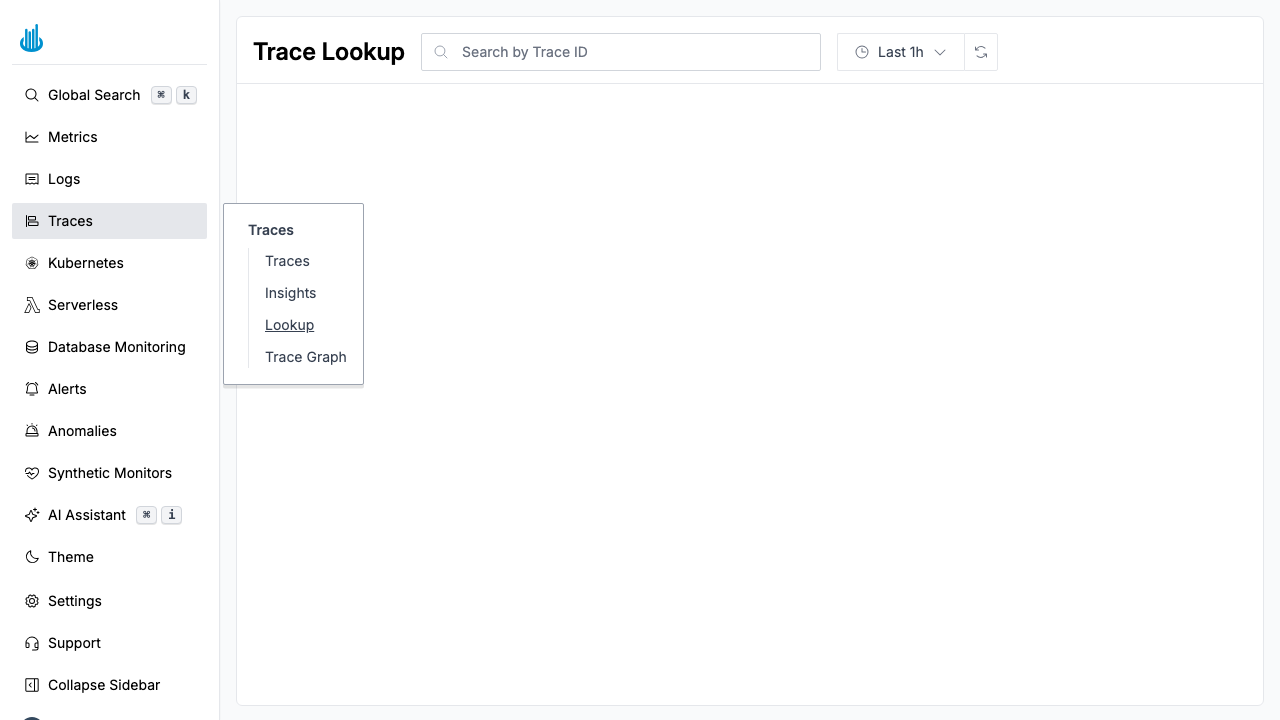
Navigate to Traces → Lookup in the sidebar. The page displays a search bar where you can enter a Trace ID.
How to Use
- Paste a Trace ID into the search field.
- Adjust the time range if needed — the time picker defaults to the last hour. Extend it if the trace occurred further in the past.
- Press Enter or click the search button.
- A trace summary bar appears showing the number of spans and overall duration.
- The trace detail view opens below, showing the full span waterfall, latency breakdown, and span attributes.
If the trace is not found, a "Trace Not Found" message is displayed. Try widening the time range.
Where to Find a Trace ID
Trace IDs appear in many places throughout Oodle:
- Log events — If your logs include a
trace_idfield, click it to jump directly to the trace. - Alerts — Alerts triggered by trace-based monitors often include the Trace ID.
- Application code — Most tracing SDKs expose the Trace ID in error handlers and logging integrations.
- Trace Explorer — Copy the Trace ID from the traces table for later reference.
Best Practices
- Widen the time range if the lookup returns no results. The trace may have occurred outside the default one-hour window.
- Use Trace Lookup for debugging specific requests — When a user reports a slow request and provides a correlation ID, paste it here for instant access to the full trace.
Related Pages
- Trace Graph — Visualize service dependencies and latency.
- Trace Explorer — Search and filter traces across services.
Support
If you need assistance or have any questions, please reach out to us through:
- Email at [email protected]