Trace Graph
Trace Graph renders a live, interactive service-dependency map built from your trace data. Each node represents a service, and edges show the call relationships between them. Use it to understand your architecture, spot bottlenecks, and identify failing dependencies at a glance.
Getting Started
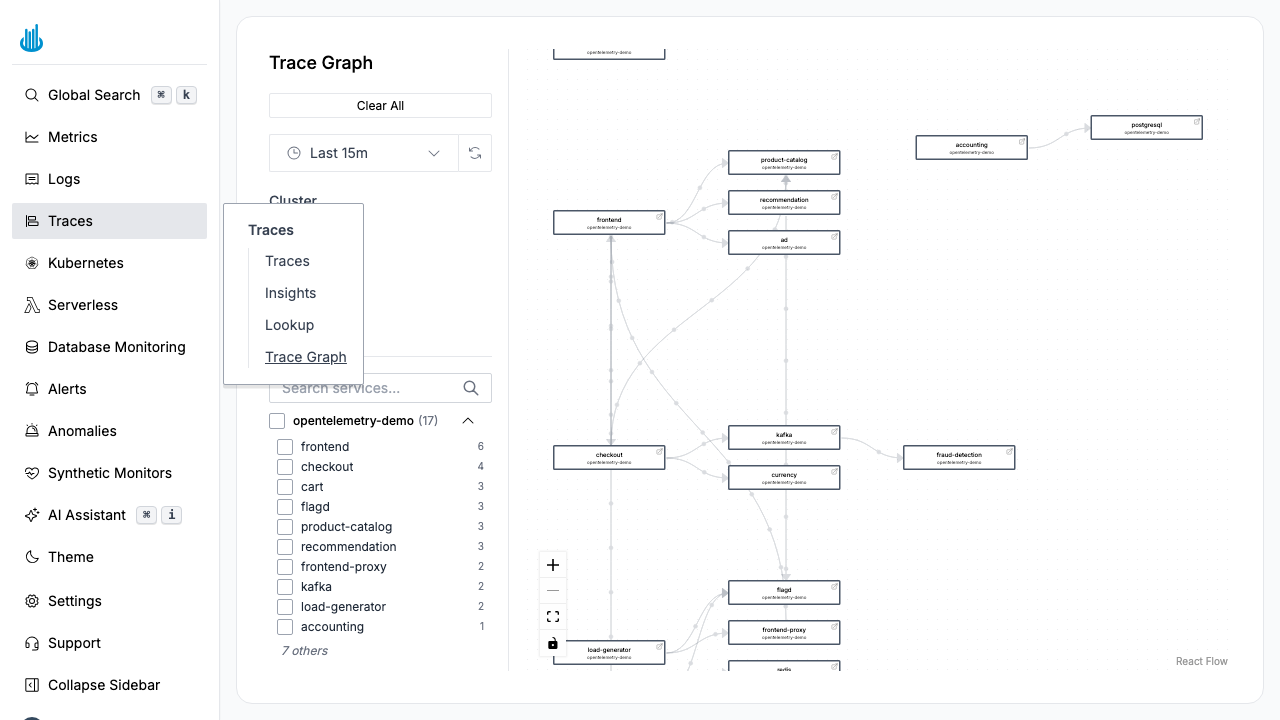
Navigate to Traces → Trace Graph in the sidebar. The graph populates automatically from trace spans observed in the selected time range.
Reading the Graph
Nodes
Each node represents a service (identified by the
service.name span attribute). Nodes are color-coded by health:
| Color | Meaning |
|---|---|
| Green | Healthy — low error rate |
| Yellow / Orange | Warning — elevated error rate |
| Red | Critical — high error rate |
Edges
Directed arrows between nodes indicate that one service calls another. The arrow direction follows the request flow (caller → callee).
Sidebar Filters
The left-hand sidebar provides several filter controls:
- Environment — Filter by deployment environment (e.g. production, staging).
- Cluster — Filter by Kubernetes cluster.
- Health status — Show only Healthy, Warning, or Critical services.
- Service search — Type to find a specific service by name.
- Service checkboxes — Toggle individual services on or off to simplify the view.
- Hide services with no connections — Remove isolated nodes from the graph.
- Compare with previous period — Enable comparison stats to see how metrics have changed.
Time Range
Use the time picker in the sidebar to change the observation window (maximum 24 hours). A shorter window shows recent call patterns; a longer window provides a broader picture.
Interacting with the Graph
- Pan and zoom — Use the mouse wheel to zoom and drag to pan. The toolbar buttons (Zoom In, Zoom Out, Fit View) are also available.
- Click a node — Opens a detail panel showing the service's error rate, latency percentiles, and throughput.
- Hover an edge — Displays the request rate and error rate for that specific call path.
Use Cases
- Architecture discovery — Visualize how microservices interact without reading code or config files.
- Incident triage — During an outage, identify which upstream or downstream dependency is the root cause.
- Performance analysis — Find hot paths where multiple services converge and latency compounds.
- Dependency auditing — Verify that services only communicate with expected dependencies.
Best Practices
- Use a short time range (15 minutes) for real-time incident investigation.
- Use a longer range (1–24 hours) for architecture review and dependency mapping.
- Filter by cluster when you have multiple environments to avoid mixing production and staging traffic.
Related Pages
- Trace Lookup — Find a specific trace by its Trace ID.
- Trace Explorer — Search and filter traces across services.
Support
If you need assistance or have any questions, please reach out to us through:
- Email at [email protected]