Logs Visualization

The logs system uses a custom columnar storage engine that handles high-volume queries without timeouts. The interface includes AI-powered analysis, automatic pattern detection, and direct integration with metrics and traces.
Query Logs
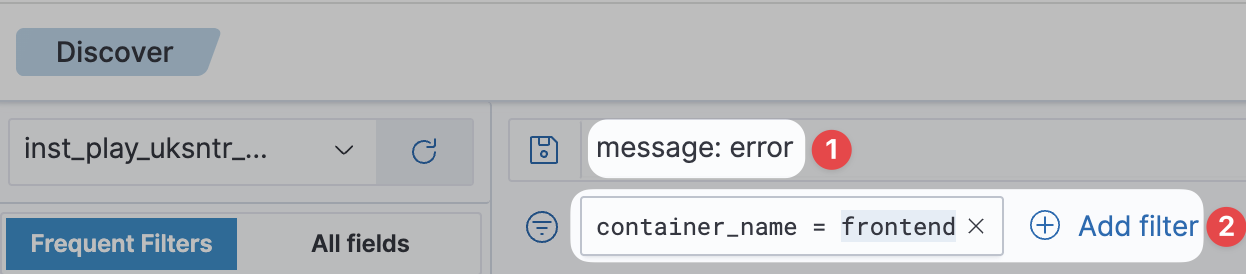
The logs page gives you two ways to find log lines:
- Search bar: type a query in Lucene syntax.
- Add filter: pick a field, an operator and a value from menus. The field menu lists the fields that your logs have, so you do not need to know the syntax.
You can use both at the same time. Oodle combines the search bar query
and all the enabled filters with AND.
Common Queries
| Goal | Search bar (Lucene) | Filter (field, operator, value) |
|---|---|---|
| Find a phrase in the log message | payment gateway timeout | message, contains, payment gateway timeout |
| Find logs from one container | container_name:currency | container_name, contains, currency |
| Match the container name exactly | container_name.keyword:currency | container_name, equals, currency |
| Find errors | level:ERROR | level, contains, ERROR |
| Find errors from one container | level:ERROR AND container_name:currency | two filters, one for each condition |
| Find logs from either of two containers | container_name:(currency OR frontend) | container_name, contains one of, currency and frontend |
| Exclude a container | NOT container_name:currency | container_name, does not contain, currency |
| Find errors in one container, without health checks | message:error AND NOT message:health AND container_name:api-server | three filters: message contains error, message does not contain health, container_name contains api-server |
| Match a part of a word | *err* | message, contains, err, with Partial Word Match on |
| Ignore upper and lower case | container_name.caseIgnore:CURRENCY | container_name, contains, CURRENCY, with Case Insensitive on |
Free Text Search
Type words in the search bar without a field name. Oodle searches the
message field for those words as one phrase:
payment gateway timeout
Oodle reads this as message:"payment gateway timeout" and returns the
log lines that contain the three words together.
This is different from OpenSearch on purpose. OpenSearch reads the same
input as message:payment OR message:gateway OR message:timeout, which
returns every line that has any one of the three words. Oodle keeps the
words together, because that is almost always the intent.
To search for any one of the words, write the OR operator yourself.
When your query contains OR, Oodle applies the standard Lucene rules:
payment OR gateway OR timeout
Field Search
Put the field name in front of the value, with a colon between them:
container_name:currency
level:ERROR AND container_name:currency
The field names come from the field list on the left of the logs page. Click a field there to see its most frequent values.
Lucene Operators
| Operator | Example | Result |
|---|---|---|
AND | level:ERROR AND container_name:currency | Both conditions are true |
OR | level:ERROR OR level:WARN | At least one condition is true |
NOT or - | NOT level:INFO | The condition is false |
( ) | level:ERROR AND (container_name:currency OR container_name:frontend) | Groups conditions |
" " | message:"connection refused" | Matches the words as a phrase |
field:( ) | container_name:(currency OR frontend), status_code:(500 OR 503) | Several values for one field |
* | *err* | Matches a part of a word |
[a TO b] | duration_ms:[100 TO 500] | Range that includes both limits |
> >= < <= | duration_ms:>1000 | Compares a number |
To search for a character that Lucene uses, such as : or (, put the
value in double quotes:
message:"GET /api/v1/orders: 500"
Word Match and Partial Word Match
A search on the log message matches full words. The query err finds
the log lines that contain err as a full word. It does not find
error or stderr.
To match a part of a word, add * before or after the word. Write the
value without quotes:
*err*
This matches err, error and stderr.
In a filter, select the contains operator and turn on Partial Word
Match:
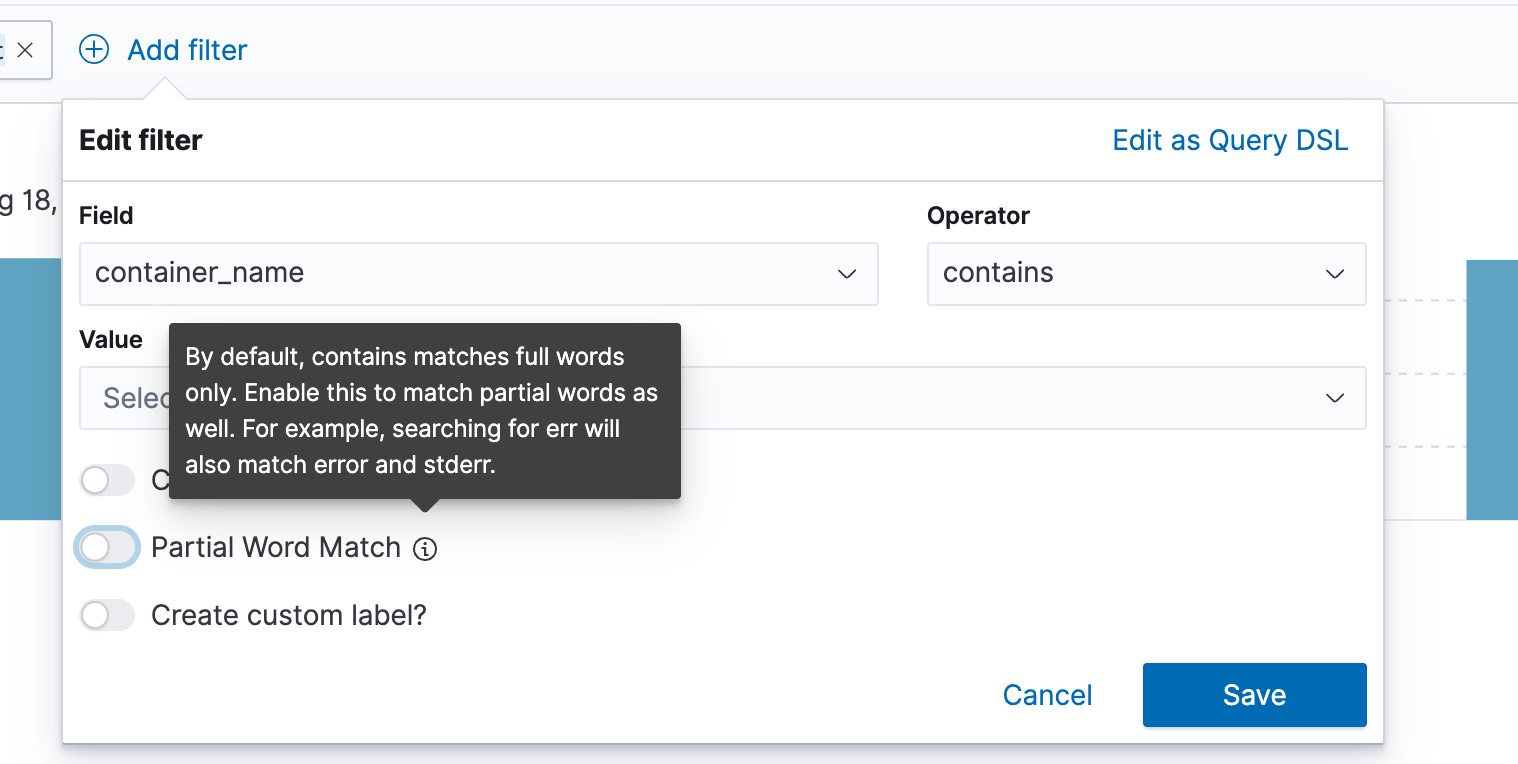
On the other fields, such as container_name, contains already
matches any part of the value. The word rule applies to the log message,
where Oodle uses a word index to keep large queries fast.
Exact Match and Letter Case
A field query matches any value that contains the text. The query
container_name:currency also matches currency-service.
For an exact match, add .keyword to the field name:
container_name.keyword:currency
In a filter, select the equals operator.
Matching is case sensitive. For a match that ignores upper and lower
case, add .caseIgnore to the field name:
container_name.caseIgnore:CURRENCY
In a filter, turn on Case Insensitive.
Filter Operators
Click Add filter to build a filter from a field, an operator and a value. You can also create a filter with one click: expand a log line and use the filter buttons next to any field value.
| Operator | Result |
|---|---|
equals, does not equal | Compares the full value of the field |
equals one of, not equals one of | Compares the full value against a list |
contains, does not contain | Matches the text inside the value |
contains one of, does not contain one of | Matches any item of a list inside the value |
is between, is not between | Compares a number, a date or an IP address against a range |
exists, does not exist | Tests if the field has a value |
Each filter becomes a pill below the search bar. Click the pill to edit, disable, or delete the filter, or to invert it. To write the filter condition directly, click Edit as Query DSL.
Lucene Compatibility
Oodle uses Lucene query syntax, and supports the operators in the table above. Two behaviors are different from OpenSearch on purpose:
- Free text without a field name is a phrase search, not an
ORof the single words. - A search on the log message matches full words. Use
*or the Partial Word Match option to match a part of a word.
Visual Features
Severity Indicators
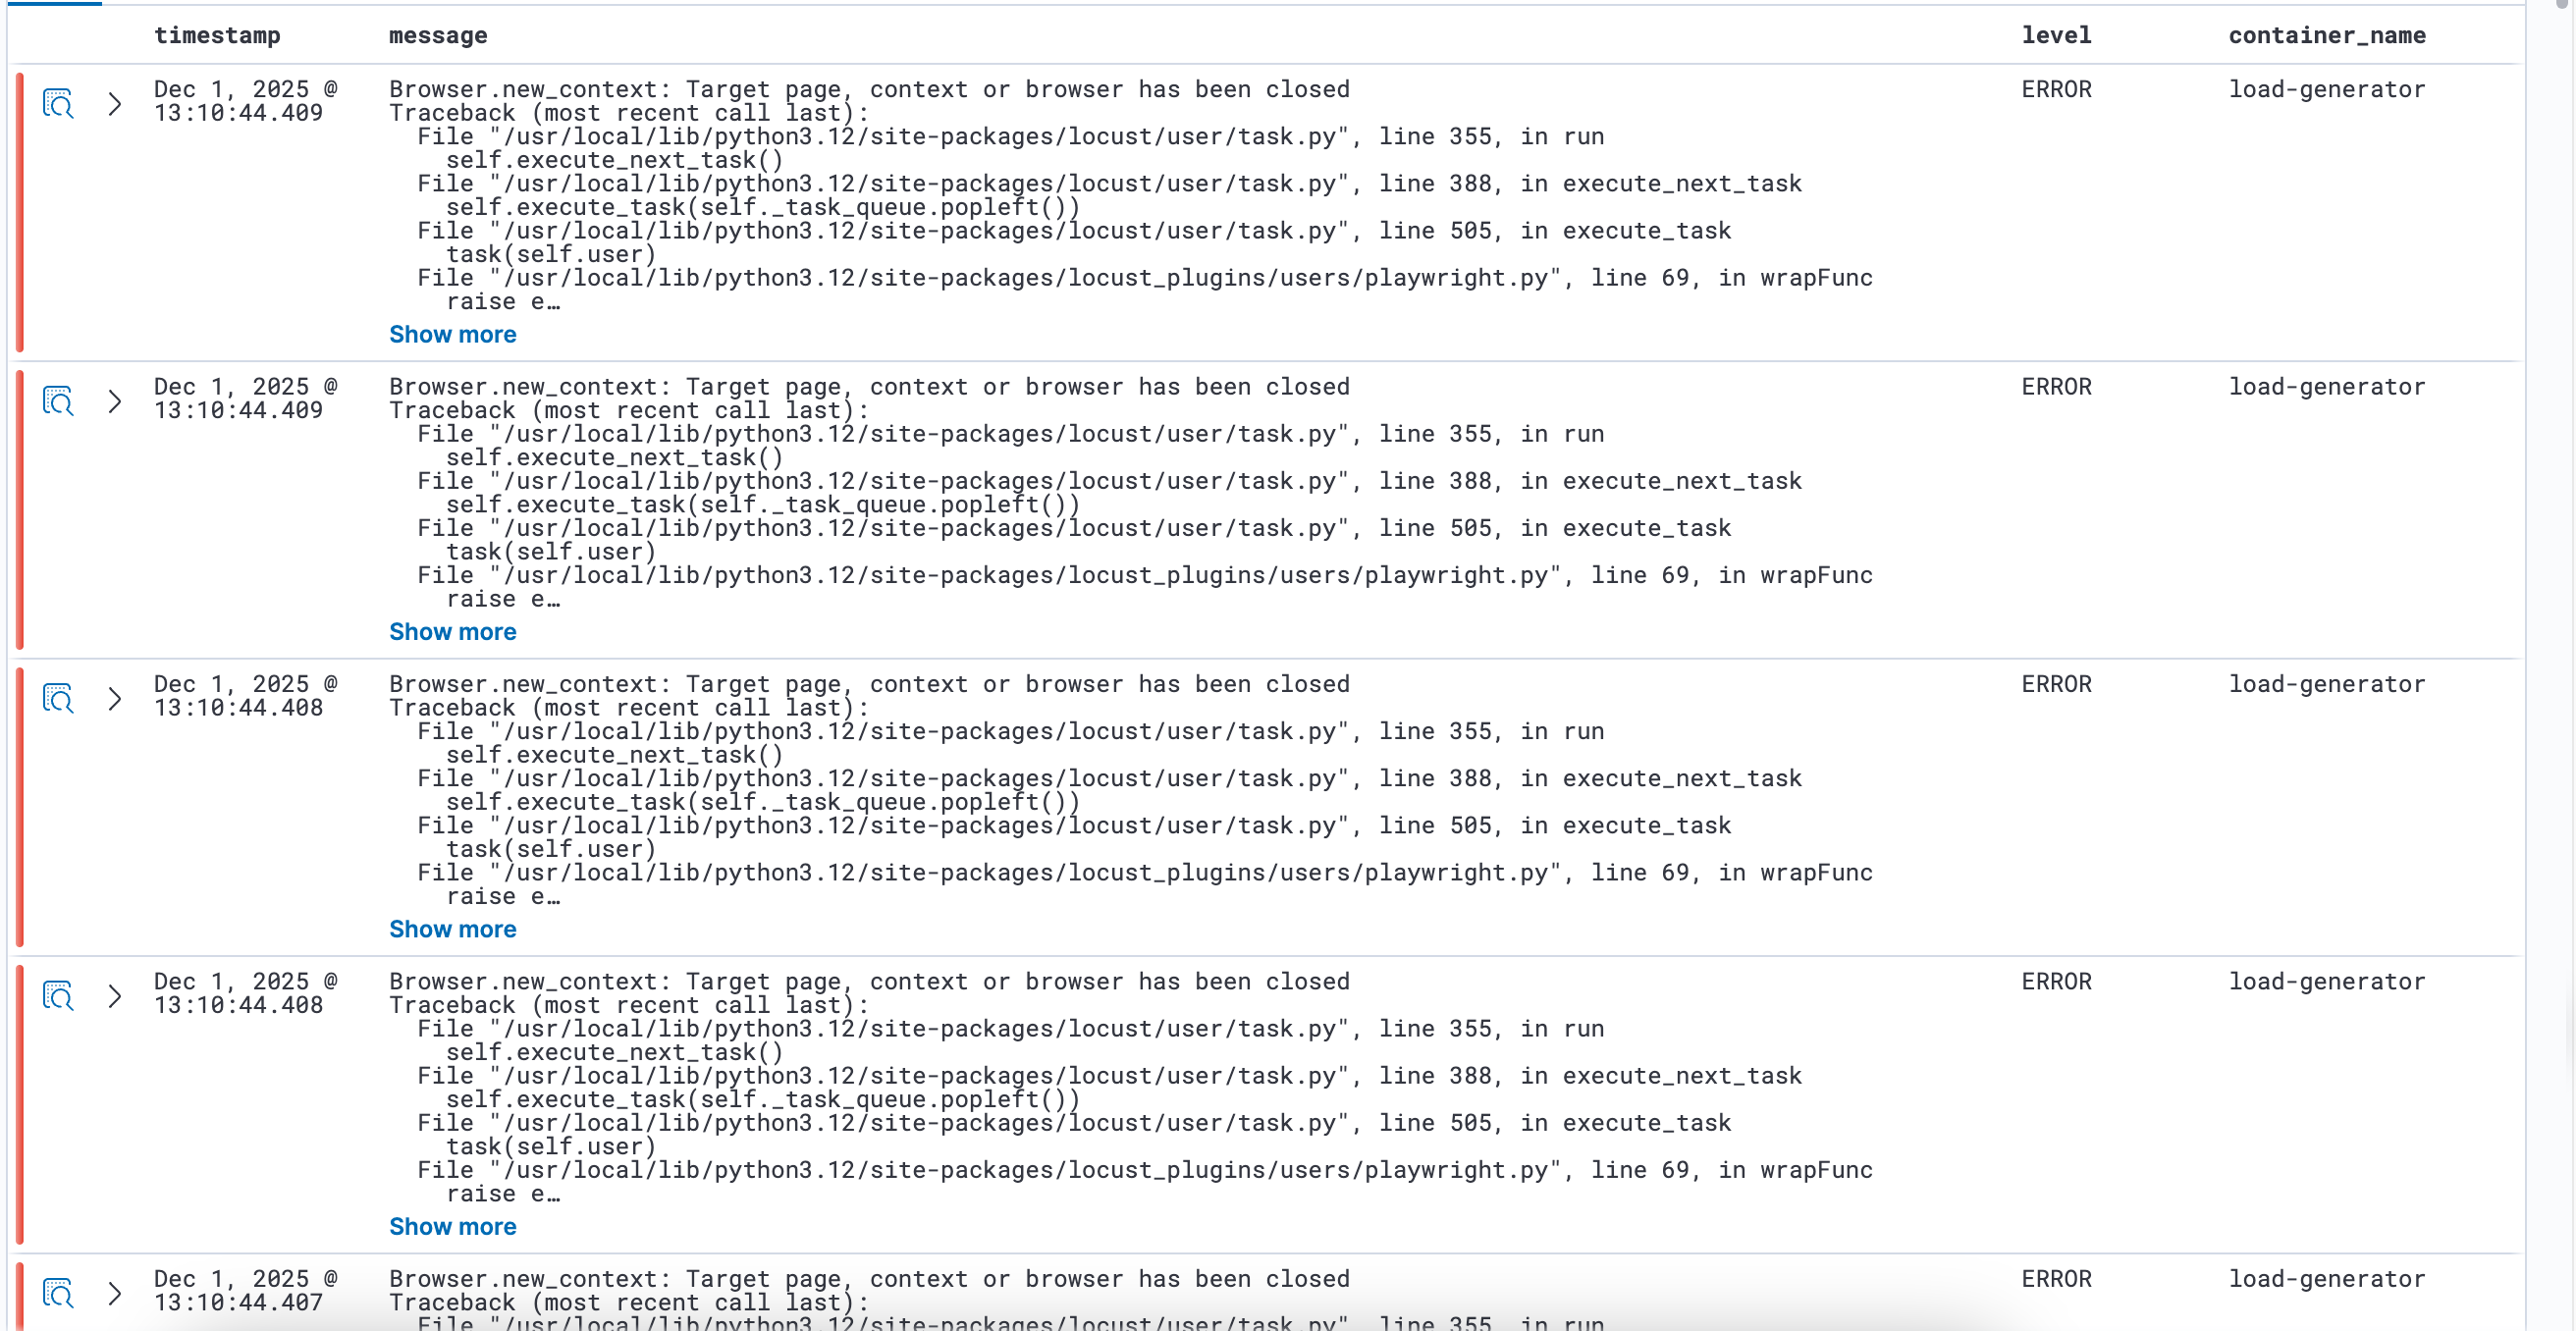
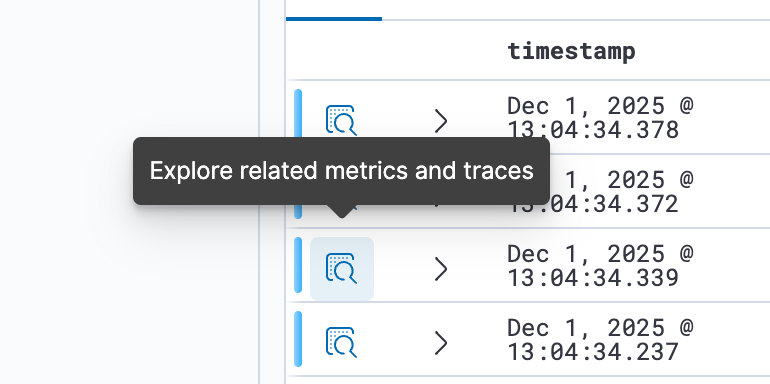
Each log line displays a color-coded severity bar (INFO, WARN, ERROR, etc.). Hover over the bar to see the severity level.
Log Patterns
The Patterns tab groups logs by fingerprint similarity. The Insights panel shows pattern frequency and distribution over time.

JSON Viewer
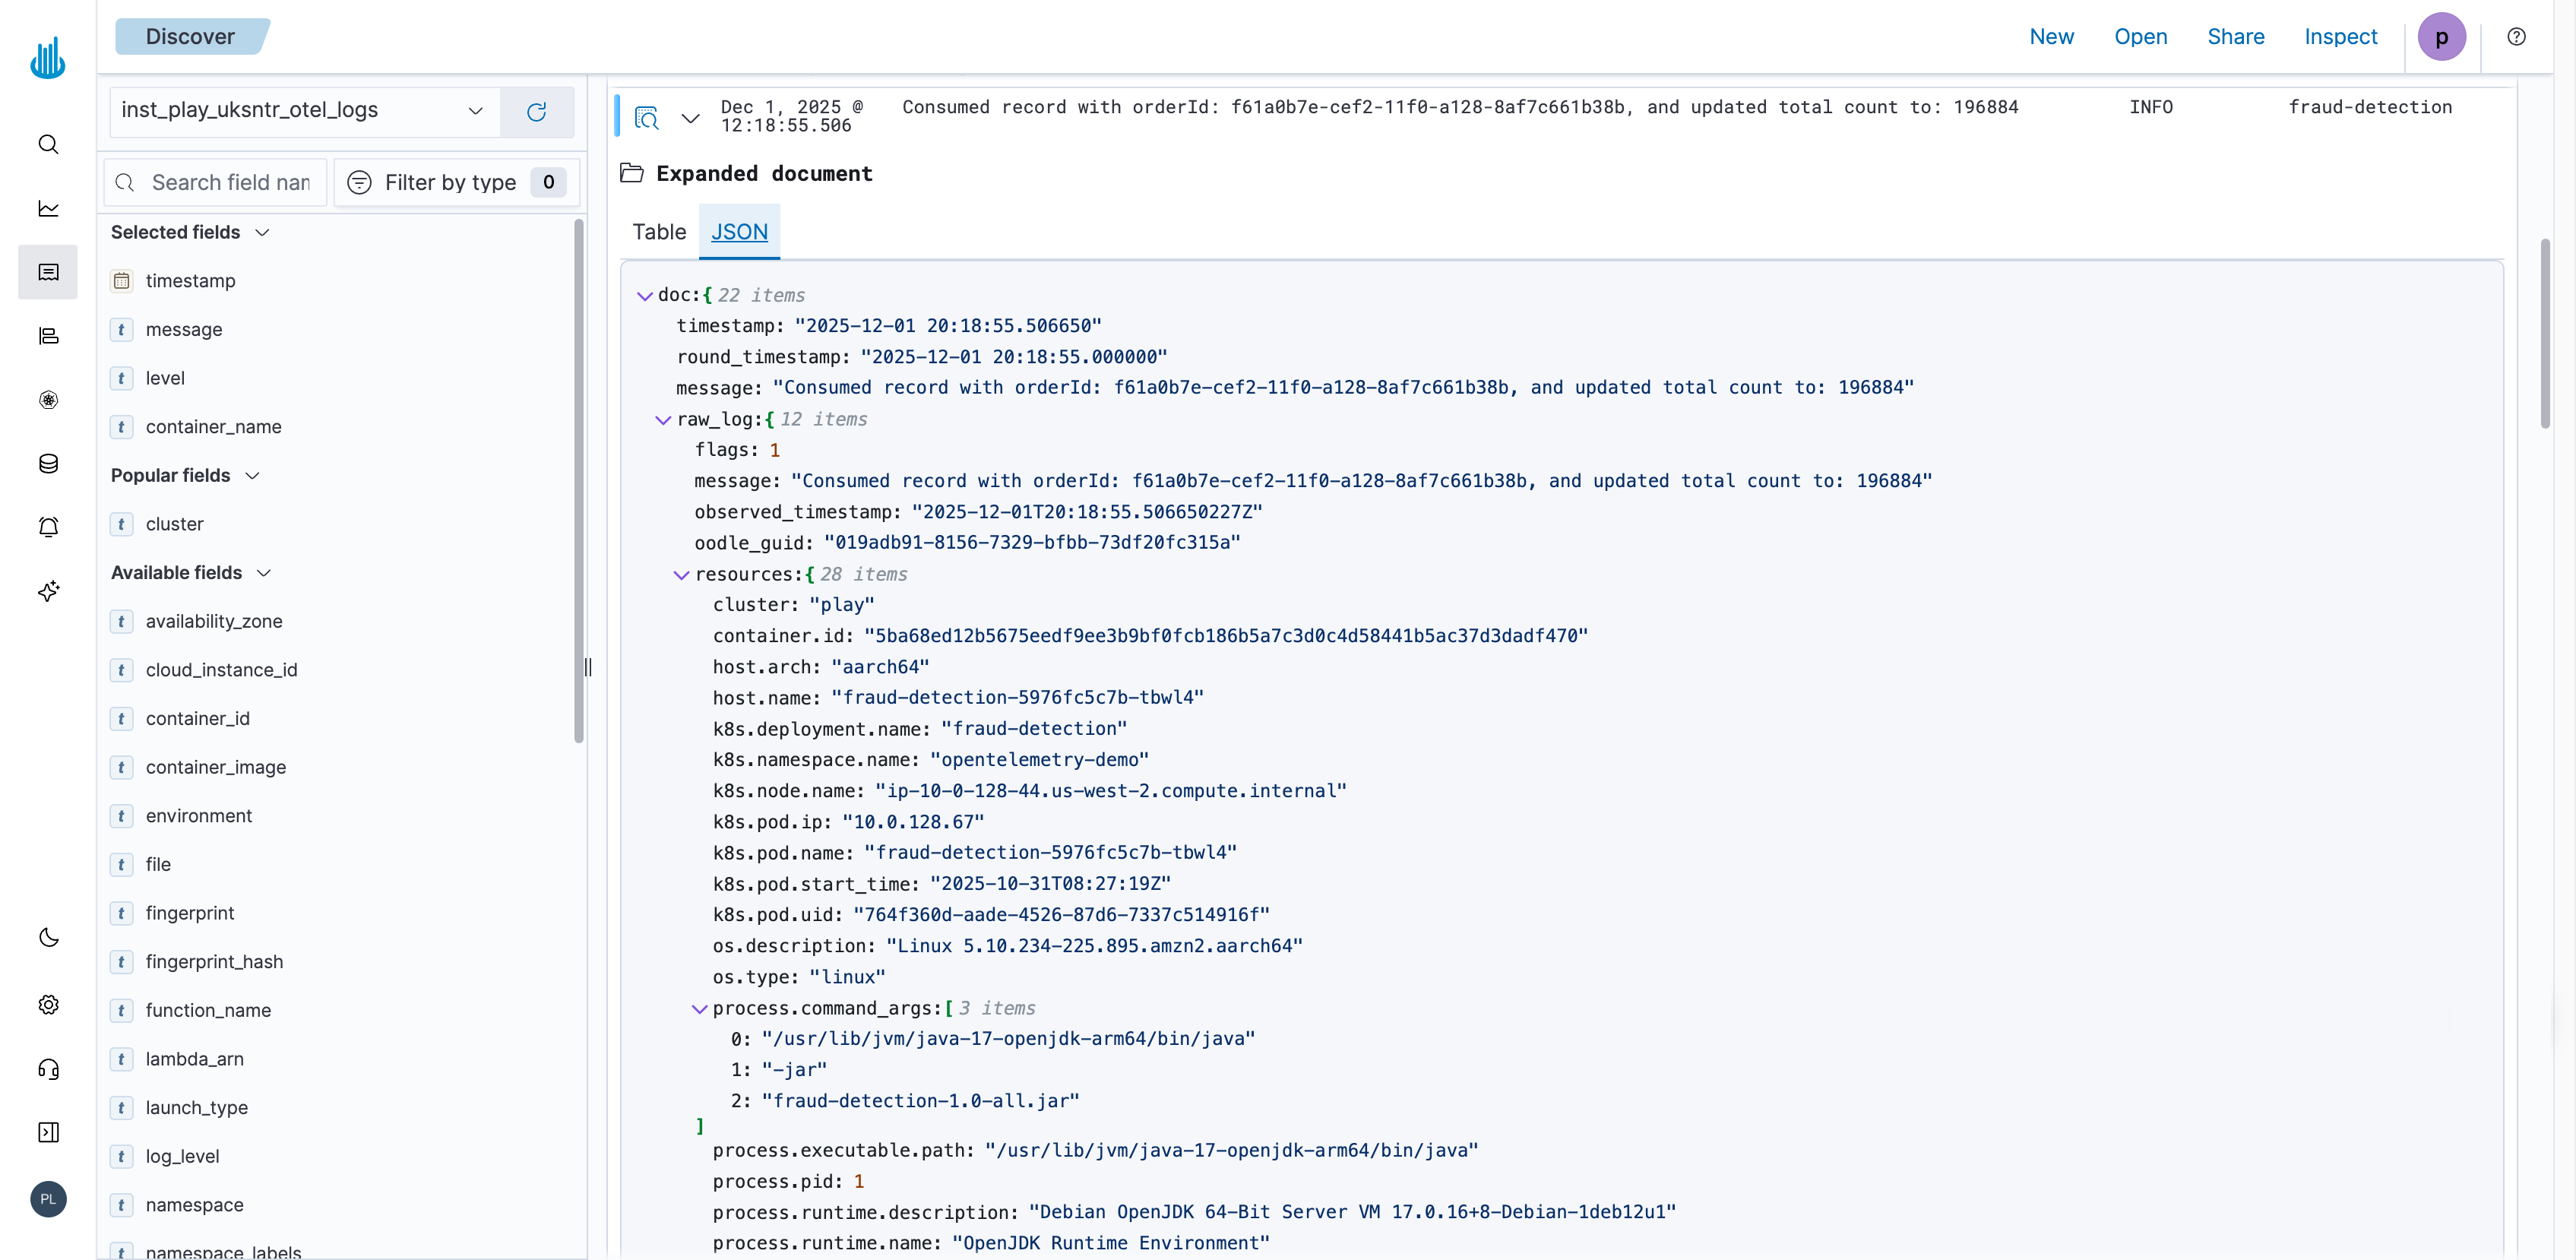
Expand any log row to view all fields in either table or JSON format. The JSON view supports:
- Expandable/collapsible nested objects
- Copy buttons for individual fields or entire subtrees
- Direct filtering from field values
AI Features
AI Assistant Experience
Select any text in a log entry to interact with the AI Assistant. The context menu provides options to:
- Ask questions about the log message or error
- Debug the issue with Cursor integration
- Get troubleshooting suggestions
This works with any selected text, including error messages, stack traces, or field values.
Log Summaries
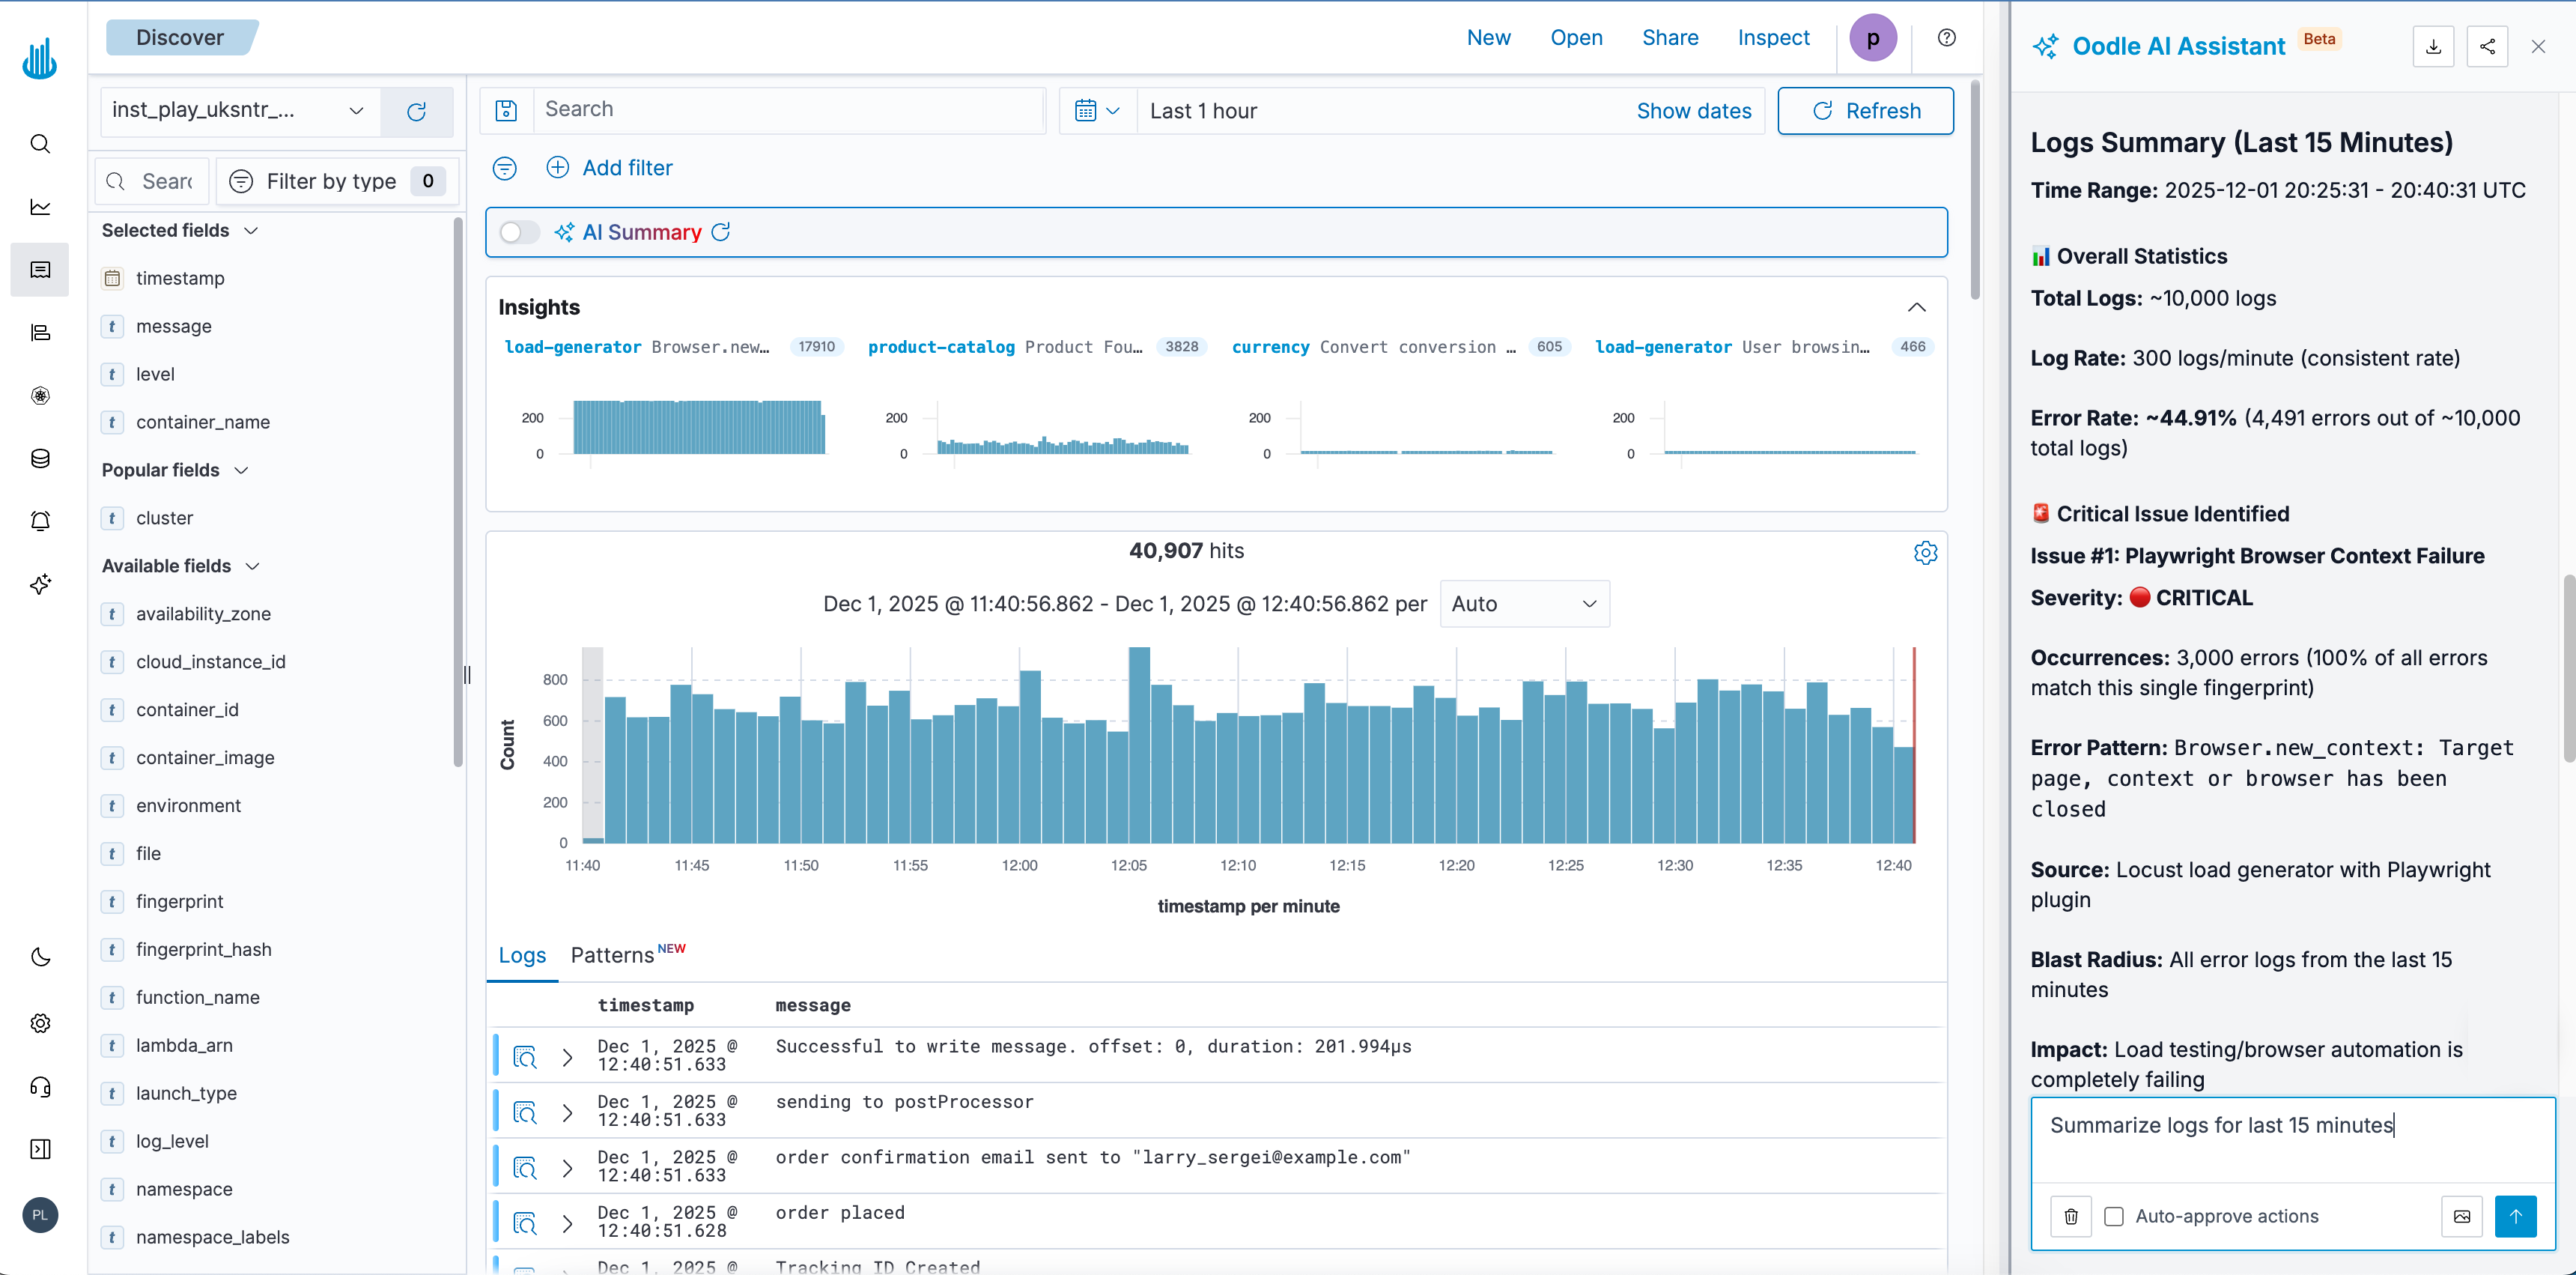
Toggle the AI Summary switch to generate an analysis of the current log view. The summary includes:
- Total log count, rate, and error percentage
- Critical issues with severity ratings
- Error pattern frequency
- Impact analysis and affected components
- Root cause identification
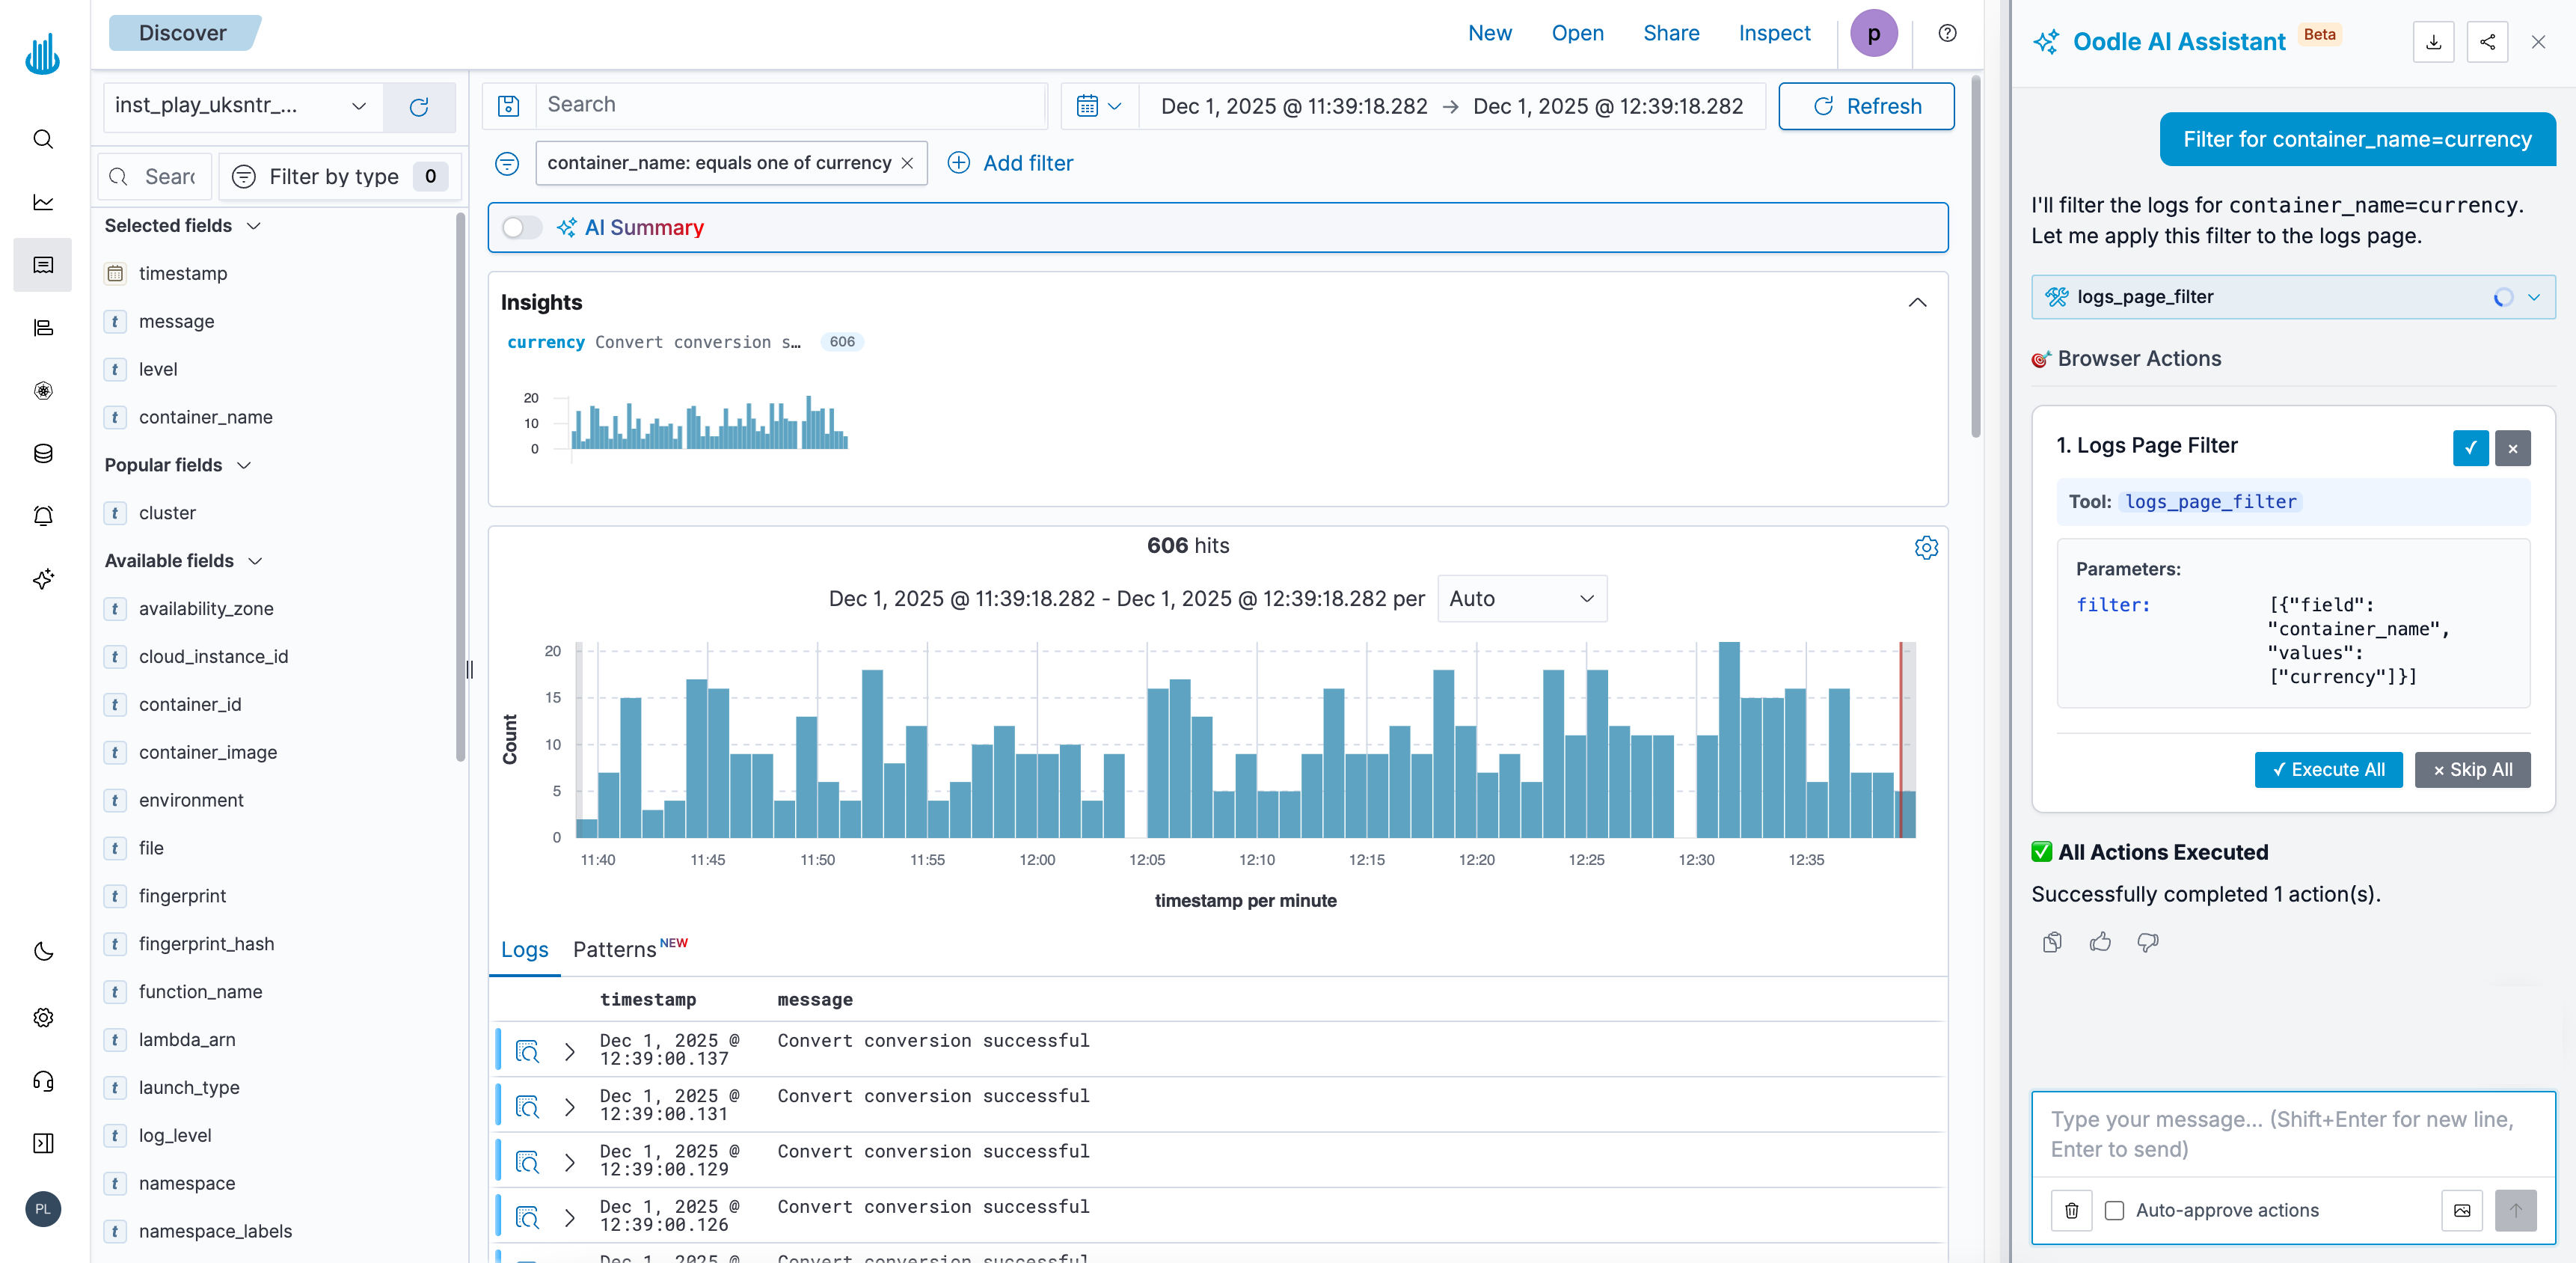
The AI can also accept natural language requests to filter and query logs. Examples:
"Show me all errors from the payment service in the last hour"
"Filter logs where container_name is currency"
"Find logs with status code 500"
Log Anomaly Detection
The system continuously monitors your logs and automatically detects anomalies such as new error patterns, spikes in existing errors, and high-volume recurring issues. Detected anomalies appear on the Anomalies page where you can review them, set up alerts, or block repetitive patterns to reduce noise.
Cross-Signal Navigation
Exploring Related Data
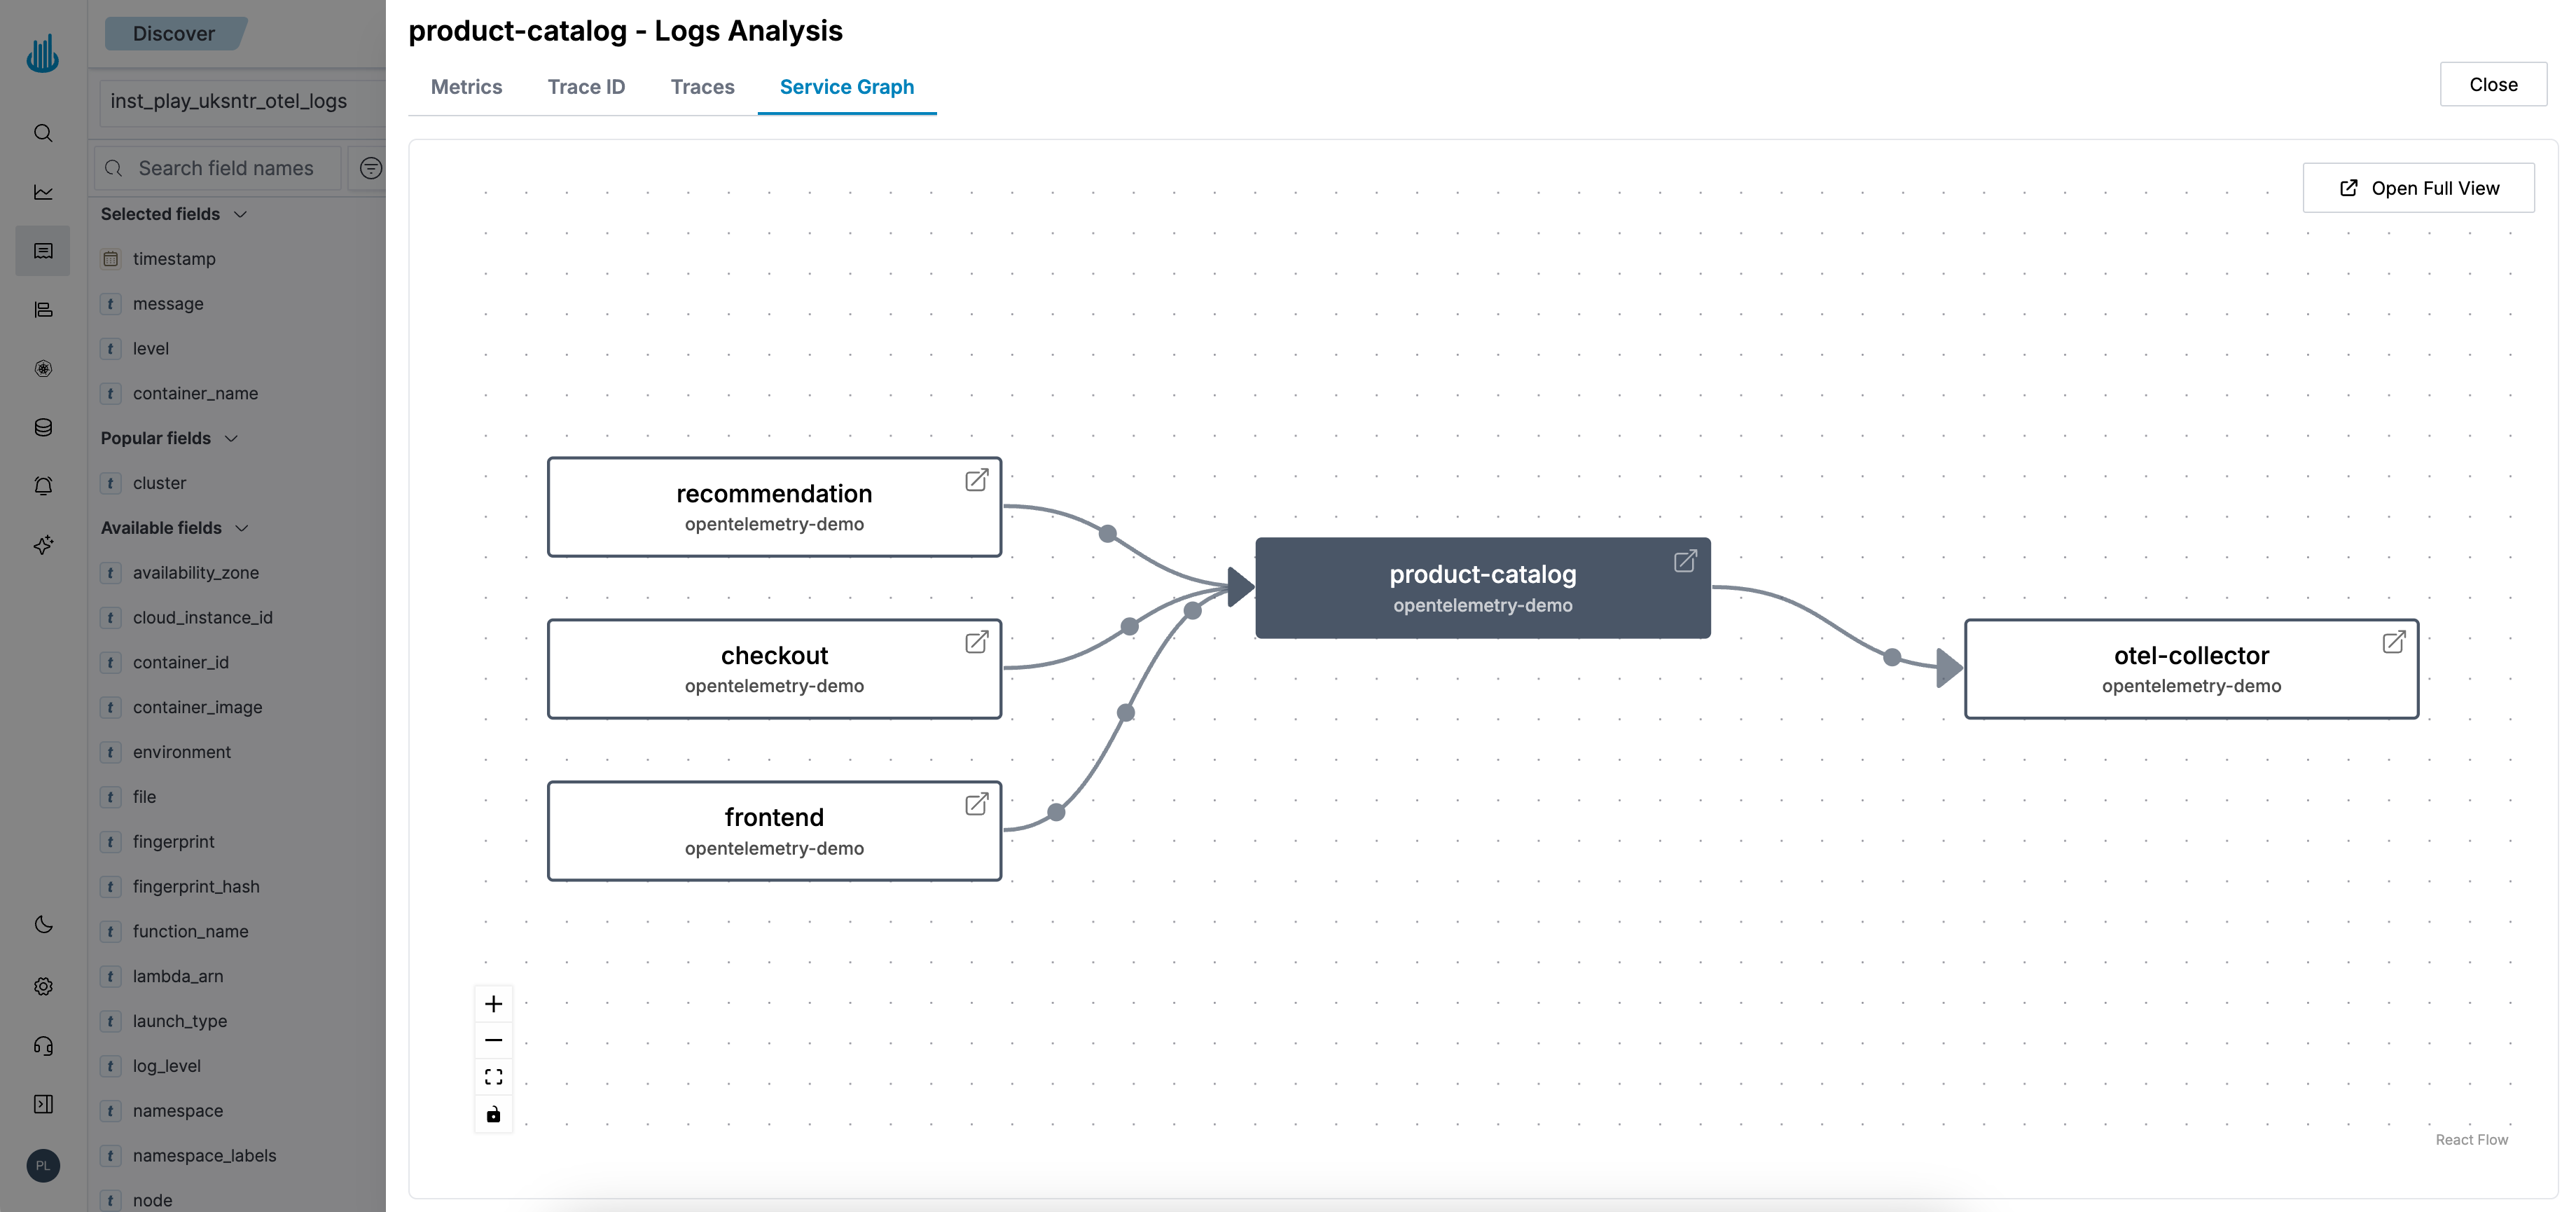
Click "Explore related metrics and traces" on any log line to open an analysis panel with four tabs:
Service Graph: Displays the service and its dependencies.
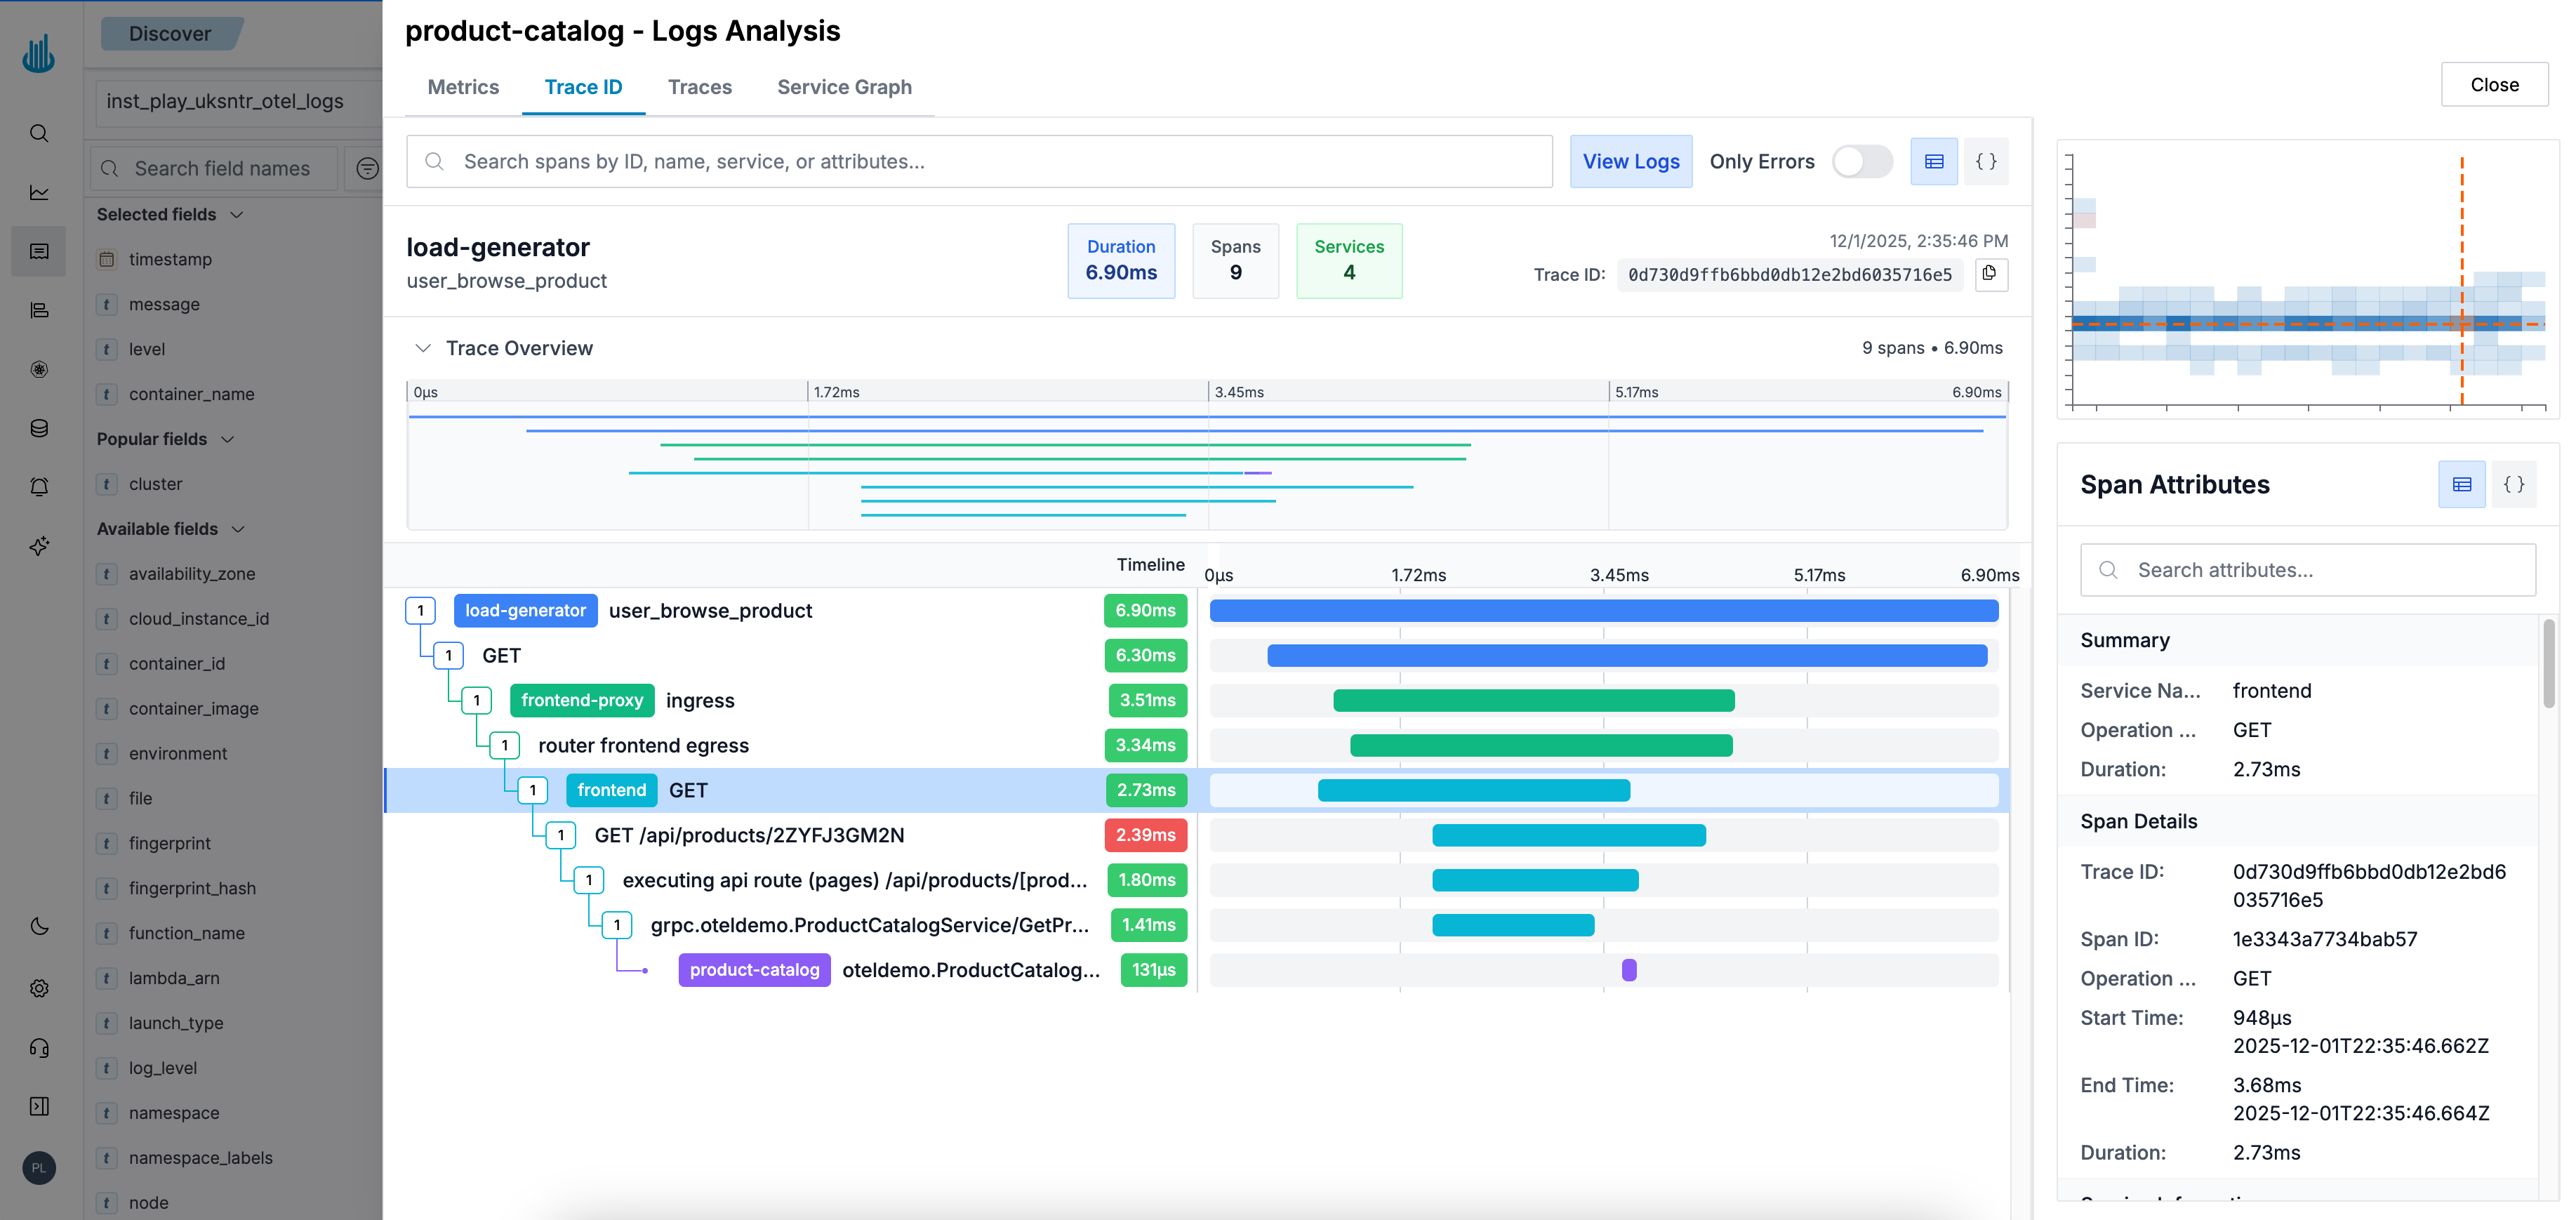
Trace ID: Shows the distributed trace associated with the log entry, including all spans and timing information.
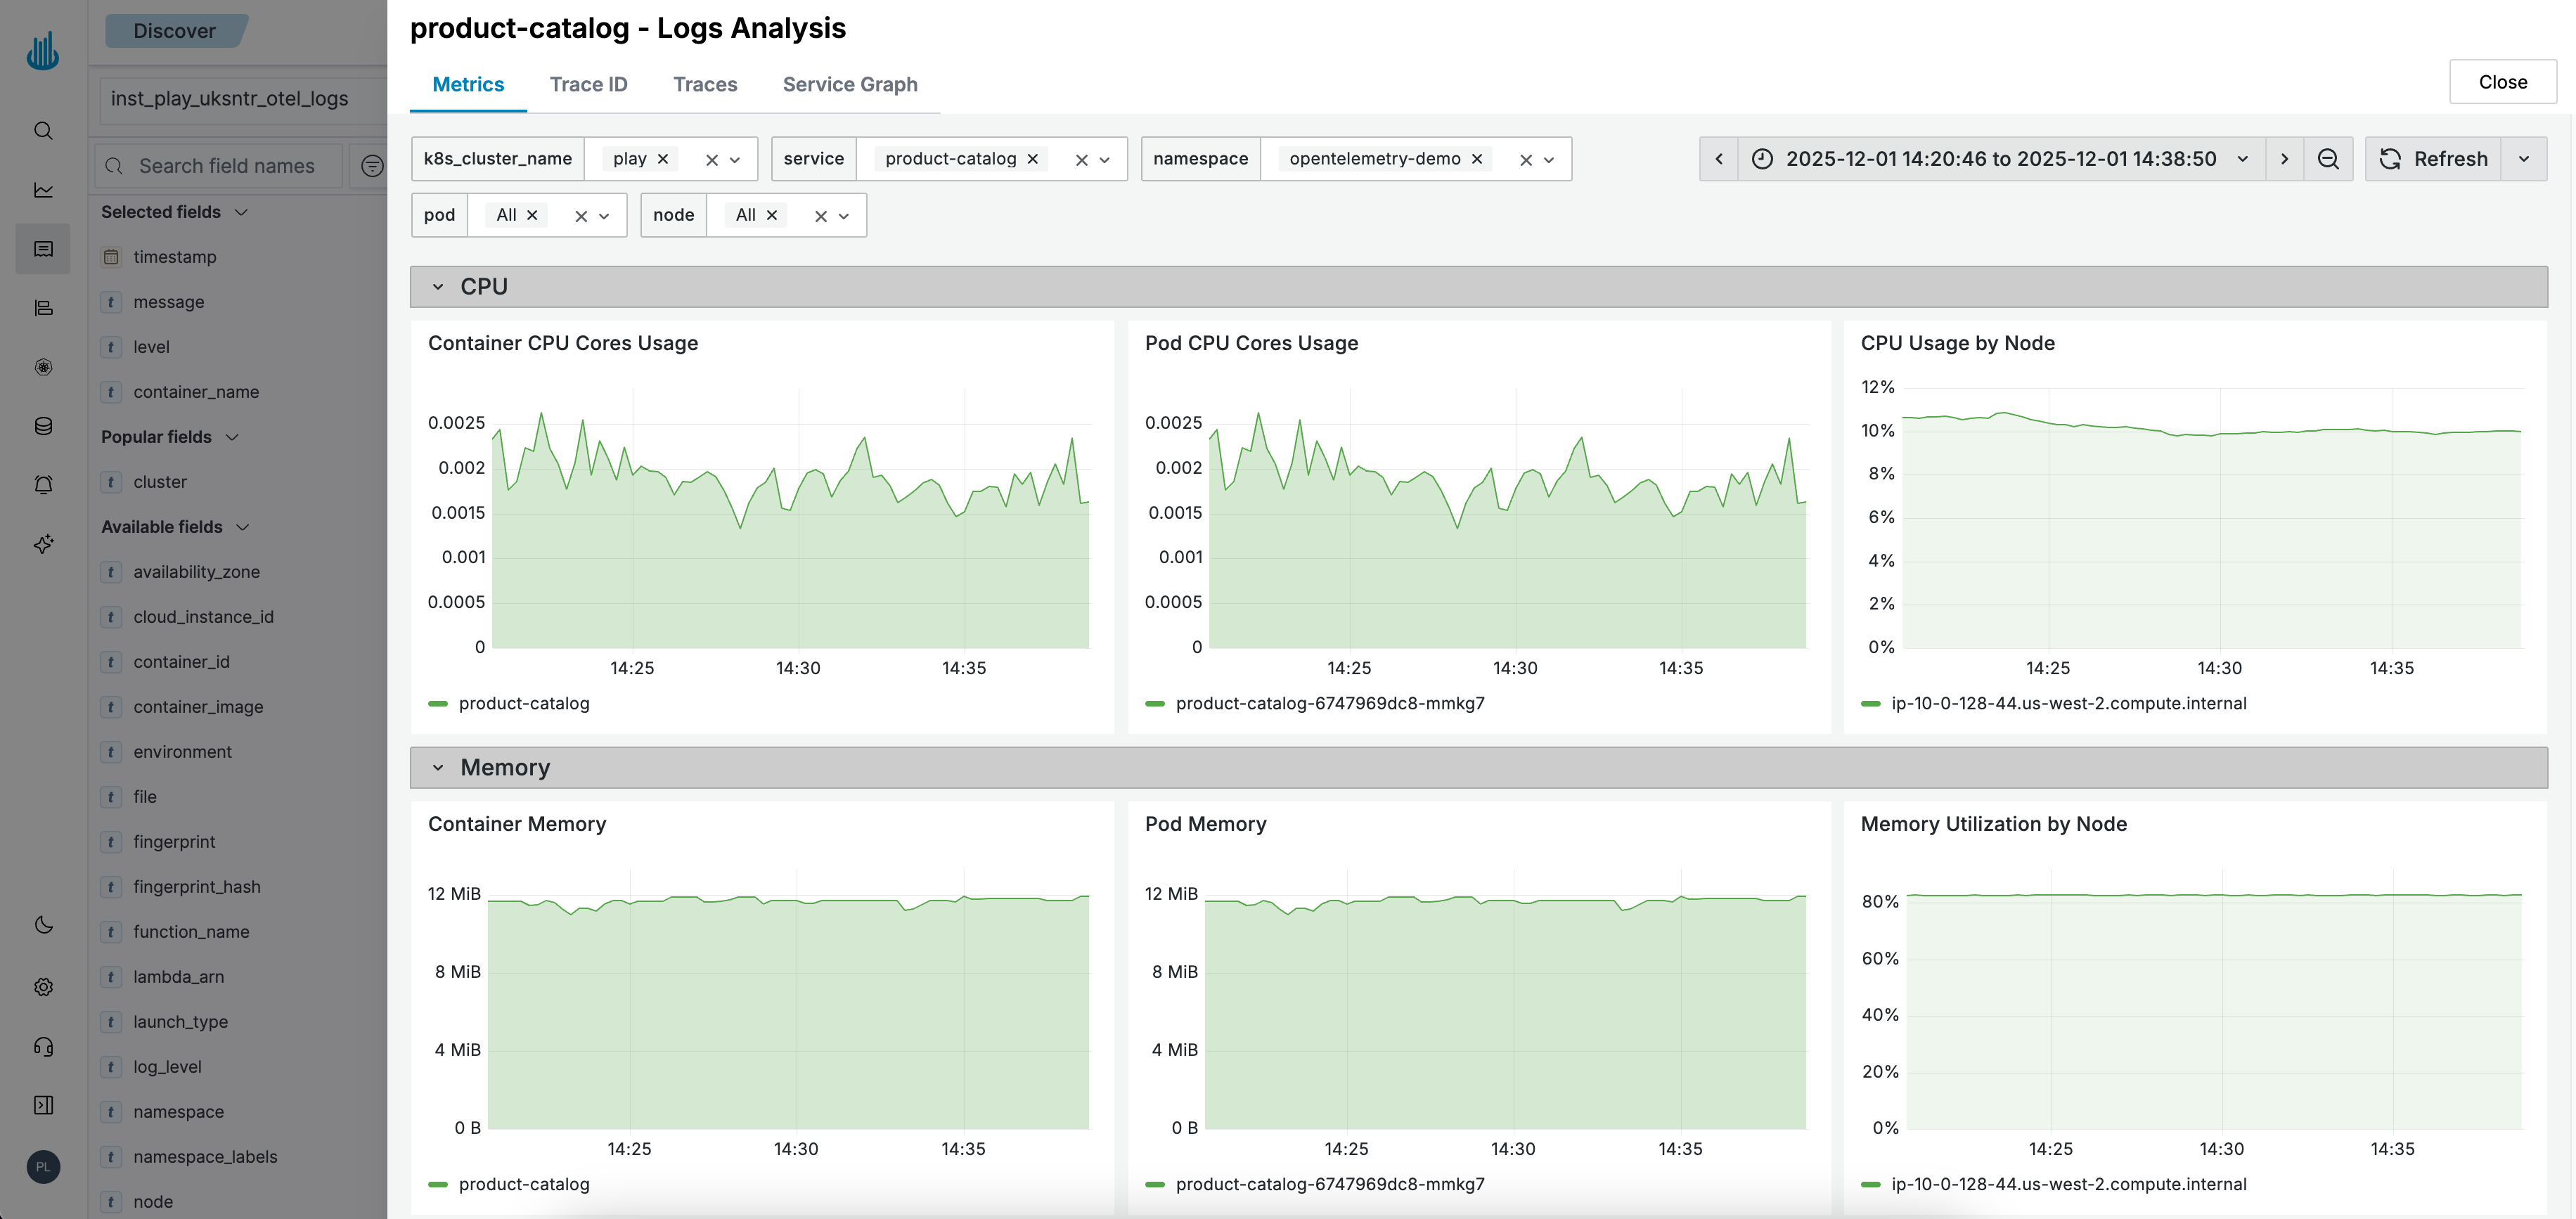
Metrics: Displays CPU and memory usage for the service at the log timestamp.
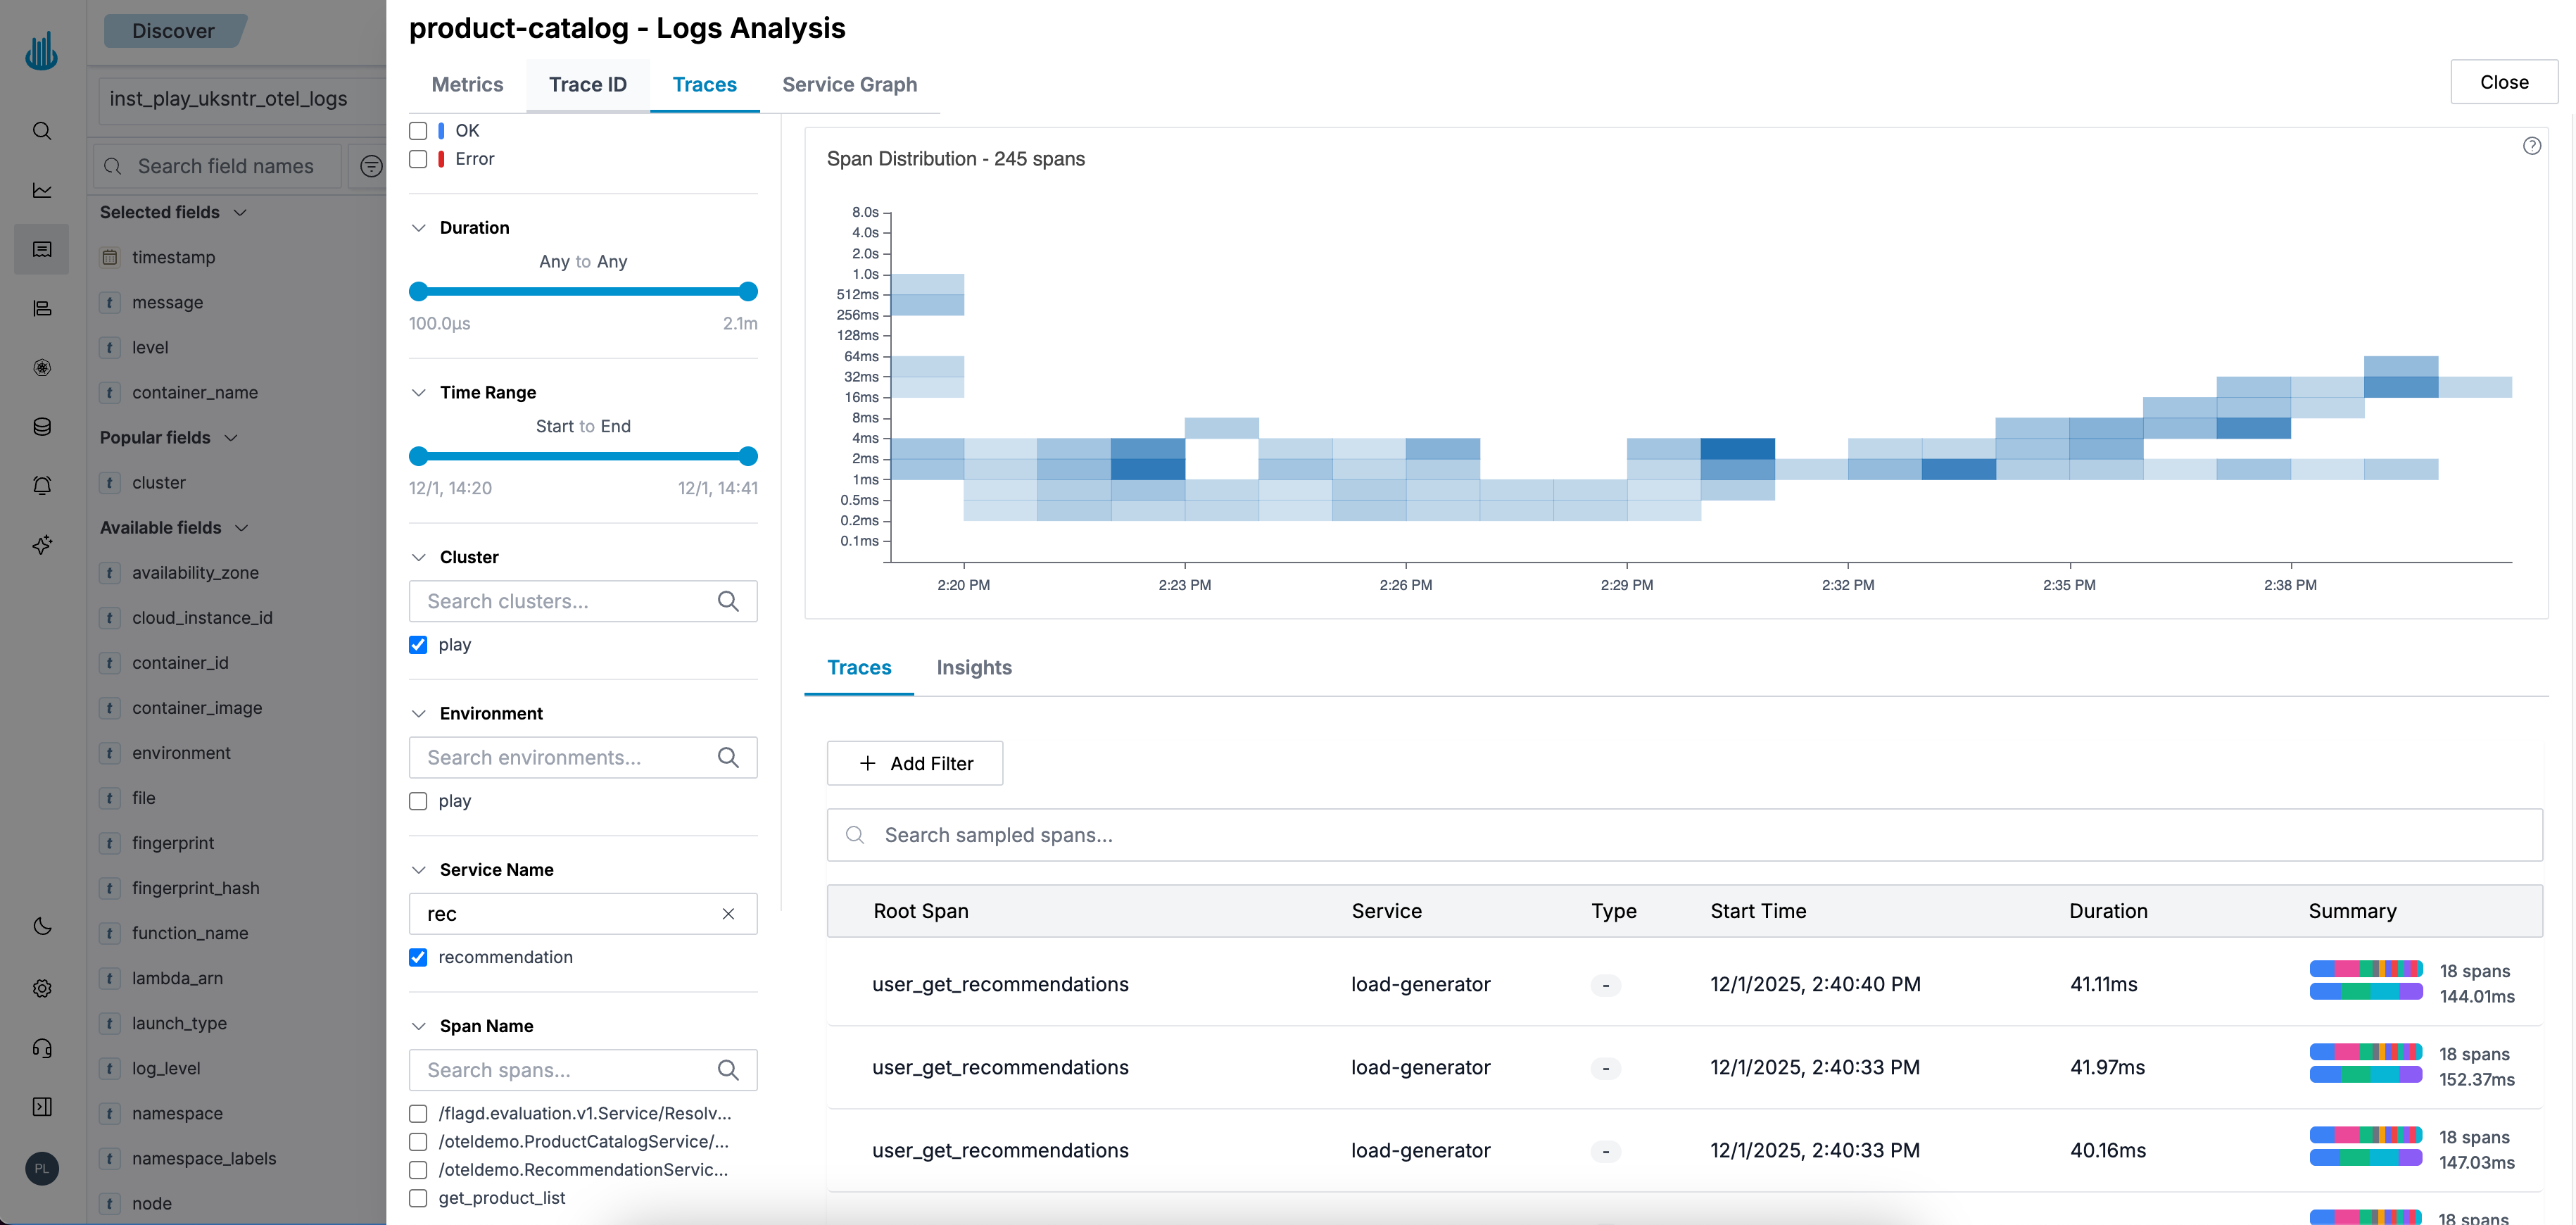
Traces: Lists all traces for the service in the selected time range, filterable by error status or duration.
The analysis panel automatically filters data to match the service and timeframe of the selected log.
Storage and Performance
The storage engine uses columnar format optimized for log data:
- Queries do not timeout regardless of data volume or time range
- Automatic field indexing without manual schema configuration
- Efficient compression maintains query speed at scale
- High ingestion throughput with consistent query performance
Dashboards and Visualizations
Build dashboards and charts to analyze your log data:
- Dashboards - Create dashboards to monitor your logs with multiple panels
- Visualizations - Build line charts, bar charts, pie charts, and more from your logs
Best Practices
- Start with a free text search of the words you remember from the log line. Then add filters to narrow the result.
- Build filters with a click. Expand a log line and use the filter buttons next to a field value, or click a field in the list on the left. This gives you the correct field name and value.
- Use
.keyword, or theequalsoperator, when you know the full value. An exact match is faster than a text match. - Keep Partial Word Match off unless you need it. Full word matching uses a word index, which keeps large queries fast.
- Save a query that you use often. Click the disk icon at the left of the search bar, then give the query a name.
Support
If you need assistance or have any questions, please reach out to us through:
- Email at [email protected]