Anomaly Detection
Oodle automatically identifies unusual patterns in your metrics and logs, helping you catch issues before they impact your users.
Overview
Anomaly detection helps you:
- Detect Issues Early: Automatically identify unusual patterns before they become critical problems
- Reduce Alert Noise: Focus on genuine anomalies by blocking repetitive or irrelevant patterns
- Compare Historical Patterns: Understand how current behavior differs from your historical baselines
- Prioritize Issues: Anomalies are ranked by severity to help you focus on what matters most
How It Works
Oodle continuously monitors your infrastructure and applications, automatically detecting:
- Metric Anomalies: Unusual behavior in your infrastructure and application metrics
- Log Anomalies: New or unusual patterns in your error logs
When anomalies are detected:
- They appear on the Anomalies page for you to review
- You can set up alerts to be notified immediately
- You can block repetitive or expected patterns to reduce noise
Types of Anomalies
Metric Anomalies
Oodle detects unusual patterns in your infrastructure and application metrics, including:
- CPU Throttle: Services experiencing CPU throttling
- High Node CPU: Nodes with unusually high CPU usage
- Service Communication Errors: Communication issues between services
- API Errors: High error rates in your APIs
- Container Restarts: Containers restarting unexpectedly
- High Memory: Services with excessive memory usage
- Pod Phase Issues: Pods in problematic states (e.g., CrashLoopBackOff)
Log Anomalies
Oodle identifies unusual patterns in your logs by detecting:
- New Patterns: Error messages that haven't appeared before
- Spikes: Sudden increases in existing error patterns
- High Volume: Recurring errors with unusually high occurrence rates
Each anomaly shows whether it's a new issue or a recurring problem, helping you prioritize your response.
Using the Anomalies Page
The Anomalies page (/anomalies) provides three main tabs:
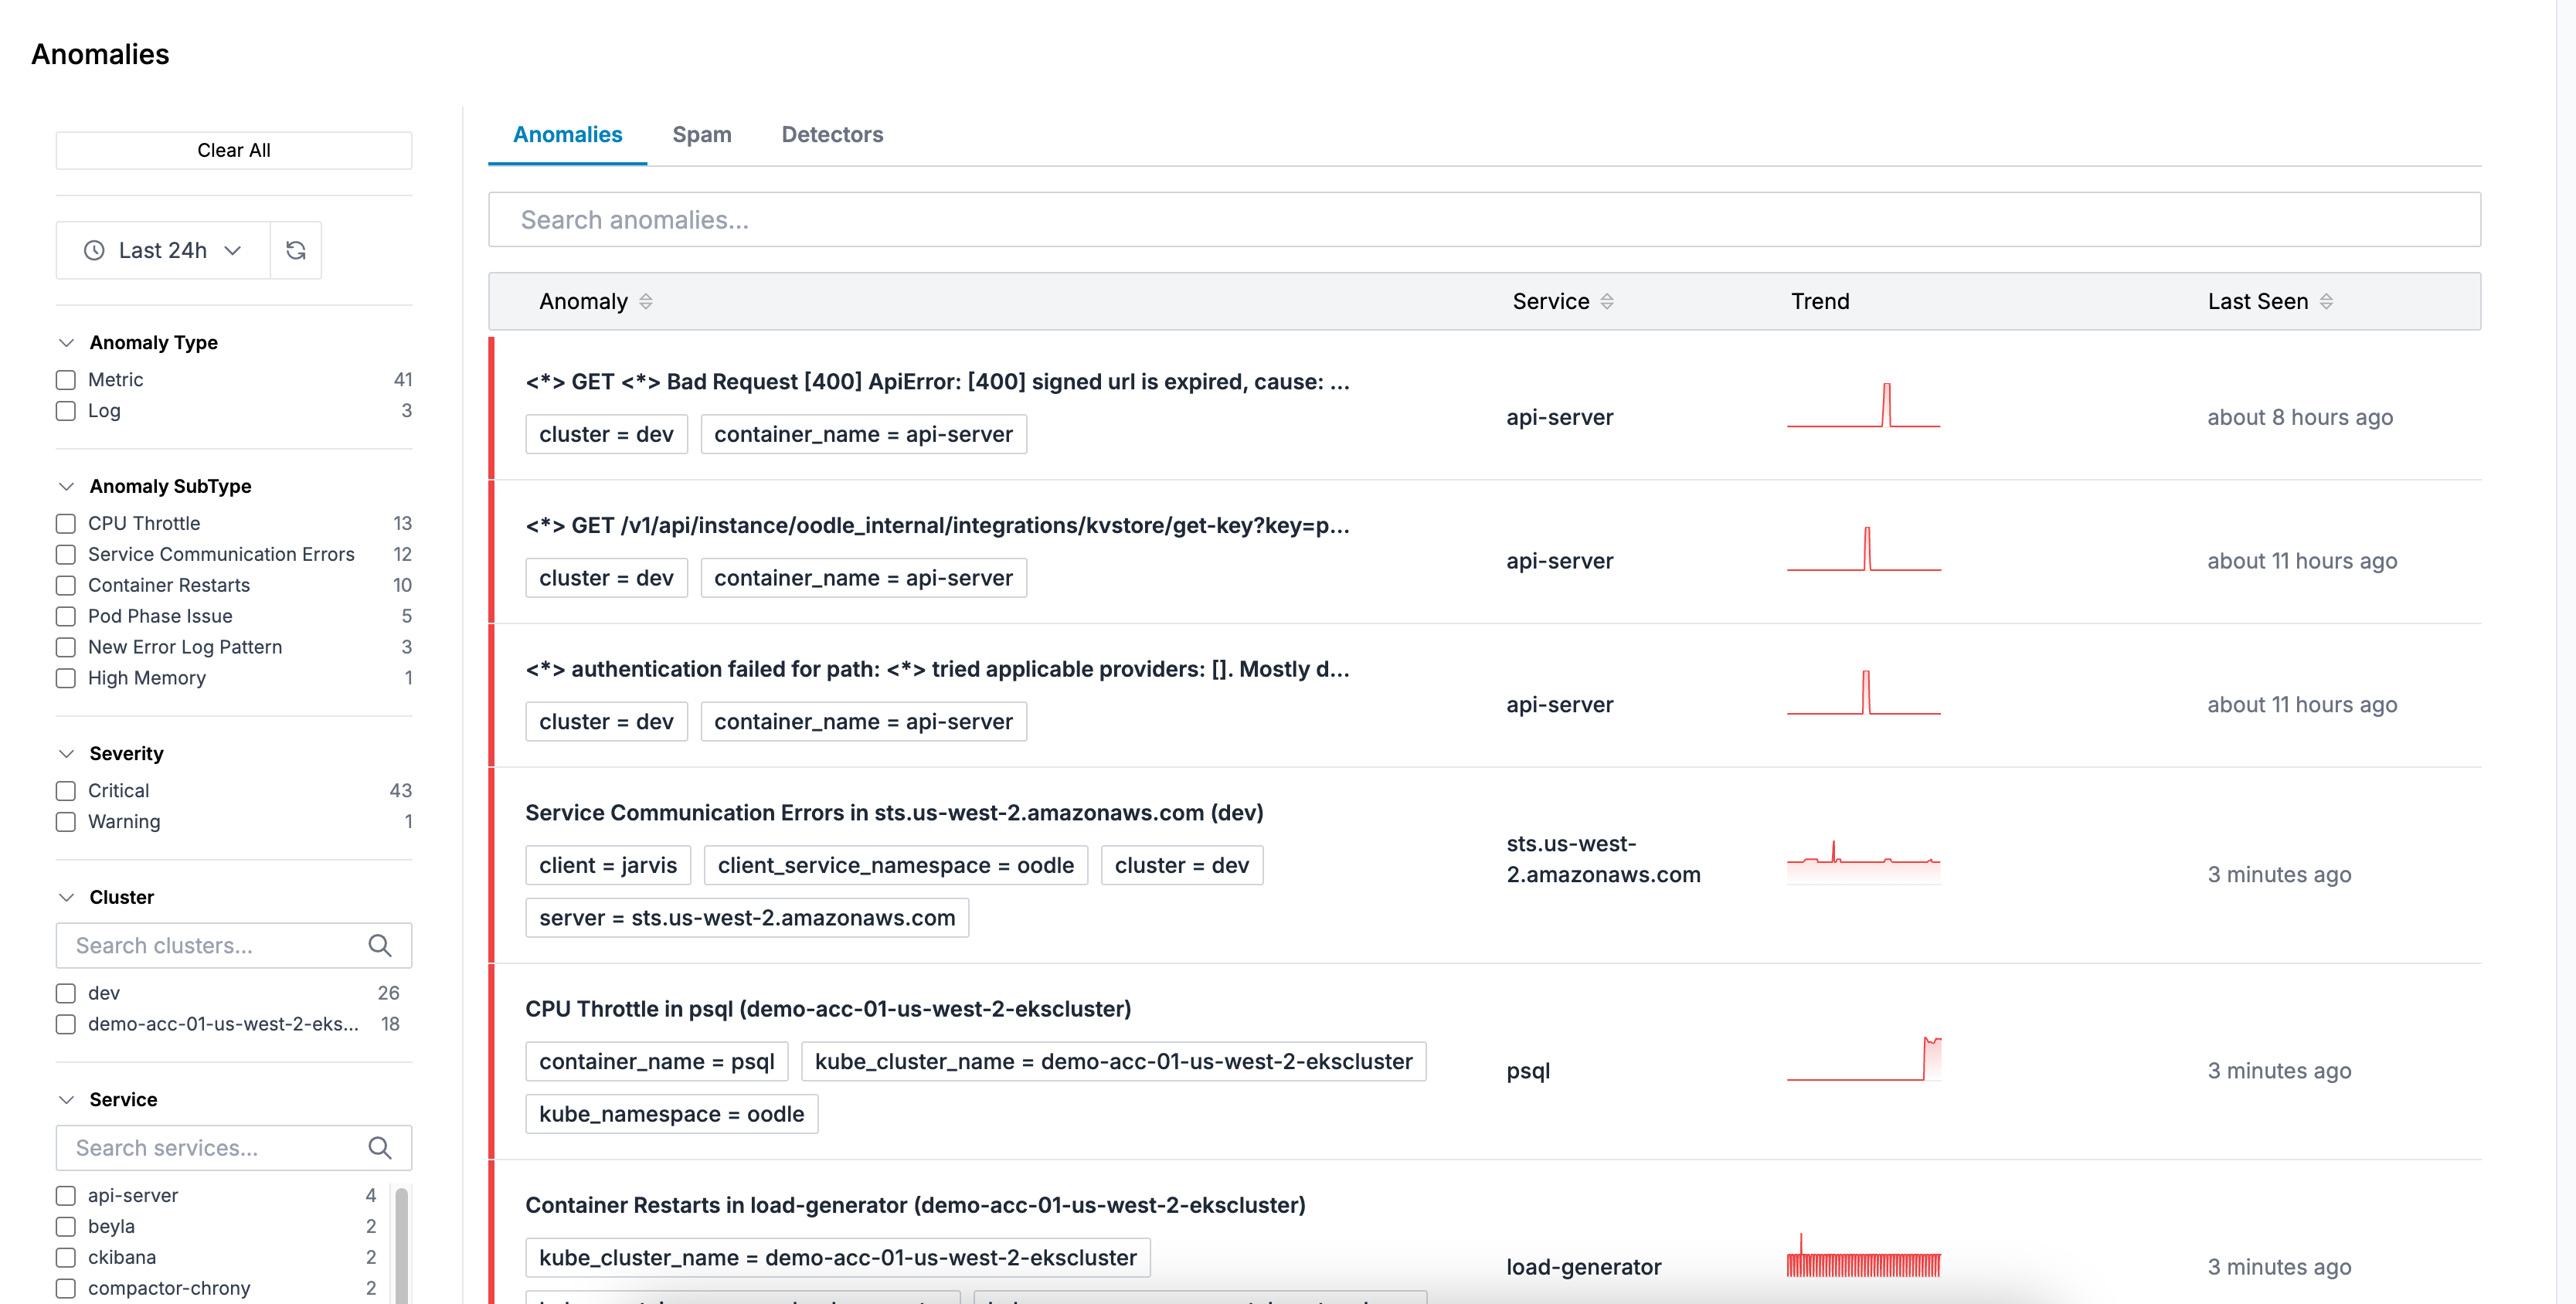
Anomalies Tab
View all detected anomalies with comprehensive filtering and details:
- Filters: Filter by type (metrics/logs), subtype, cluster, namespace, or service
- Time Range: Select the time window to view anomalies
- Details: Click on any anomaly to see:
- Trend charts showing the anomaly over time
- Related logs (for log anomalies)
- Metric queries (for metric anomalies)
- Labels and metadata
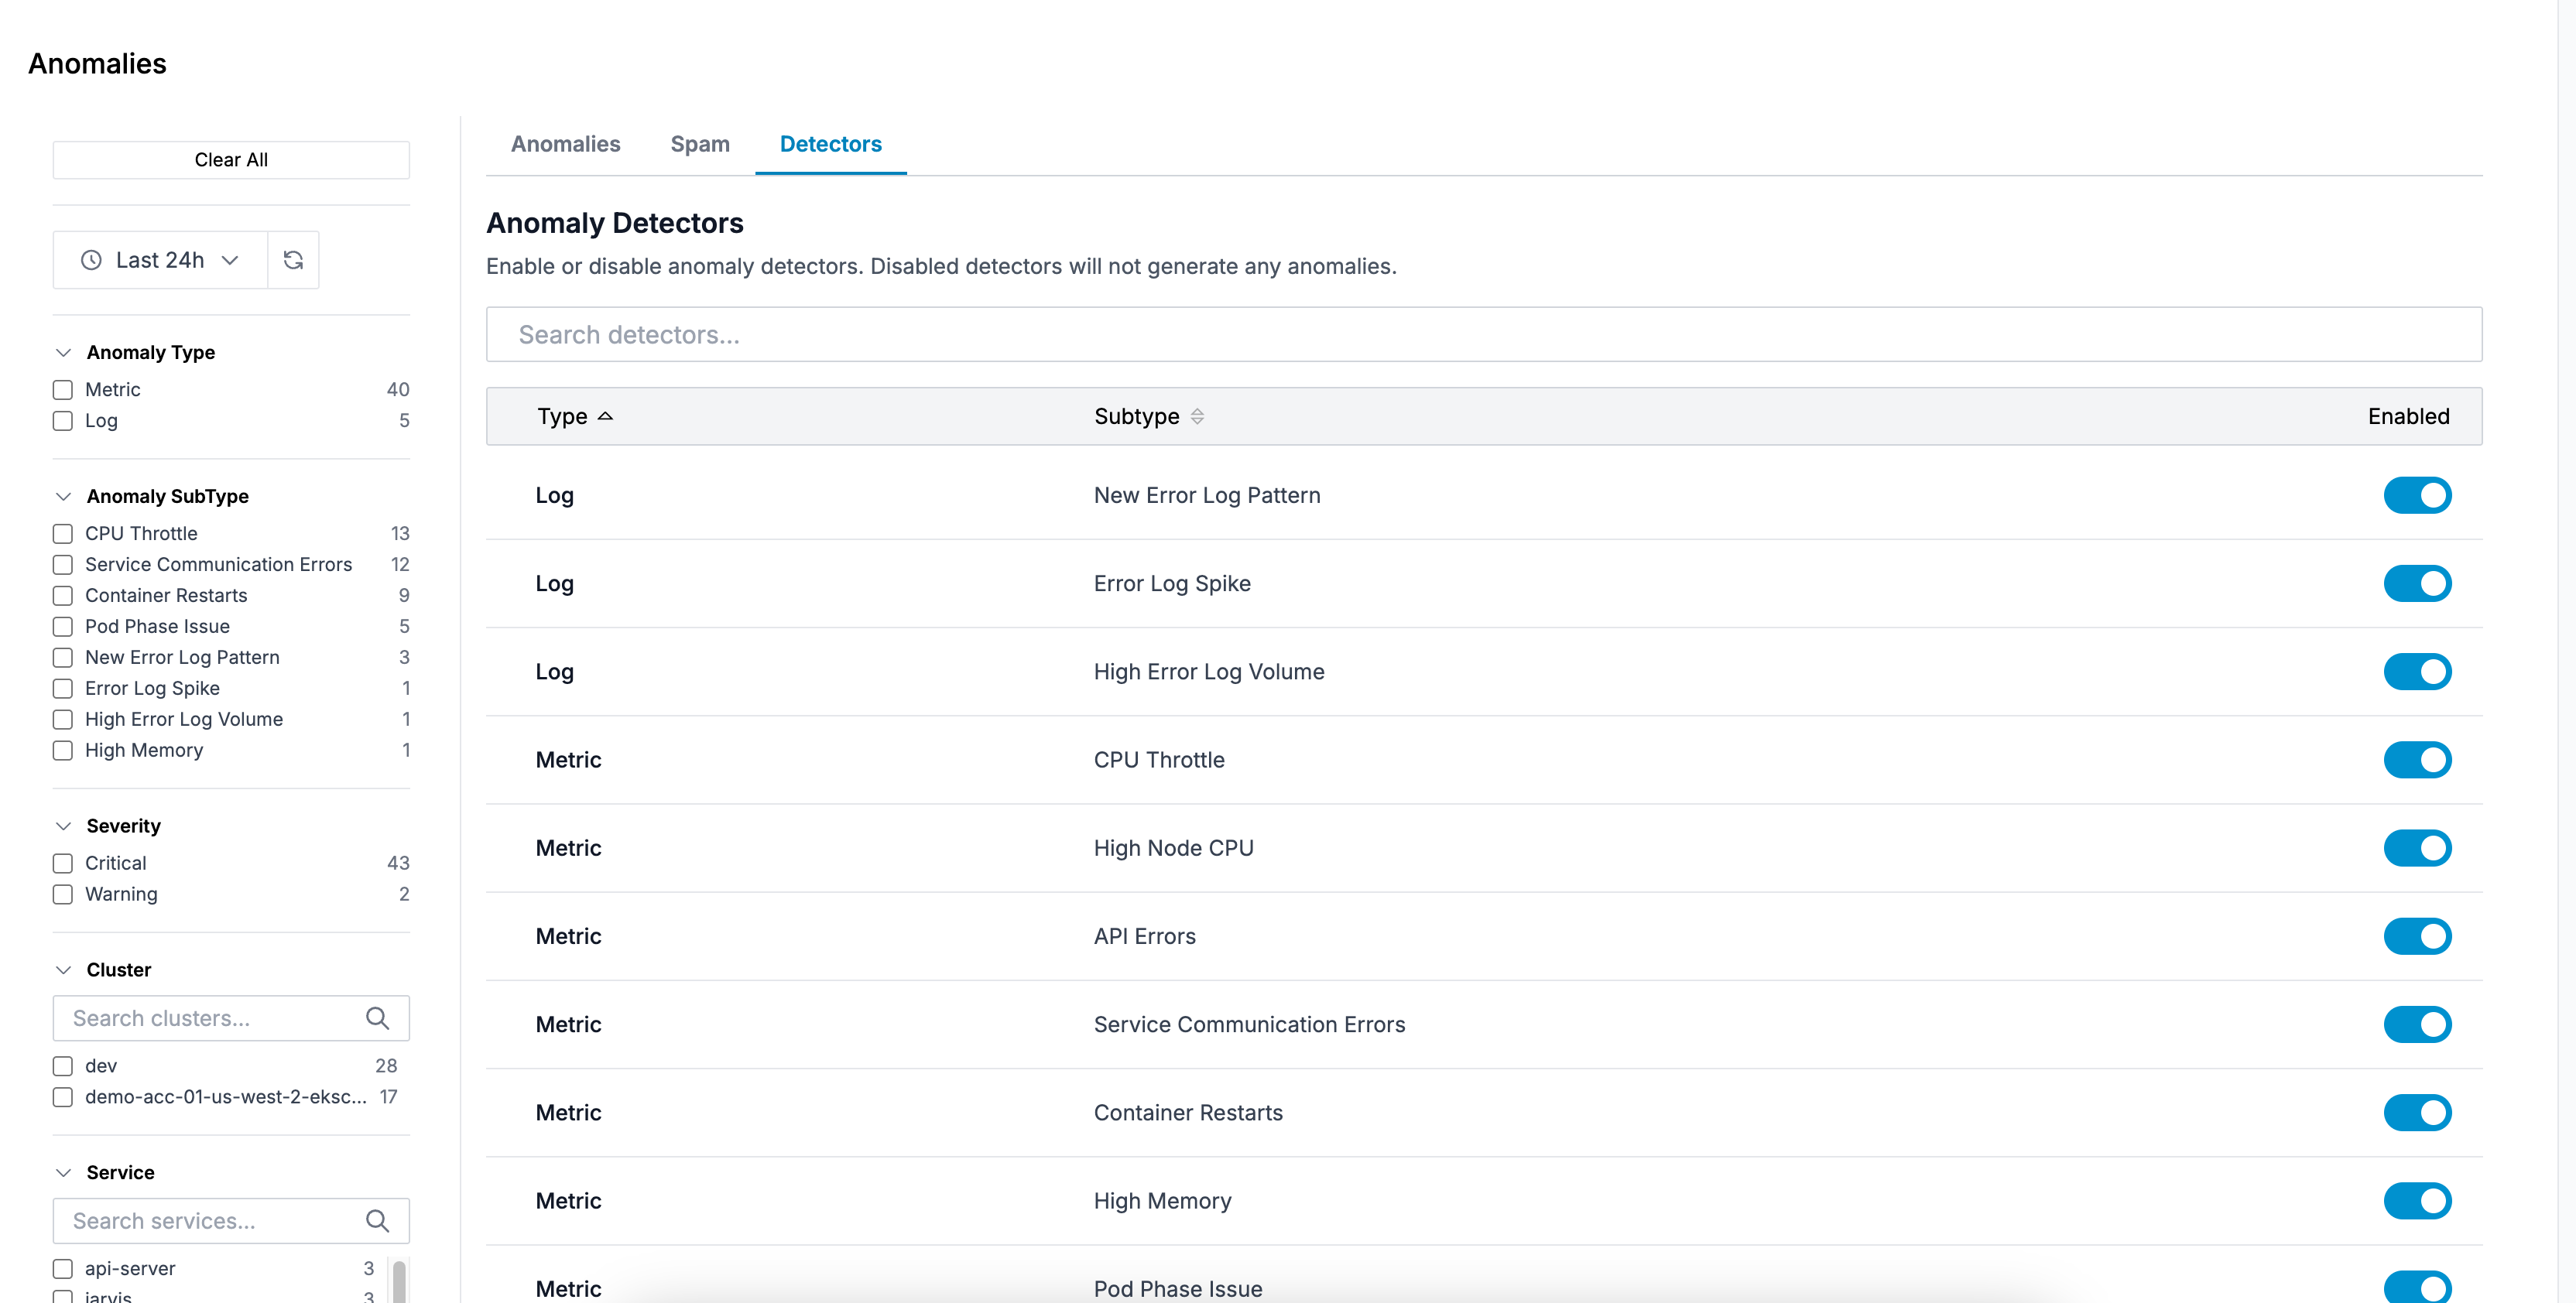
Detectors Tab
Control which types of anomalies to detect:
- Toggle individual detector types on/off
- Changes save automatically
- Useful for temporarily disabling noisy or irrelevant detectors
Spam Tab
Manage blocked anomalies to reduce noise:
- Search: Search through blocked anomalies to find specific items
- View Blocked Items: See all anomalies you've blocked
- Unblock: Remove items from the blocklist to allow them to appear again
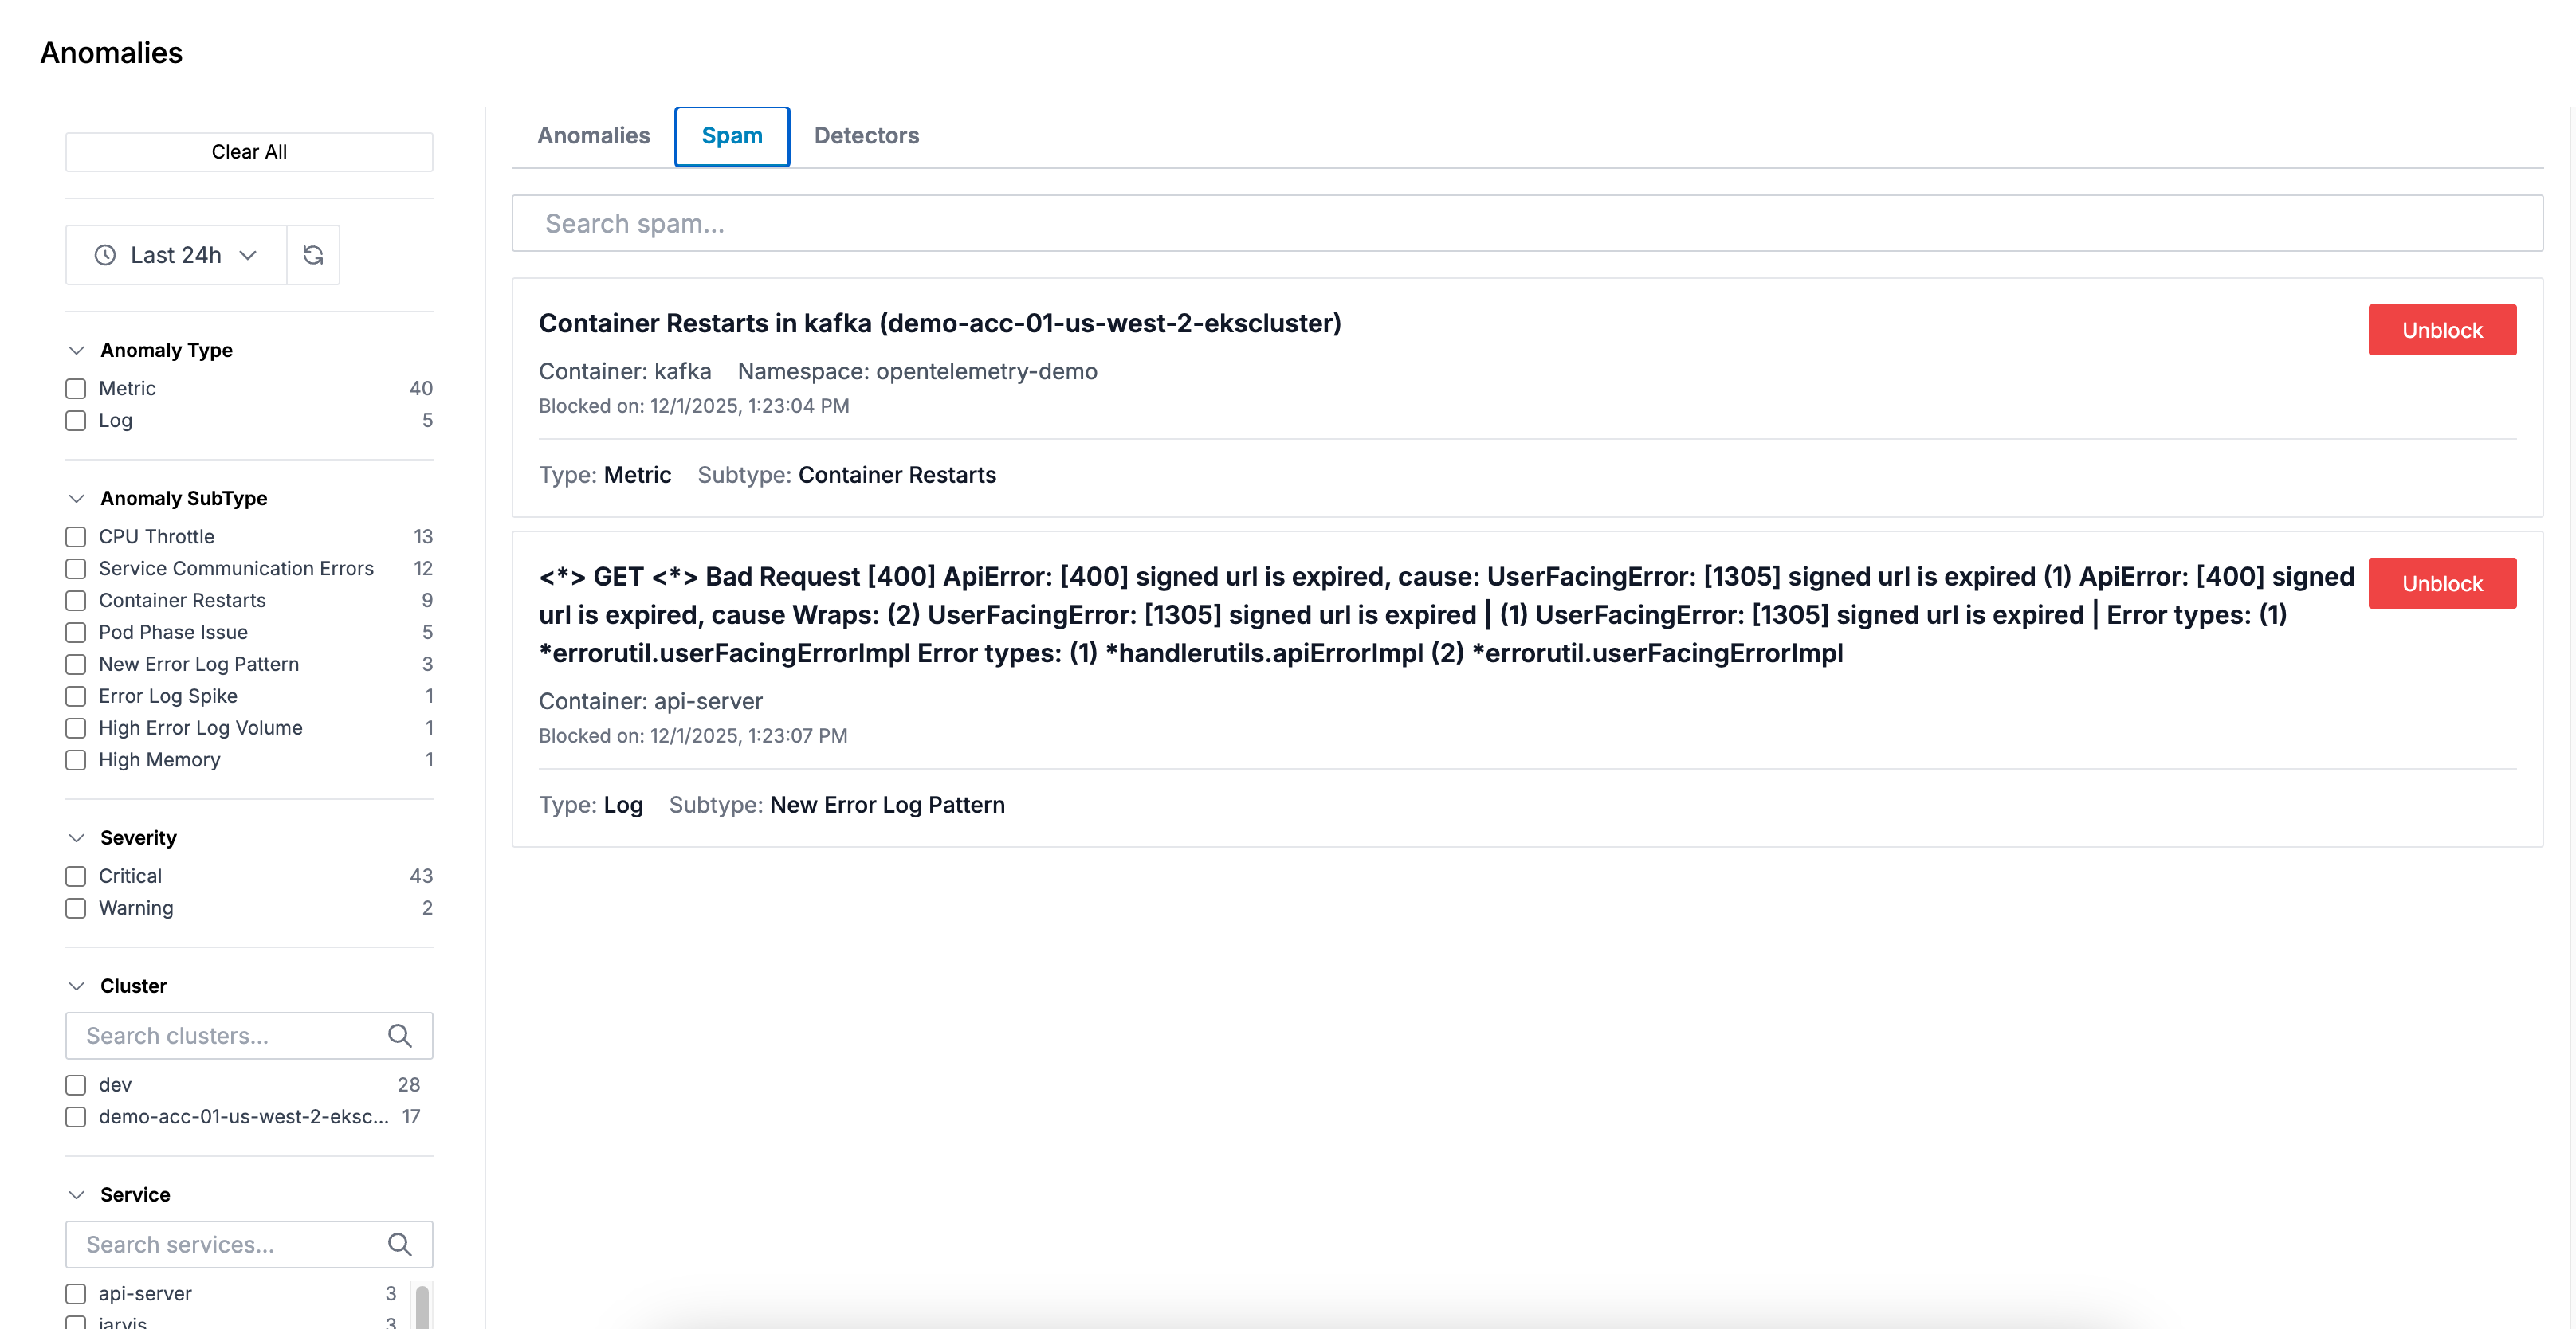
When you block an anomaly, it won't trigger alerts or appear in your anomaly feed, keeping your view focused on what matters.
FAQ
How does Oodle detect log anomalies?
Oodle doesn't evaluate individual log lines. Instead it works at the pattern level:
- Filter to errors — only error-level logs are considered. Non-error logs are never evaluated.
- Group by pattern — error logs are bucketed by cluster, container, and fingerprint (a pattern identifier for structurally similar messages).
- Compare against 24 hours ago — the total count for each group in the last 1-hour window is compared against the same 1-hour window 24 hours ago.
- Apply thresholds — a group is flagged when:
- It has more than 4 occurrences in the current hour, and
- It meets one of these conditions:
- New Pattern ��— the group didn't exist in the baseline window
- Spike — the count has at least doubled compared to 24 hours ago
- Volume — a recurring error with notable count that hasn't doubled

How does Oodle detect metric anomalies?
Oodle runs predefined queries against your infrastructure and application metrics every 5 minutes:
- Query current and historical values — each query produces a single value for the last 1-hour window and a comparison value from the same window 24 hours ago.
- Compare values — an anomaly is flagged when:
- The current value shows a significant percentage increase over the historical value (used for CPU throttling, node CPU, memory usage, API error rates, and service communication errors), or
- The current value is non-zero (used for container restarts and pod phase issues, where any occurrence is notable).

What time window is used to detect anomalies?
Both log and metric anomaly detection compare two one-hour windows:
- Current window: the last hour
(
now − 1htonow) - Baseline window: the same hour one day ago
(
now − 25htonow − 24h)

Using the same time-of-day accounts for diurnal traffic patterns. The checks run every 5 minutes, so anomalies are re-evaluated with fresh data on each cycle.
How long after a fix before an anomaly disappears?
Anomalies are not stored as persistent records — they are re-computed from live data every 5 minutes. Once a fix is deployed:
- The one-hour sliding window needs to clear of pre-fix data. In the worst case this takes up to one hour after the fix.
- On the next 5-minute check after the window clears, no new data point is emitted for that anomaly.
- The anomaly's trend chart in the UI drops to zero and it effectively disappears from the Anomalies page.
This means it can take up to 1 hour after a fix is deployed for the anomaly to fully disappear.

Can anomaly detection be customized?
Yes — Oodle's anomaly detection is customizable. Reach out to us to tailor detection rules based on your specific data patterns and operational needs.
Best Practices
- Review Regularly: Check the Anomalies page regularly to catch emerging issues early
- Block Noise: Use the blocking feature to suppress known non-issues or expected patterns
- Create Targeted Alerts: Set up alerts for specific anomaly types that are most critical to your operations
- Investigate Recurring Anomalies: Pay attention to recurring anomalies, as they may indicate persistent underlying issues
- Use Filters: Filter by cluster, namespace, and service to focus on specific areas of your infrastructure
Support
If you need assistance or have any questions, please reach out to us through:
- Email at [email protected]