Trace Explorer
The Trace Explorer provides a comprehensive view of your distributed traces, helping you understand request flows, identify performance bottlenecks, and debug issues across your microservices.
Explore Traces live in the Oodle Playground.
Overview
The Traces page is organized into several key sections:
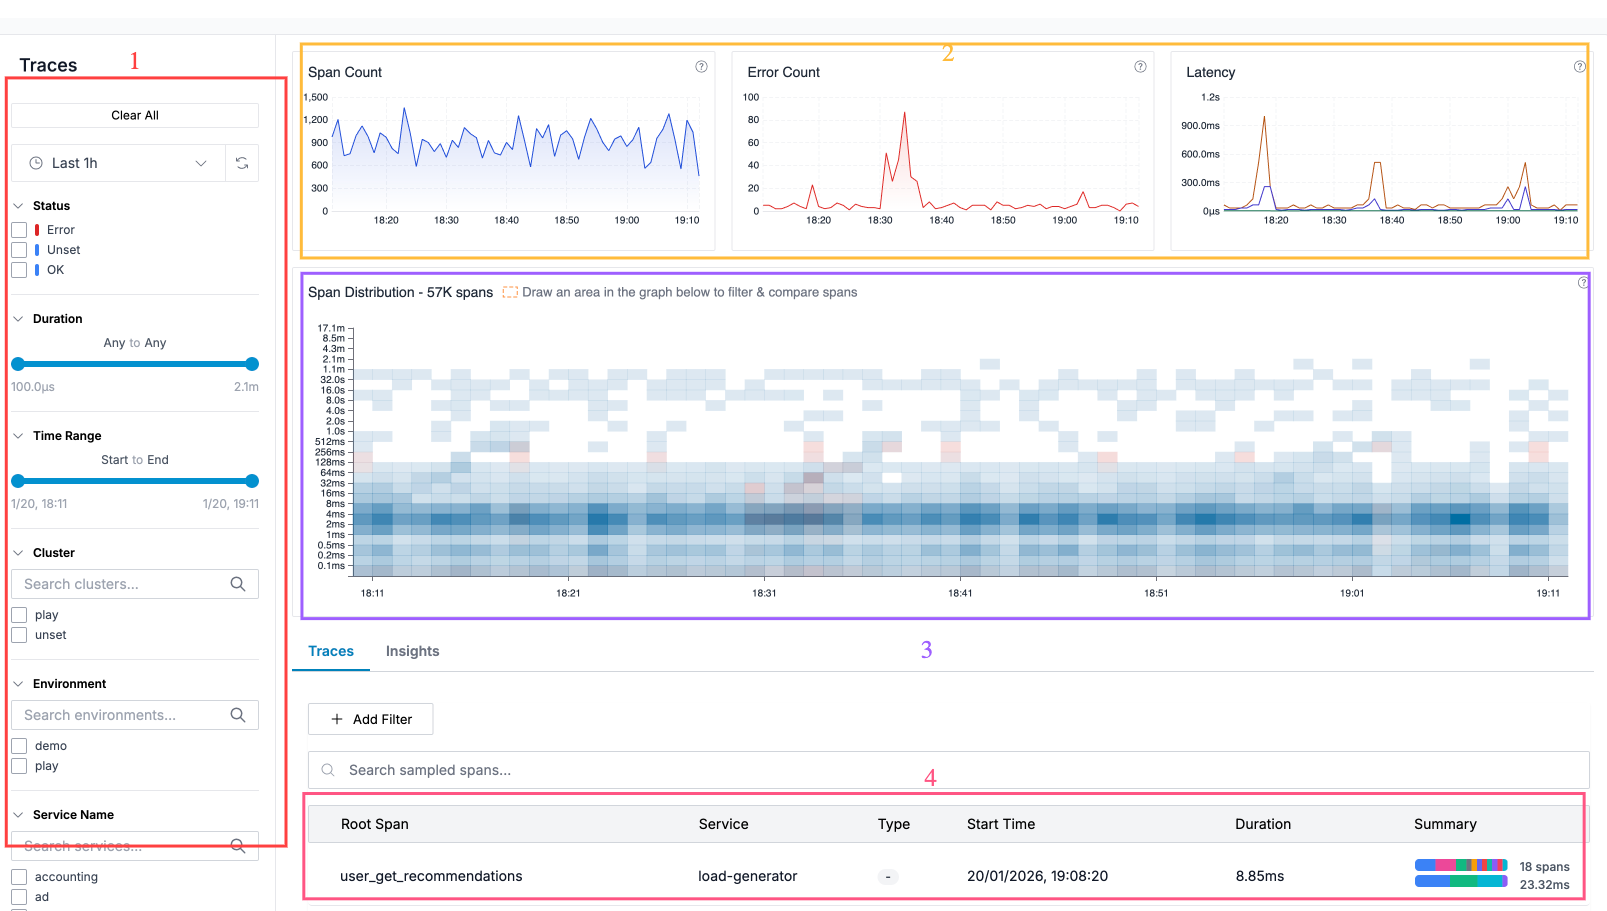
Sidebar Filters
The left sidebar provides filtering options to narrow down traces:
- Time Range: Select preset ranges (Last 1h, 6h, 24h, etc.) or custom date/time ranges
- Status: Filter by span status (OK, Error, Unset)
- Duration: Slide to filter spans by duration range, e.g. to debug high latency traces
- Cluster: Filter by cluster
- Environment: Filter by deployment environment
- Service Name: Filter by specific services
- Span Name: Filter by specific span names.
Distribution Charts
The top section displays three overview charts:
- Span Count: Total number of spans over time, indicating traffic volume.
- Error Count: Number of failed spans, highlighting system health
- Latency: P50, P95, and P99 latency percentiles over time
These charts are filtered based on the left sidebar filters to allow you to understand trends.
Span Distribution Heatmap
The heatmap visualizes span distribution by time and duration:
- X-axis: Time
- Y-axis: Duration (logarithmic scale)
- Color intensity: Number of spans in each bucket
- Color: Blue for successful spans, red for errors
The heatmap allows you to quickly see any changes in the distribution of the spans w.r.t status (Ok, Error) or latency.
You can drag an area on the heatmap to select a specific time and duration range which will filter the traces displayed in the bottom table for that specific time and duration range.
The heatmap is filtered based on the left sidebar filters to allow you to focus on specific cluster/services/spans.
Tabs
Below the charts, two tabs provide different views:
- Traces: Browse and search individual traces
- Insights: Analyze attribute distributions for selected spans
Key Features
Real-time Filtering
All filters update the view in real-time, allowing you to quickly drill down into specific traces without page reloads.
Cross-Signal Navigation
From any trace, you can navigate to related:
- Logs from the same service and timeframe
- Infrastructure metrics (CPU, memory) for the service
- Service dependency graphs
Selection-Based Analysis
Select a region on the distribution chart to:
- Filter the trace list to spans in that time/duration range
- Compute insights showing attribute distributions for the selection
- Compare characteristics of slow or failing requests
Related Documentation
- Traces Summary - Browse and search trace data
- Trace View - Detailed trace waterfall and analysis
- Trace Insights - Attribute analysis for selected spans
Support
If you need assistance or have any questions, please reach out to us through:
- Email at [email protected]