Trace View
When you click on a trace in the list, the Trace View panel opens to show detailed information about the request flow across services.
If you already have a trace id, you can directly lookup the trace details using the Trace Lookup page from the Menu sidebar.
Trace Header
The header displays:
- Trace ID: Unique identifier (click to copy)
- Root Service: The service that initiated the trace
- Span Distribution: Distribution of span counts by name
- Duration by Service: Duration breakdown by service
Tabs
The Trace View provides multiple tabs for different perspectives:
Trace Tab
The waterfall visualization shows all spans in the trace:
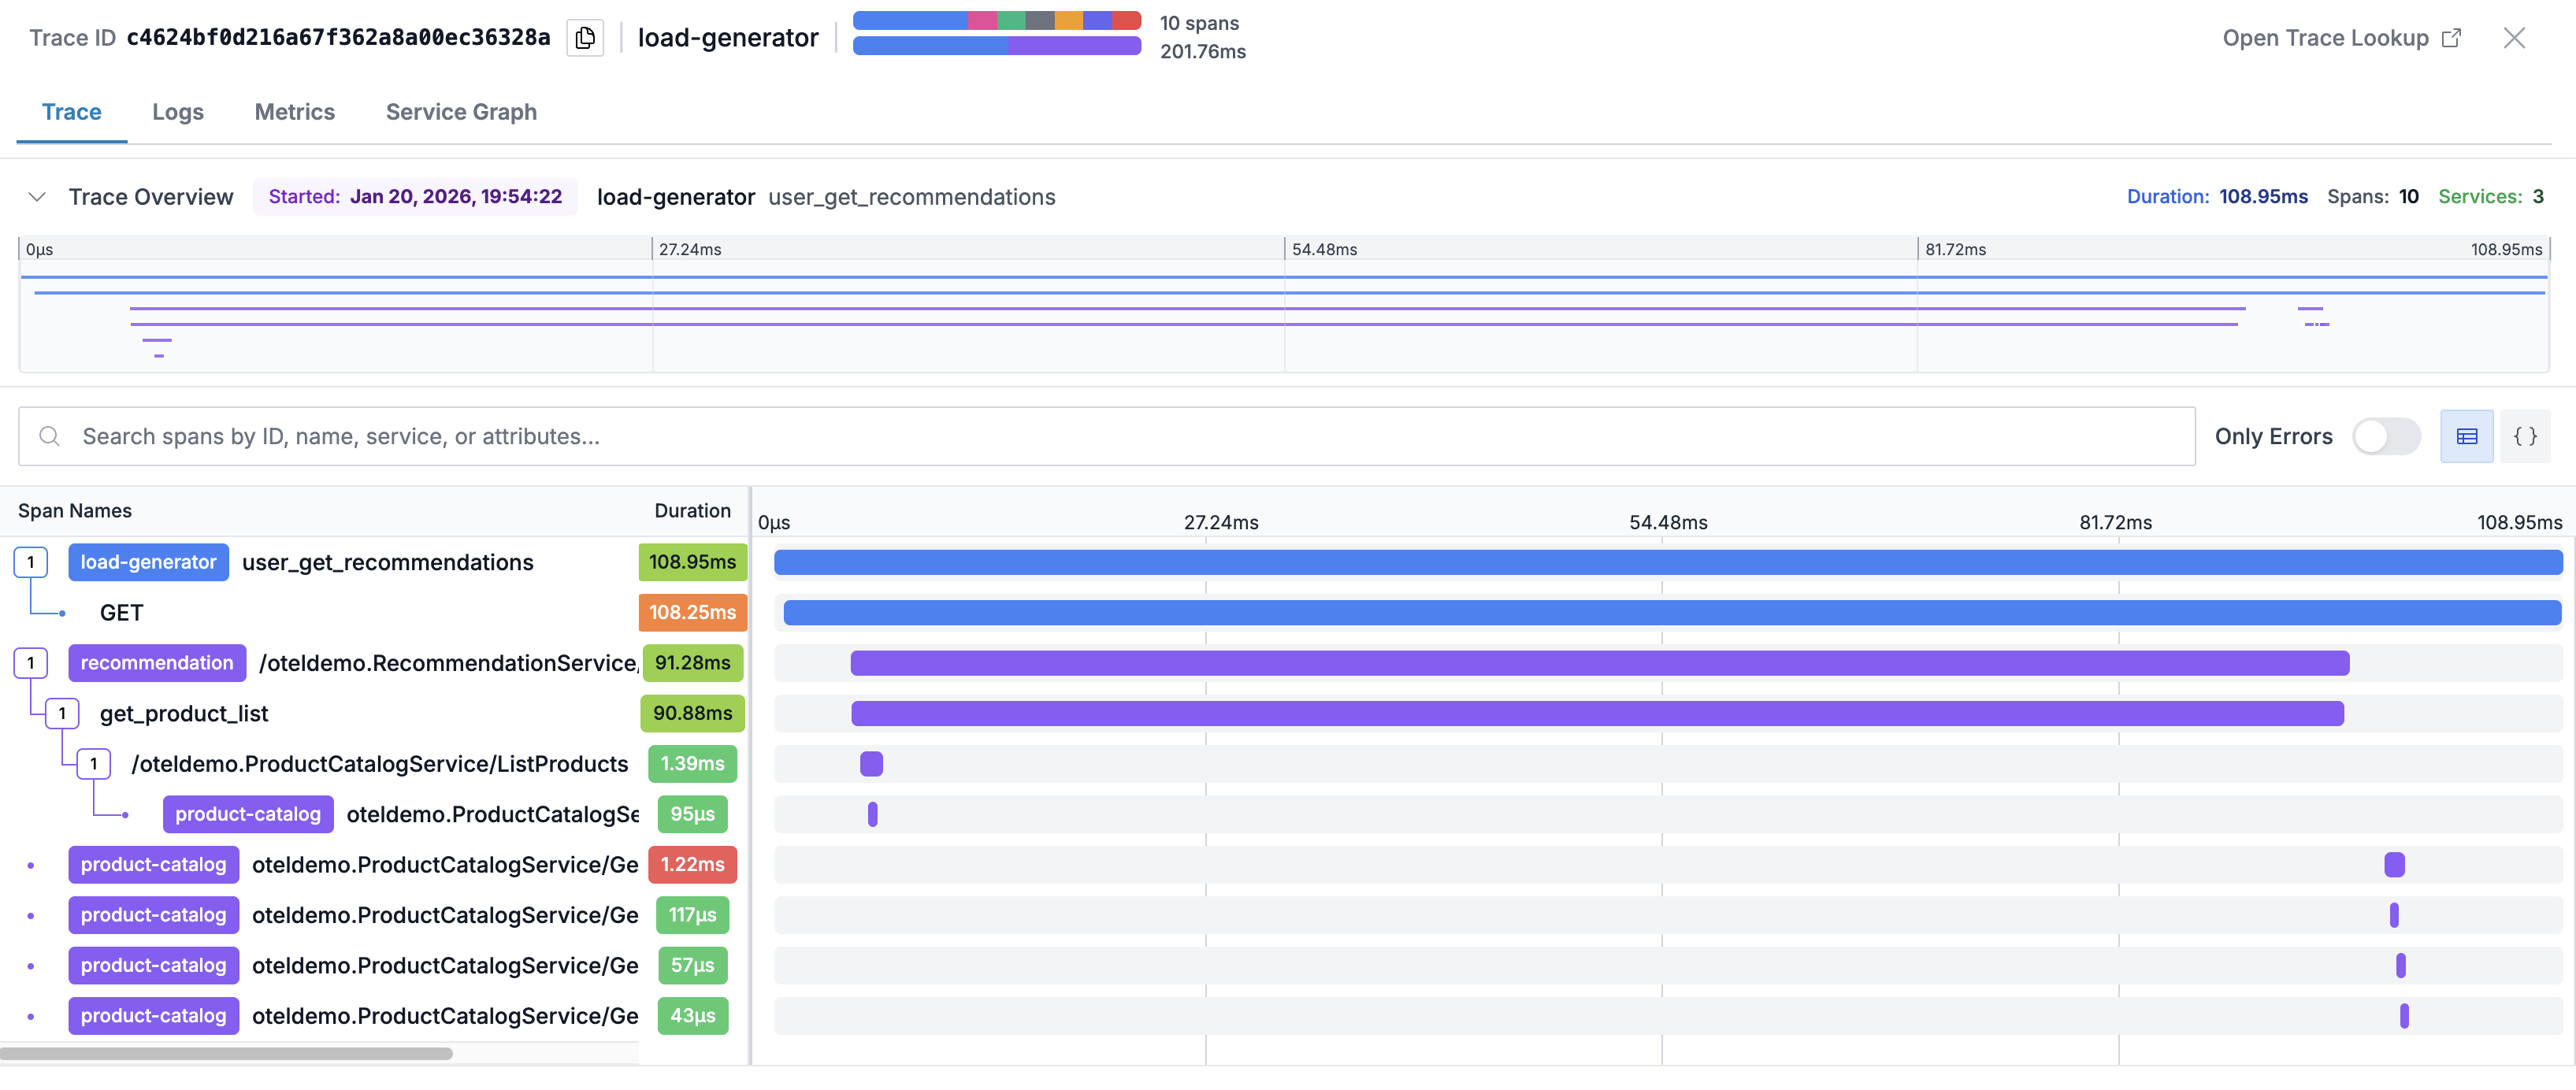
Key Features:
- Timeline: Visual representation of span timing in a flamegraph
- Hierarchical view: Parent-child relationships between spans
- Latency Duration Comparison: Latency distribution of each span in comparison to other traces
- Duration bars: Length indicates relative duration
- Status colors: Red highlights for error spans
- Expand/collapse: Click spans to show/hide children
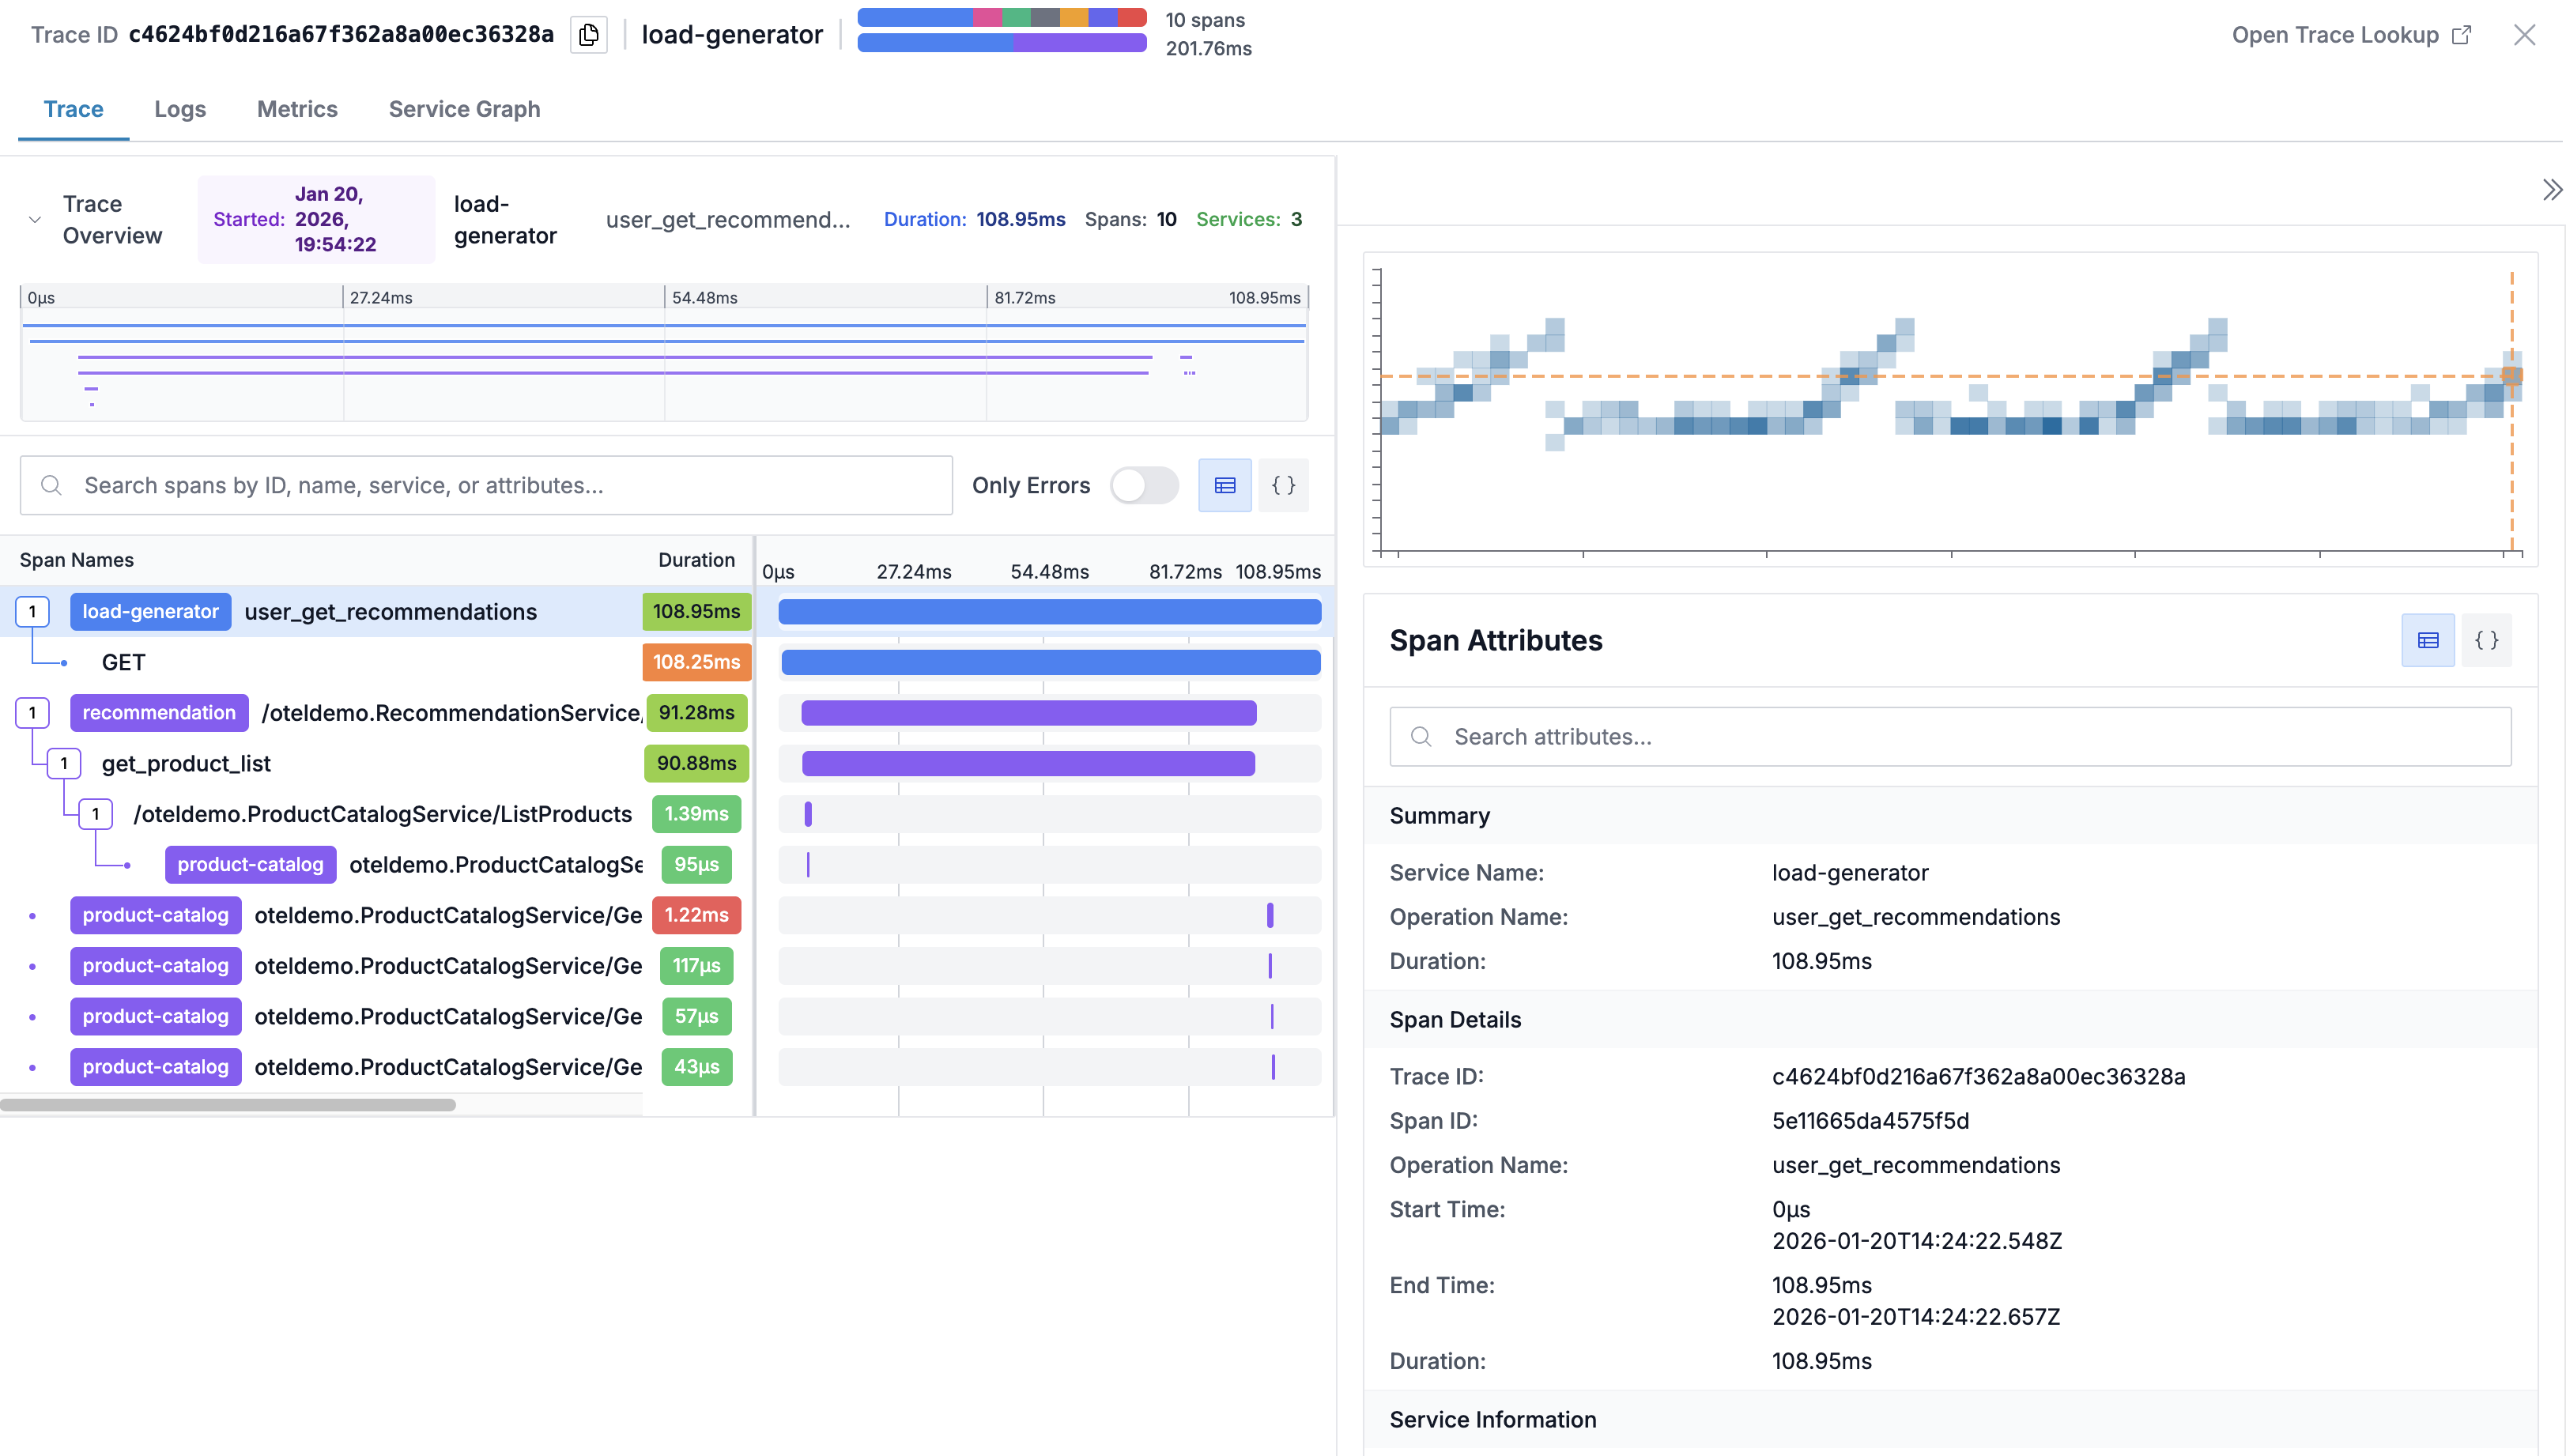
Span Details
Click on any span to view:
- Operation name and service
- Start time and duration
- Span status (OK, Error, Unset)
- All span attributes
- Events and logs attached to the span
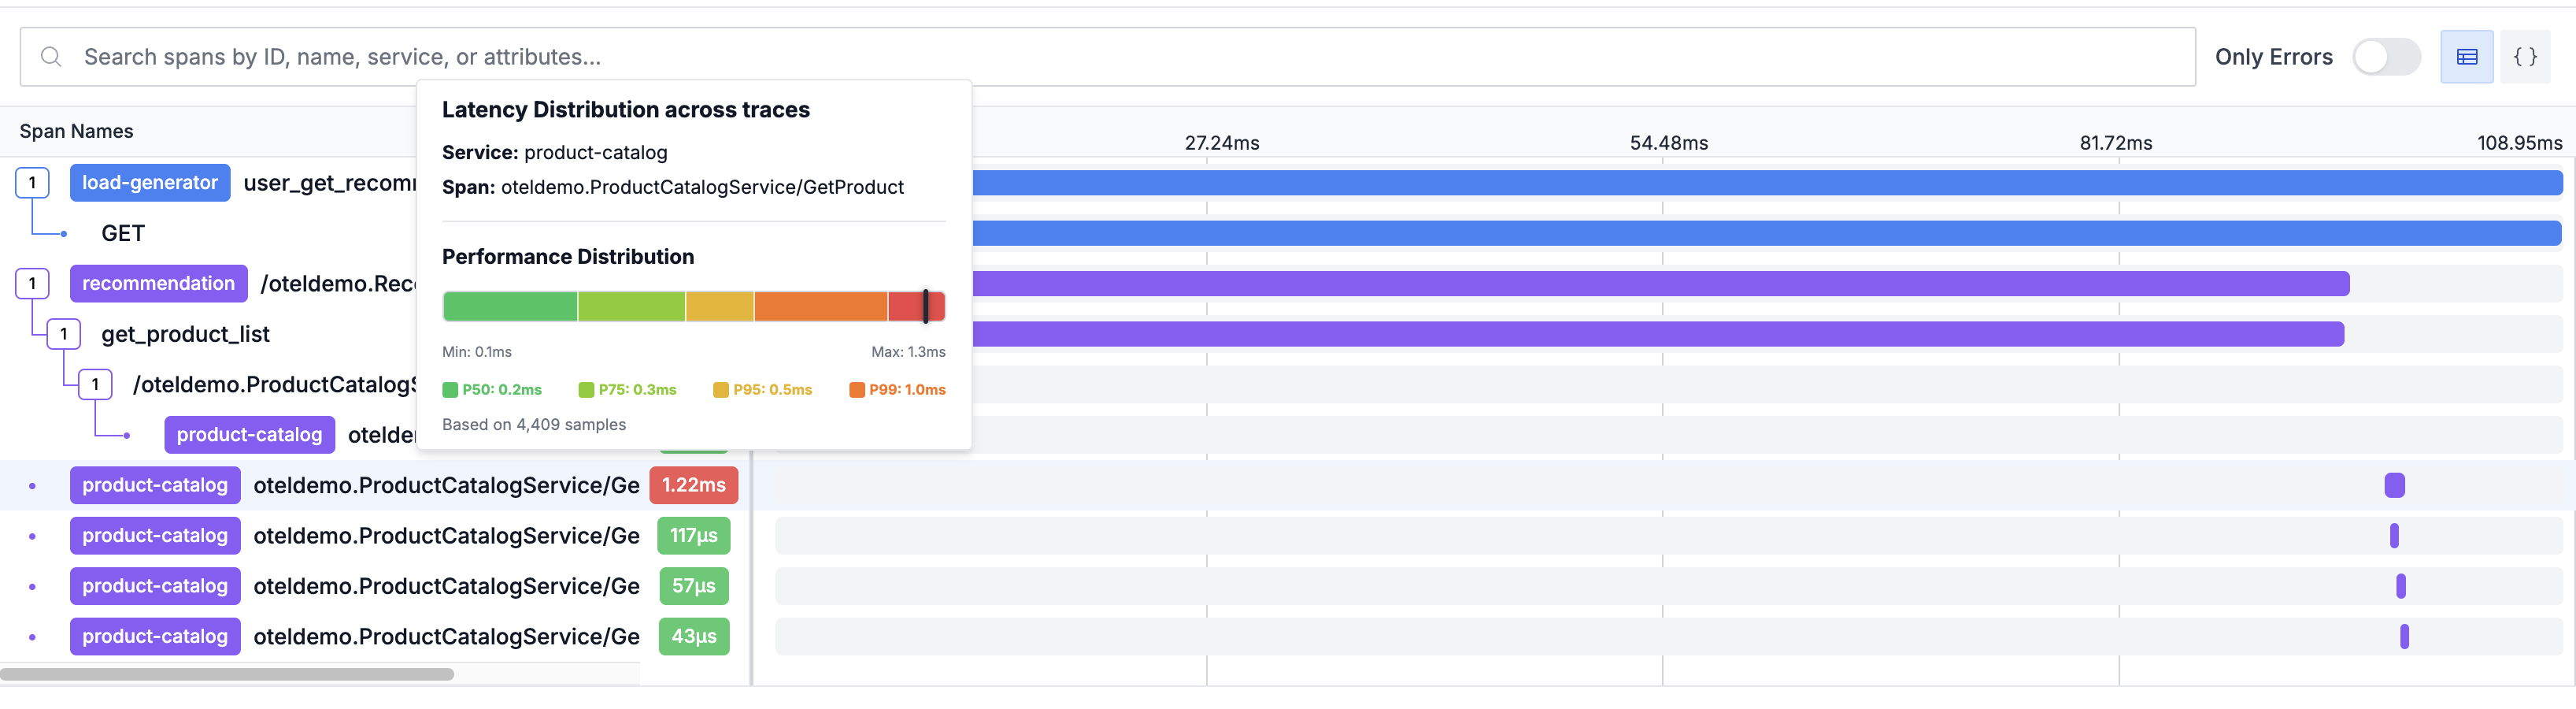
Latency Distribution
On hovering duration column on any span row, you can see its latency comparison with same span across other traces. This helps you quickly know whether the span latency is expected or anomolous w.r.t other traces.
Logs Tab
View logs from services involved in the trace:
- Filtered to the trace's time window
- Correlated by trace ID when available
- Searchable within the log view
This makes it easy to cross-correlated traces with corresponding logs.
Metrics Tab
Infrastructure metrics for services in the trace:
- CPU usage during the request
- Memory consumption
This makes it easy to cross-correlated performance with resource utilization.
Service Graph Tab
Visual representation of service dependencies involved in the trace:
- Shows services involved in the trace
- Displays call relationships
Link to Related Data
From the trace view, you can navigate to:
- Log entries from the same services
- Metrics dashboards
- Service topology views
Best Practices
- Follow the critical path: Identify the longest spans to find bottlenecks
- Check error spans: Red spans indicate failures worth investigating
- Look at span gaps: Time between spans may indicate queuing or async processing
- Review attributes: HTTP status codes, database queries, and error messages provide debugging context
- Compare with metrics: Use the Metrics tab to see if resource constraints correlate with slow spans
Support
If you need assistance or have any questions, please reach out to us through:
- Email at [email protected]