Trace Insights
The Insights tab in the Trace Explorer page provides automated analysis of span attributes, helping you identify patterns and anomalies in your traces by comparing two selected regions.
How It Works
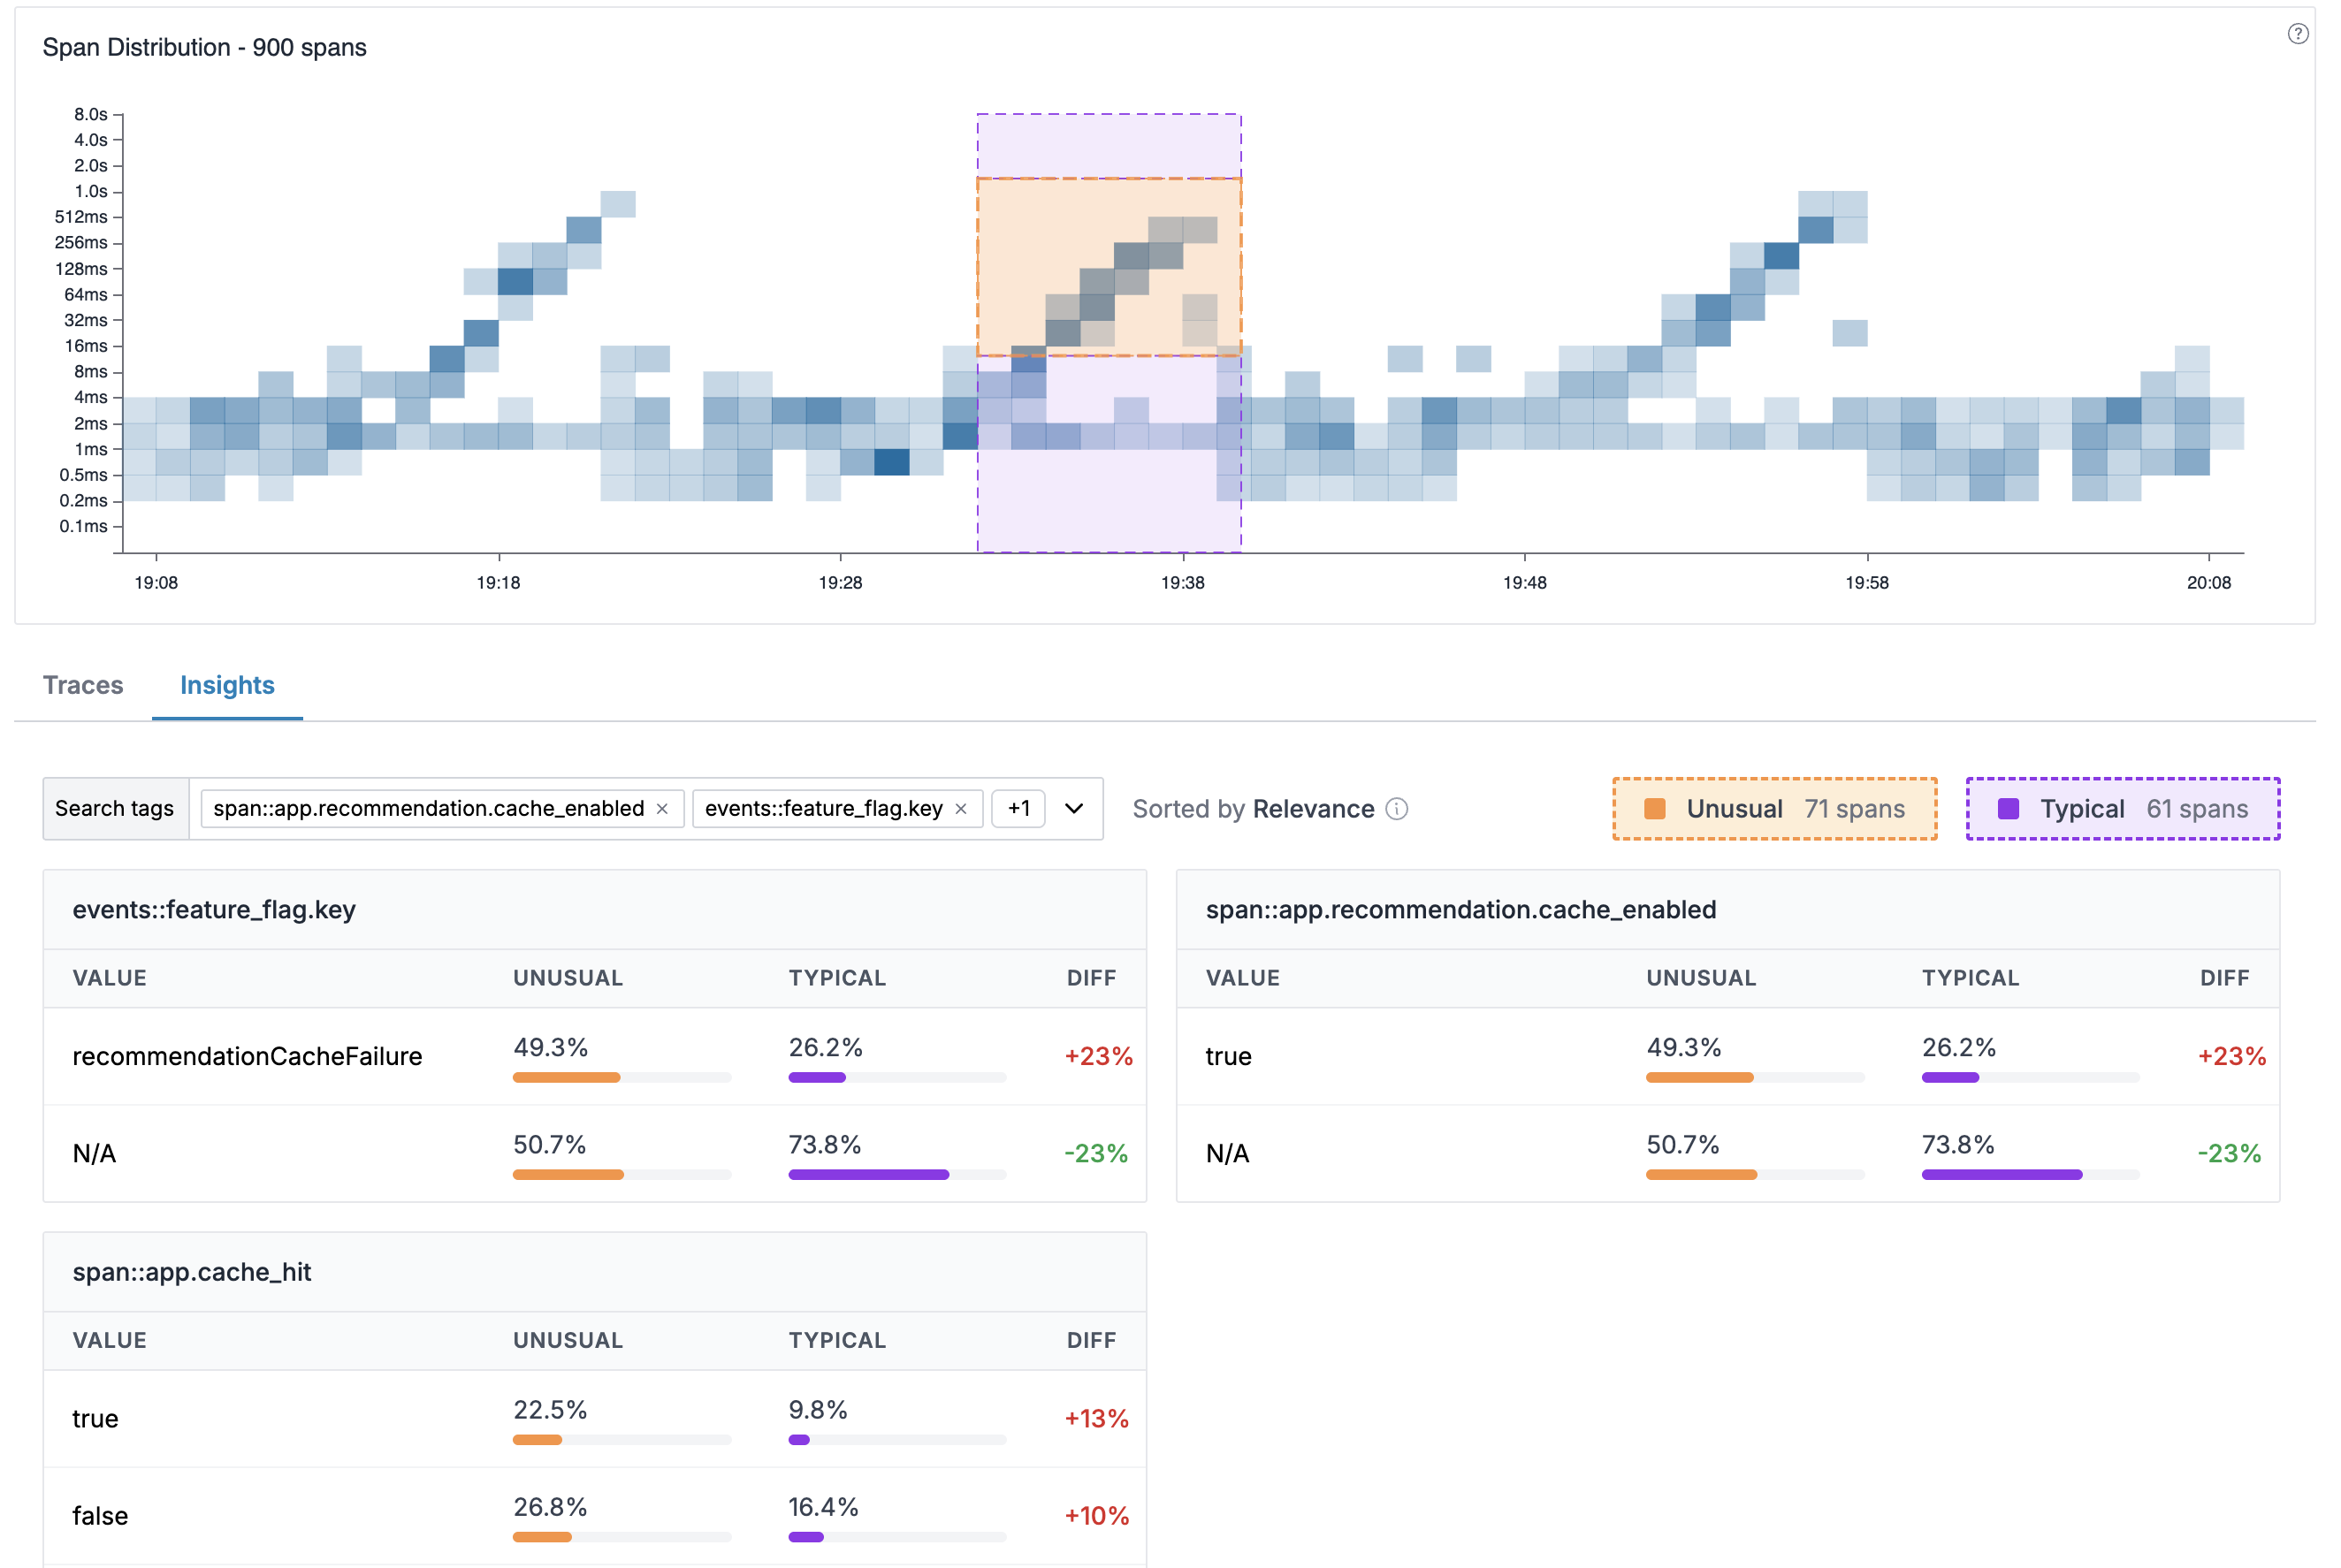
Trace Insights compares attribute distributions between two regions you select on the distribution heatmap:
- Unusual region (orange): The region containing anomalous spans you want to investigate
- Typical region (purple): A baseline region representing normal behavior (derived automatically to be all spans outside the unusual region for the same time range)
The system analyzes all spans in both regions, compares attribute distributions, and ranks attributes by how strongly they differ between the two selections.
Understanding the Display
Selection Summary
At the top of the Insights tab, you'll see:
- Search tags: Filter which attributes to be displayed
- Span counts: Number of spans in each selection (e.g., "Unusual 71 spans", "Typical 61 spans")
Attribute Tables
Results are displayed as multiple attribute tables in a grid layout. Each table represents one span attribute and shows:
| Column | Description |
|---|---|
| VALUE | The specific value of the attribute |
| UNUSUAL | Percentage of unusual spans with this value (orange bar) |
| TYPICAL | Percentage of typical spans with this value (purple bar) |
| DIFF | The difference between unusual and typical percentages |
Understanding DIFF Values
The DIFF column shows how attribute values differ between selections:
- Positive values (e.g., +23%): This value appears more frequently in the unusual selection — a potential contributor to the anomaly
- Negative values (e.g., -23%): This value appears less frequently in the unusual selection
- Higher absolute values: Stronger correlation with the anomaly
Using Insights
Identify Root Causes
When investigating slow or failing requests:
- Select the problematic region as "Unusual" on the distribution chart
- Switch to the Insights tab
- Look for attributes with high positive DIFF values
- These attributes are disproportionately common in anomalous spans
Example: If span::app.recommendation.cache_enabled=true shows +23% DIFF,
spans with cache enabled are significantly more common in the unusual region,
suggesting a potential cache-related issue.
Search and Filter Tags
Use the search tags dropdown to filter the insights to specific tags.
Best Practices
- Look for high DIFF values: Attributes with large positive differences are most likely related to the issue
- Consider negative DIFF: Attributes with negative DIFF are under-represented in problems, potentially indicating healthy code paths
- Iterate selections: Try different typical baselines to validate your findings
Support
If you need assistance or have any questions, please reach out to us through:
- Email at [email protected]