Metrics Drilldown
Metrics Drilldown provides a visual, top-down approach to exploring your metrics. Instead of writing PromQL queries by hand, you browse metrics through an interactive interface that lets you filter, group, and drill into data progressively.
Getting Started
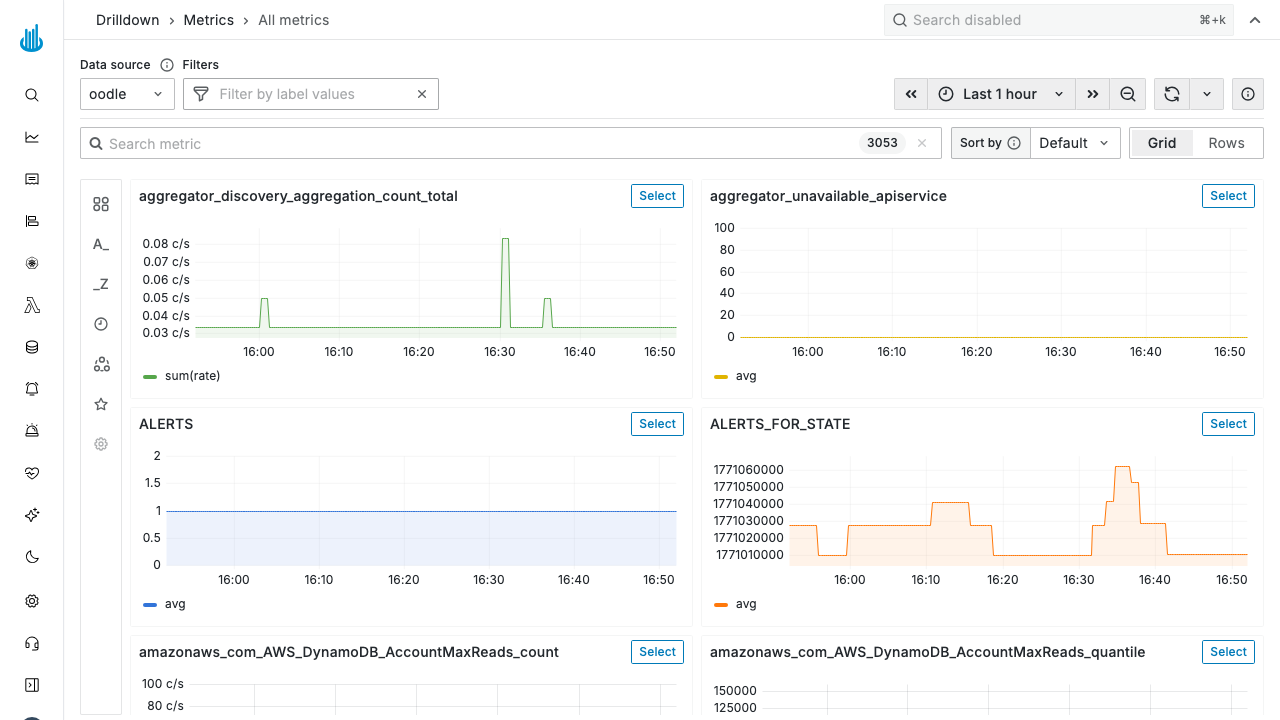
Navigate to Metrics → Drilldown in the sidebar. The page opens with a grid of all available metrics, each showing a small time-series preview chart.
Page Layout
Filters
Use the Filter by label values bar to narrow results by adding one or more label matchers. Filters persist as you navigate between metrics, so you can explore different metrics within the same scope (e.g. a specific namespace or cluster).
Search
The Search metric bar filters the list of metrics by name. The count next to the search bar shows how many metrics match the current filters.
Sort and Layout
- Sort by — Change the sort order of metric cards (default, alphabetical, etc.).
- Grid / Rows — Toggle between a grid of small-multiples or a single-column row layout.
Exploring a Metric
- Find a metric — Scroll or search the grid to locate the metric you are interested in.
- Click Select — Each metric card has a Select button that opens the detailed view for that metric.
- Break down by label — In the detail view, choose a label dimension to split the graph into individual series, making it easy to spot which label value is driving a spike or anomaly.
- Add filters — Continue narrowing the view with label filters.
Time Range
Use the time picker in the toolbar to adjust the visible time window. Back/forward arrows let you shift the window, and the zoom-out button widens the range.
Best Practices
- Start broad, then narrow — Begin with the default "All metrics" view to orient yourself, then drill into specific metrics.
- Use label breakdowns to identify the source of anomalies (e.g. which pod, host, or region is affected).
- Combine with Explore — Once you find an interesting metric in Drilldown, switch to Metrics Explore to write a precise PromQL query for dashboards or alerts.
Support
If you need assistance or have any questions, please reach out to us through:
- Email at [email protected]