AI Agent Observability
Oodle's AI Agent Observability gives engineering teams visibility into how AI coding agents are used across the organization. Track token usage, costs, session activity, tool calls, and more — all in one place.
Why Monitor AI Agents?
AI coding agents are powerful but opaque. Without observability you cannot answer questions like:
- How much are we spending on AI-assisted coding?
- Which models are being used, and by whom?
- How many sessions run per day or week?
- Are tool calls succeeding, or are agents hitting errors?
- What prompts are developers sending to the agent?
Oodle collects telemetry exported by AI agents via OpenTelemetry and surfaces it through a dedicated analysis page with pre-built dashboards and a session-level event timeline.
Supported Agents
| Agent | Metrics | Events / Logs | Status |
|---|---|---|---|
| Claude Code | Token usage, cost, sessions, active time, lines of code, commits, PRs | User prompts, API requests, tool results, tool decisions | GA |
| OpenAI Codex | Token usage, conversations, tool calls, WebSocket requests, performance timings | SSE events, WebSocket events, conversation starts, tool decisions, tool results | GA |
Getting Started
- Navigate to Settings → Integrations
- Open the AI Agent Observability section
- Click the tile for the agent you want to set up
- Select an API key and follow the steps shown
See the agent-specific pages for detailed setup instructions:
Analysis Page
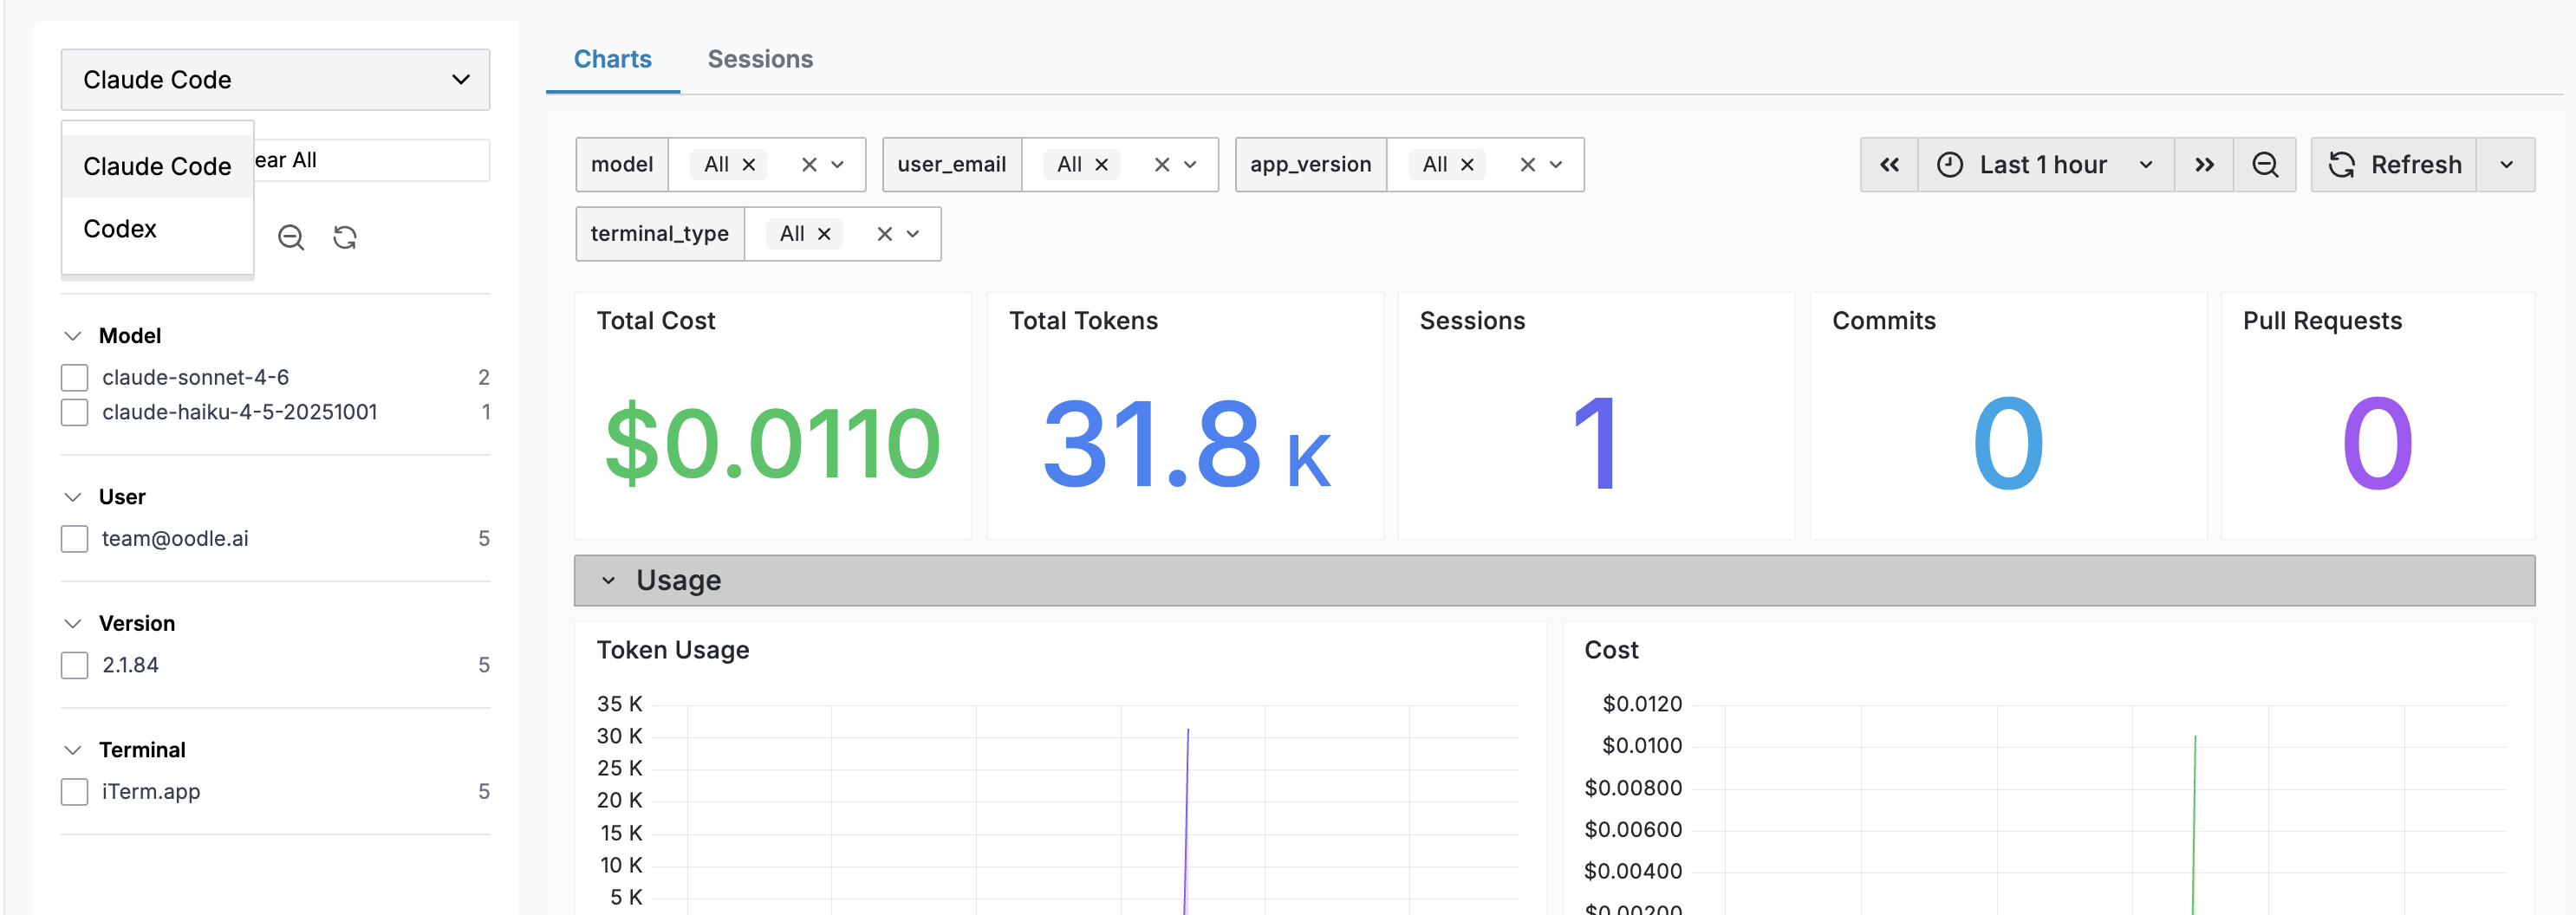
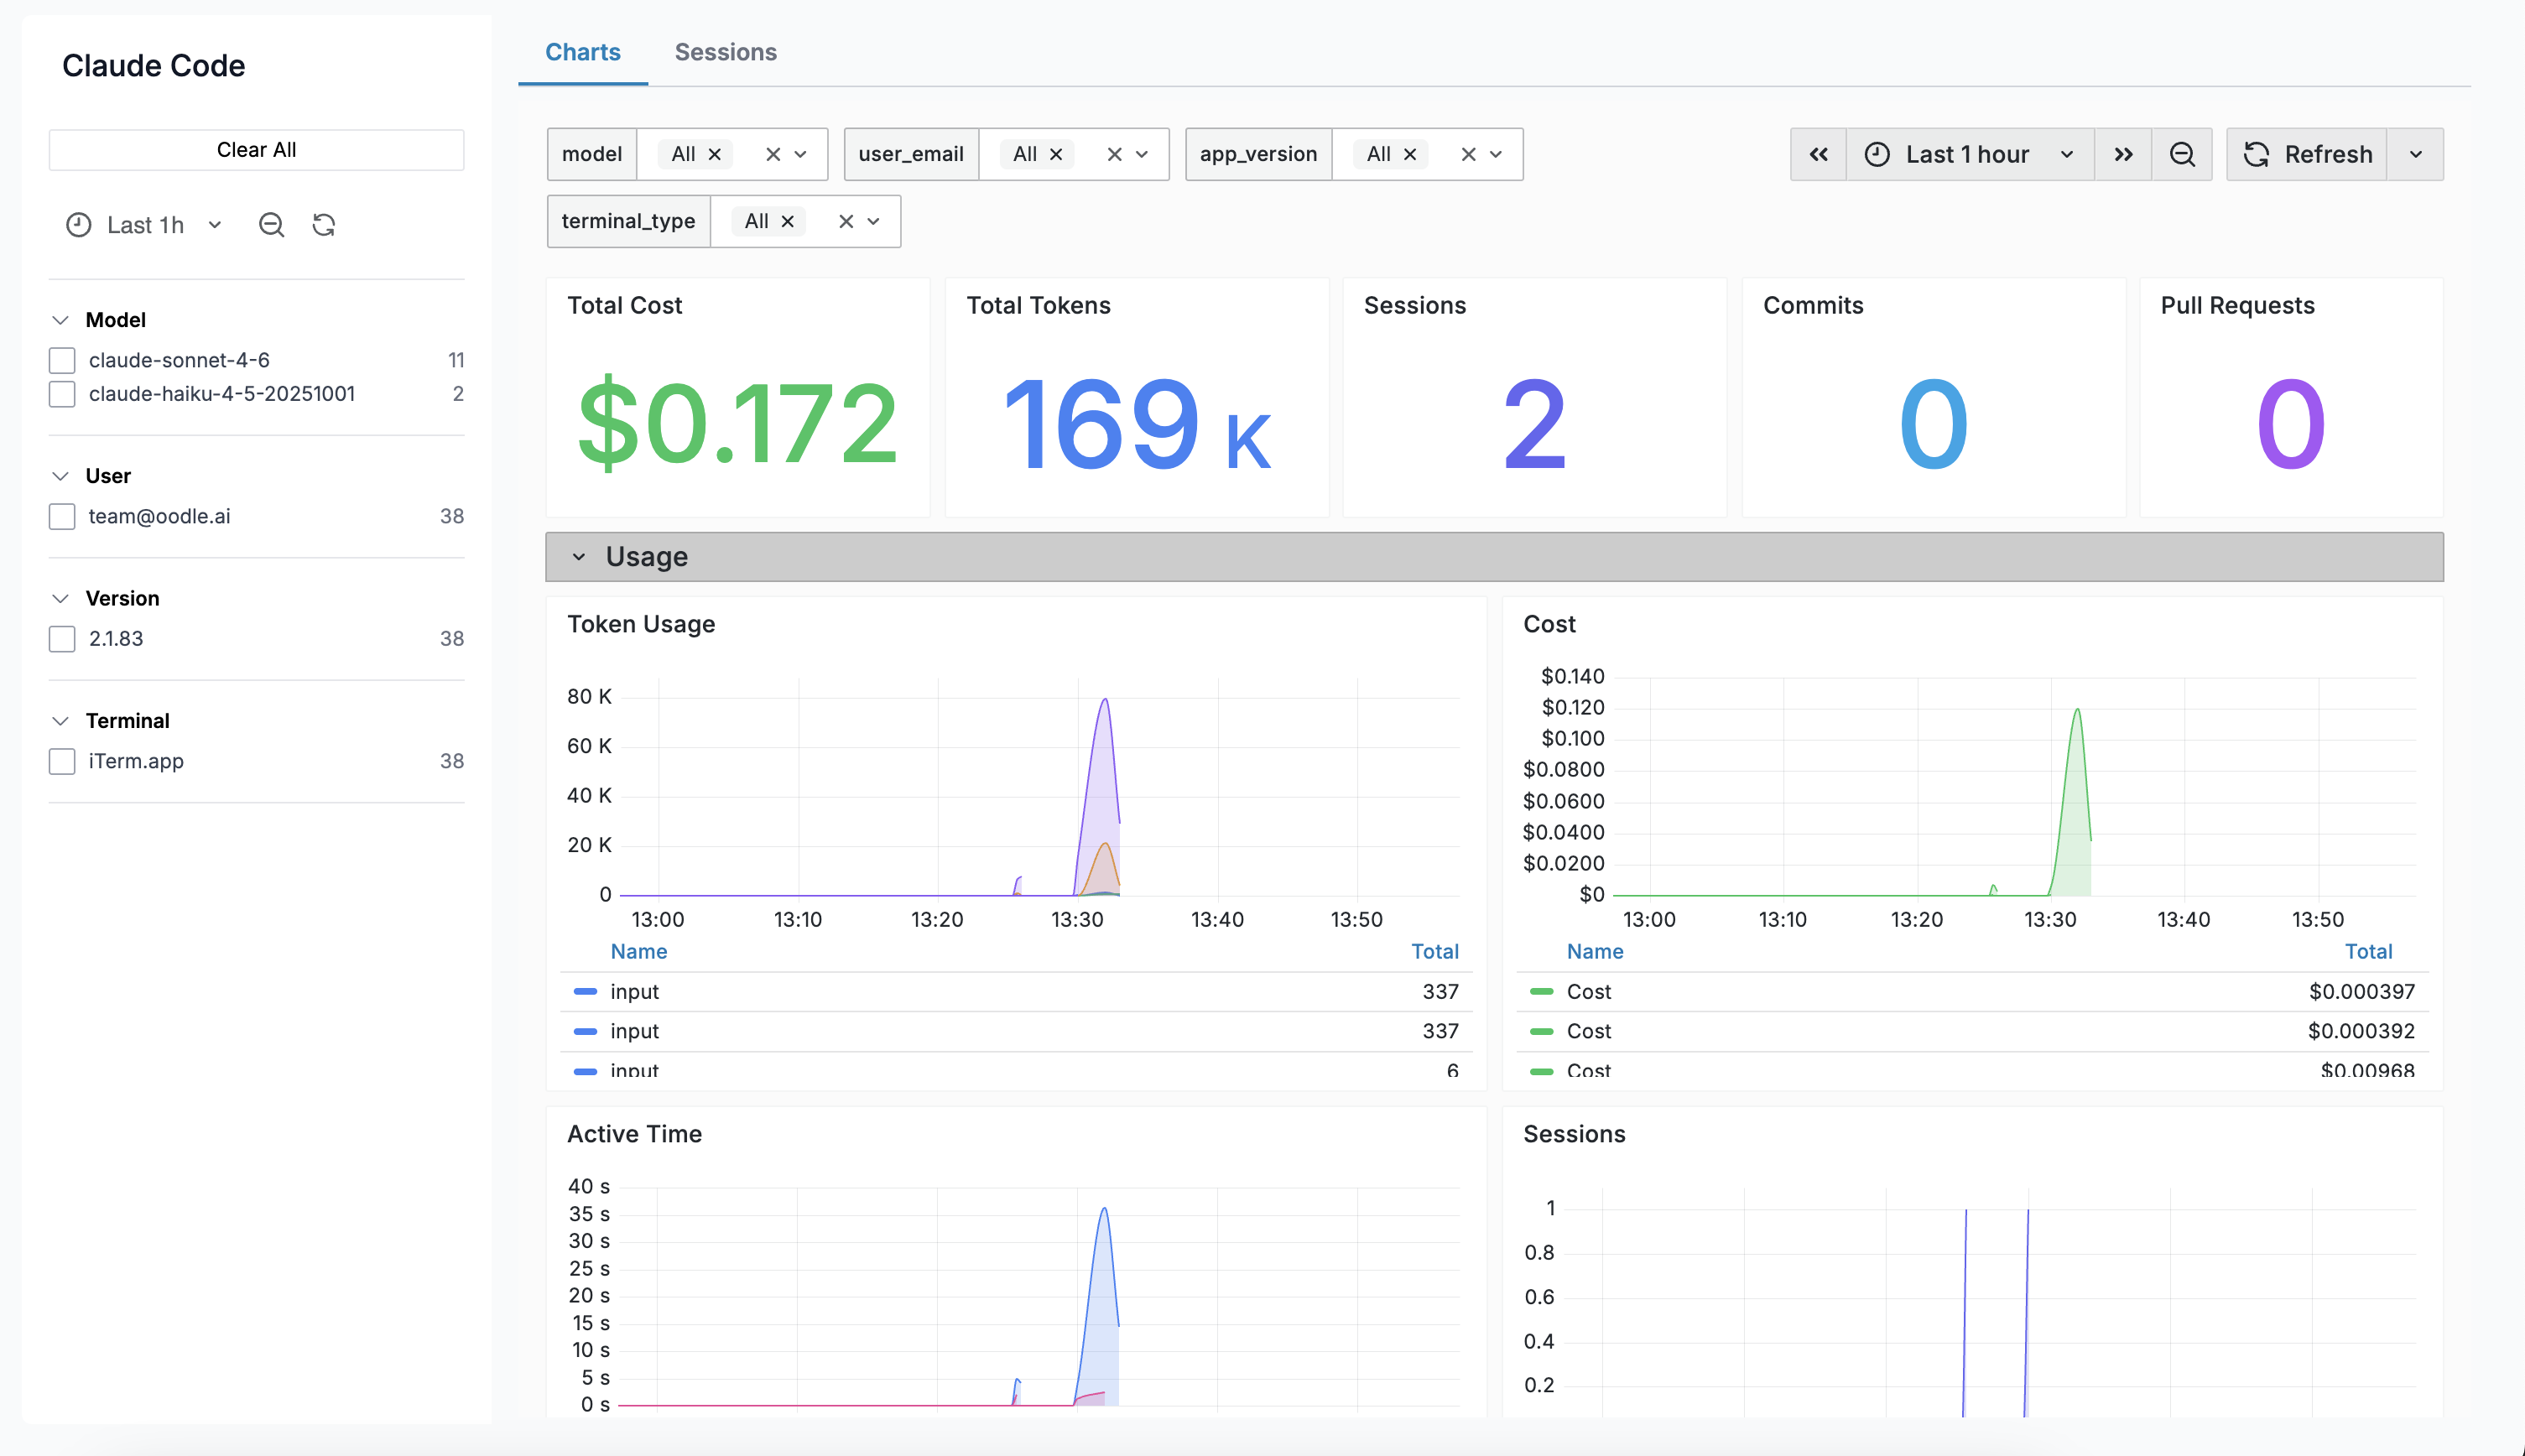
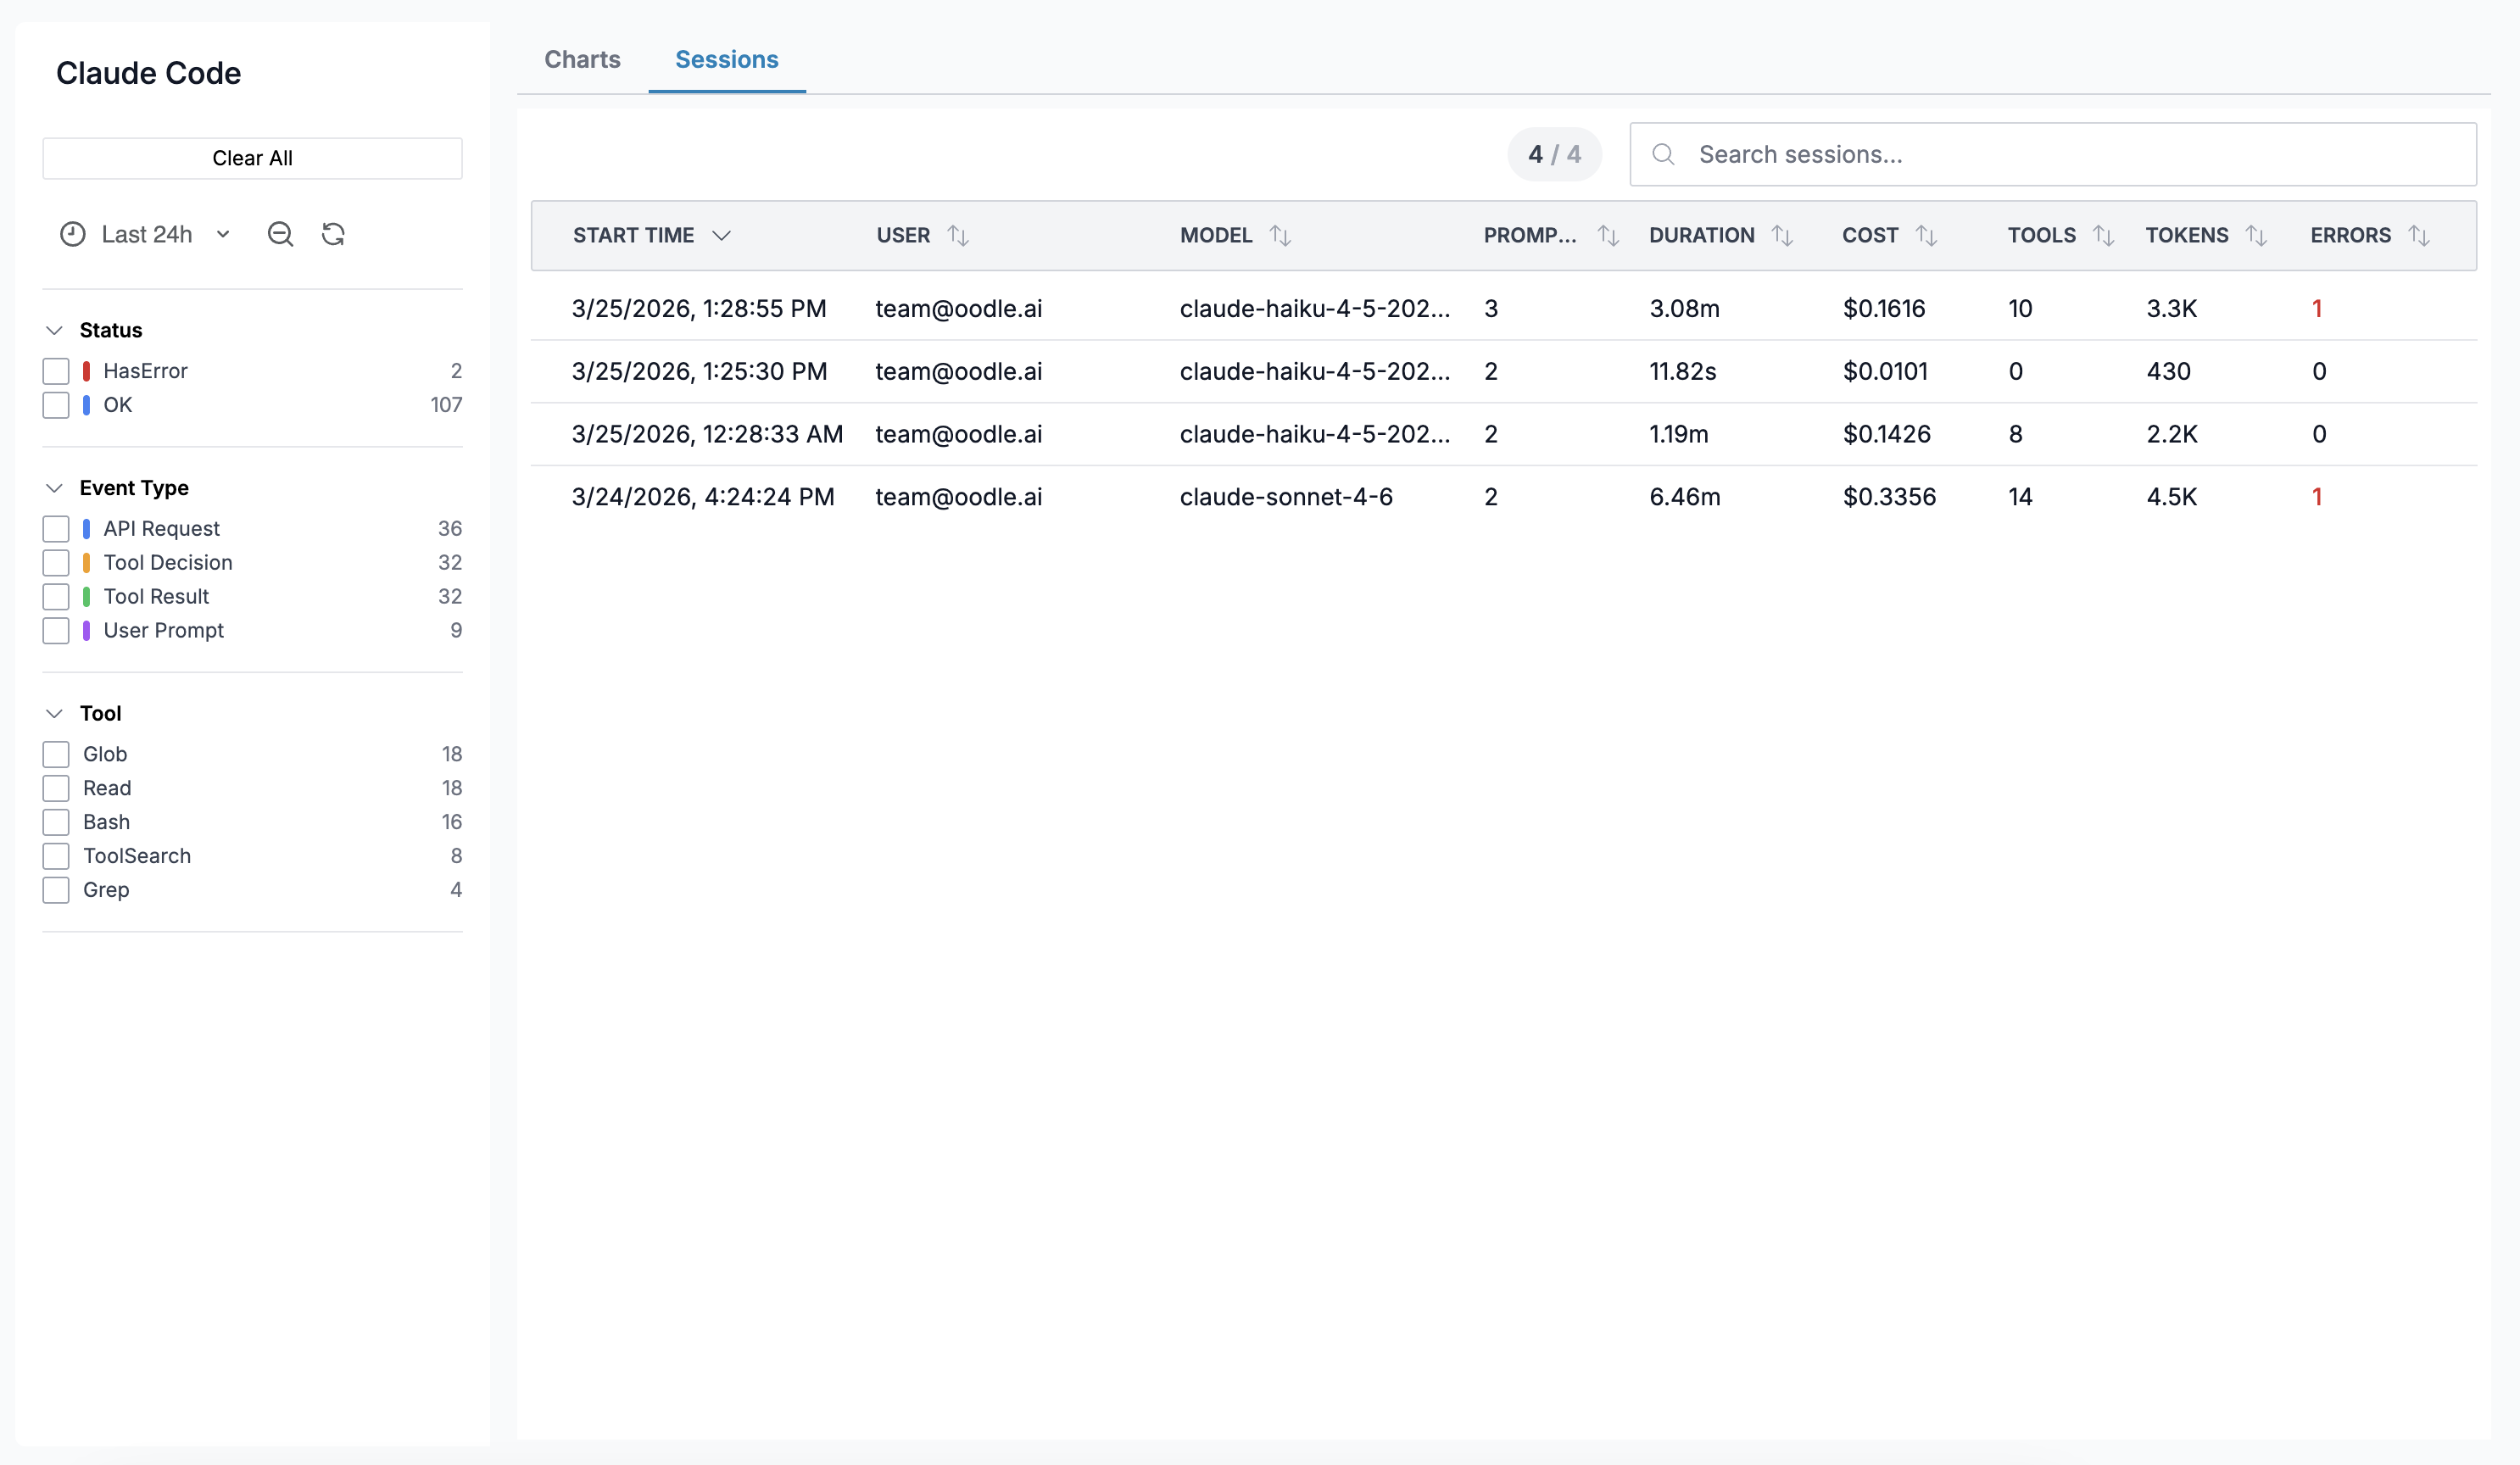
The AI Agent Analysis page is available in the sidebar under AI Assistants. It has two tabs: Charts and Sessions.
Use the agent dropdown at the top of the sidebar to switch between Claude Code and Codex.
Charts Tab
Embeds a Grafana dashboard with pre-built panels tailored to each agent — token usage, session counts, tool activity, and more.
Sessions Tab
Shows a table of individual sessions with key stats. Click any row to open a Session Detail drawer showing a turn-by-turn timeline of every event.
Sidebar Filters
A sidebar on the left lets you filter data by:
- Time Range — Grafana-style time range picker
- Event Type — filter events by type (sessions tab only)
- Status — OK or HasError (sessions tab only)
- Model — filter by LLM model
- User — filter by developer email
- App Version — filter by agent version
- Terminal — filter by terminal type
Best Practices
- Start with a single user to verify telemetry is flowing before rolling out org-wide.
- Enable prompt logging to get full prompt text in the event timeline — useful for understanding usage patterns.
- Set up alerts on cost or token metrics to catch unexpected spending spikes.
- Use sidebar filters to drill down by user or model when investigating specific sessions.
Support
If you need assistance or have any questions, please reach out to us through:
- Email at [email protected]