Claude Code
Claude Code ships with built-in OpenTelemetry support. Once enabled, Oodle collects metrics and event logs so you can track token usage, costs, session activity, and tool calls across your organization.
Getting Started
1. Enable Telemetry
The fastest way is to use the integration tile in the Oodle UI:
- Navigate to Settings → Integrations
- Open the AI Agent Observability section
- Click the Claude Code Observability tile
- Select an API key and follow the steps shown
The tile generates a ready-to-use configuration.
To persist settings across sessions and distribute
them to your team, add them to the managed settings
file (~/.claude/settings.json):
{
  "env": {
    "CLAUDE_CODE_ENABLE_TELEMETRY": "1",
    "OTEL_METRICS_EXPORTER": "otlp",
    "OTEL_LOGS_EXPORTER": "otlp",
    "OTEL_EXPORTER_OTLP_PROTOCOL": "http/protobuf",
    "OTEL_EXPORTER_OTLP_ENDPOINT": "https://<OTLP_ENDPOINT>",
    "OTEL_EXPORTER_OTLP_HEADERS": "X-API-KEY=<API_KEY>, X-OODLE-INSTANCE=<INSTANCE_ID>",
    "OTEL_EXPORTER_OTLP_METRICS_TEMPORALITY_PREFERENCE": "delta",
    "OTEL_LOG_USER_PROMPTS": "1",
    "OTEL_LOG_TOOL_DETAILS": "1",
    "OTEL_RESOURCE_ATTRIBUTES": "git.repository.name=my-repo,org.team.name=platform,org.department=engineering,org.cost_center=eng-123"
  }
}
Replace <OTLP_ENDPOINT>, <API_KEY>, and
<INSTANCE_ID> with values from the integration tile.
Alternative: Environment Variables
For quick testing you can export the variables directly in your shell:
export CLAUDE_CODE_ENABLE_TELEMETRY=1
export OTEL_METRICS_EXPORTER=otlp
export OTEL_LOGS_EXPORTER=otlp
export OTEL_EXPORTER_OTLP_PROTOCOL=http/protobuf
export OTEL_EXPORTER_OTLP_ENDPOINT=https://<OTLP_ENDPOINT>
export OTEL_EXPORTER_OTLP_HEADERS="X-API-KEY=<API_KEY>, X-OODLE-INSTANCE=<INSTANCE_ID>"
export OTEL_EXPORTER_OTLP_METRICS_TEMPORALITY_PREFERENCE=delta
export OTEL_LOG_USER_PROMPTS=1
export OTEL_LOG_TOOL_DETAILS=1

# Optional: resource attributes for team/repo breakdowns
export OTEL_RESOURCE_ATTRIBUTES="git.repository.name=my-repo,org.team.name=platform,org.department=engineering,org.cost_center=eng-123"
For faster feedback during initial setup, lower the export intervals:
export OTEL_METRIC_EXPORT_INTERVAL=10000
export OTEL_LOGS_EXPORT_INTERVAL=5000
2. Roll Out to Your Team
Commit the settings.json above to your dotfiles
repository or distribute it via your configuration
management tool so every developer picks up the
same settings.
3. Verify Data
Once telemetry starts flowing (metrics export every 60 s, events every 5 s by default), navigate to AI Assistants → Claude Code in the Oodle sidebar.
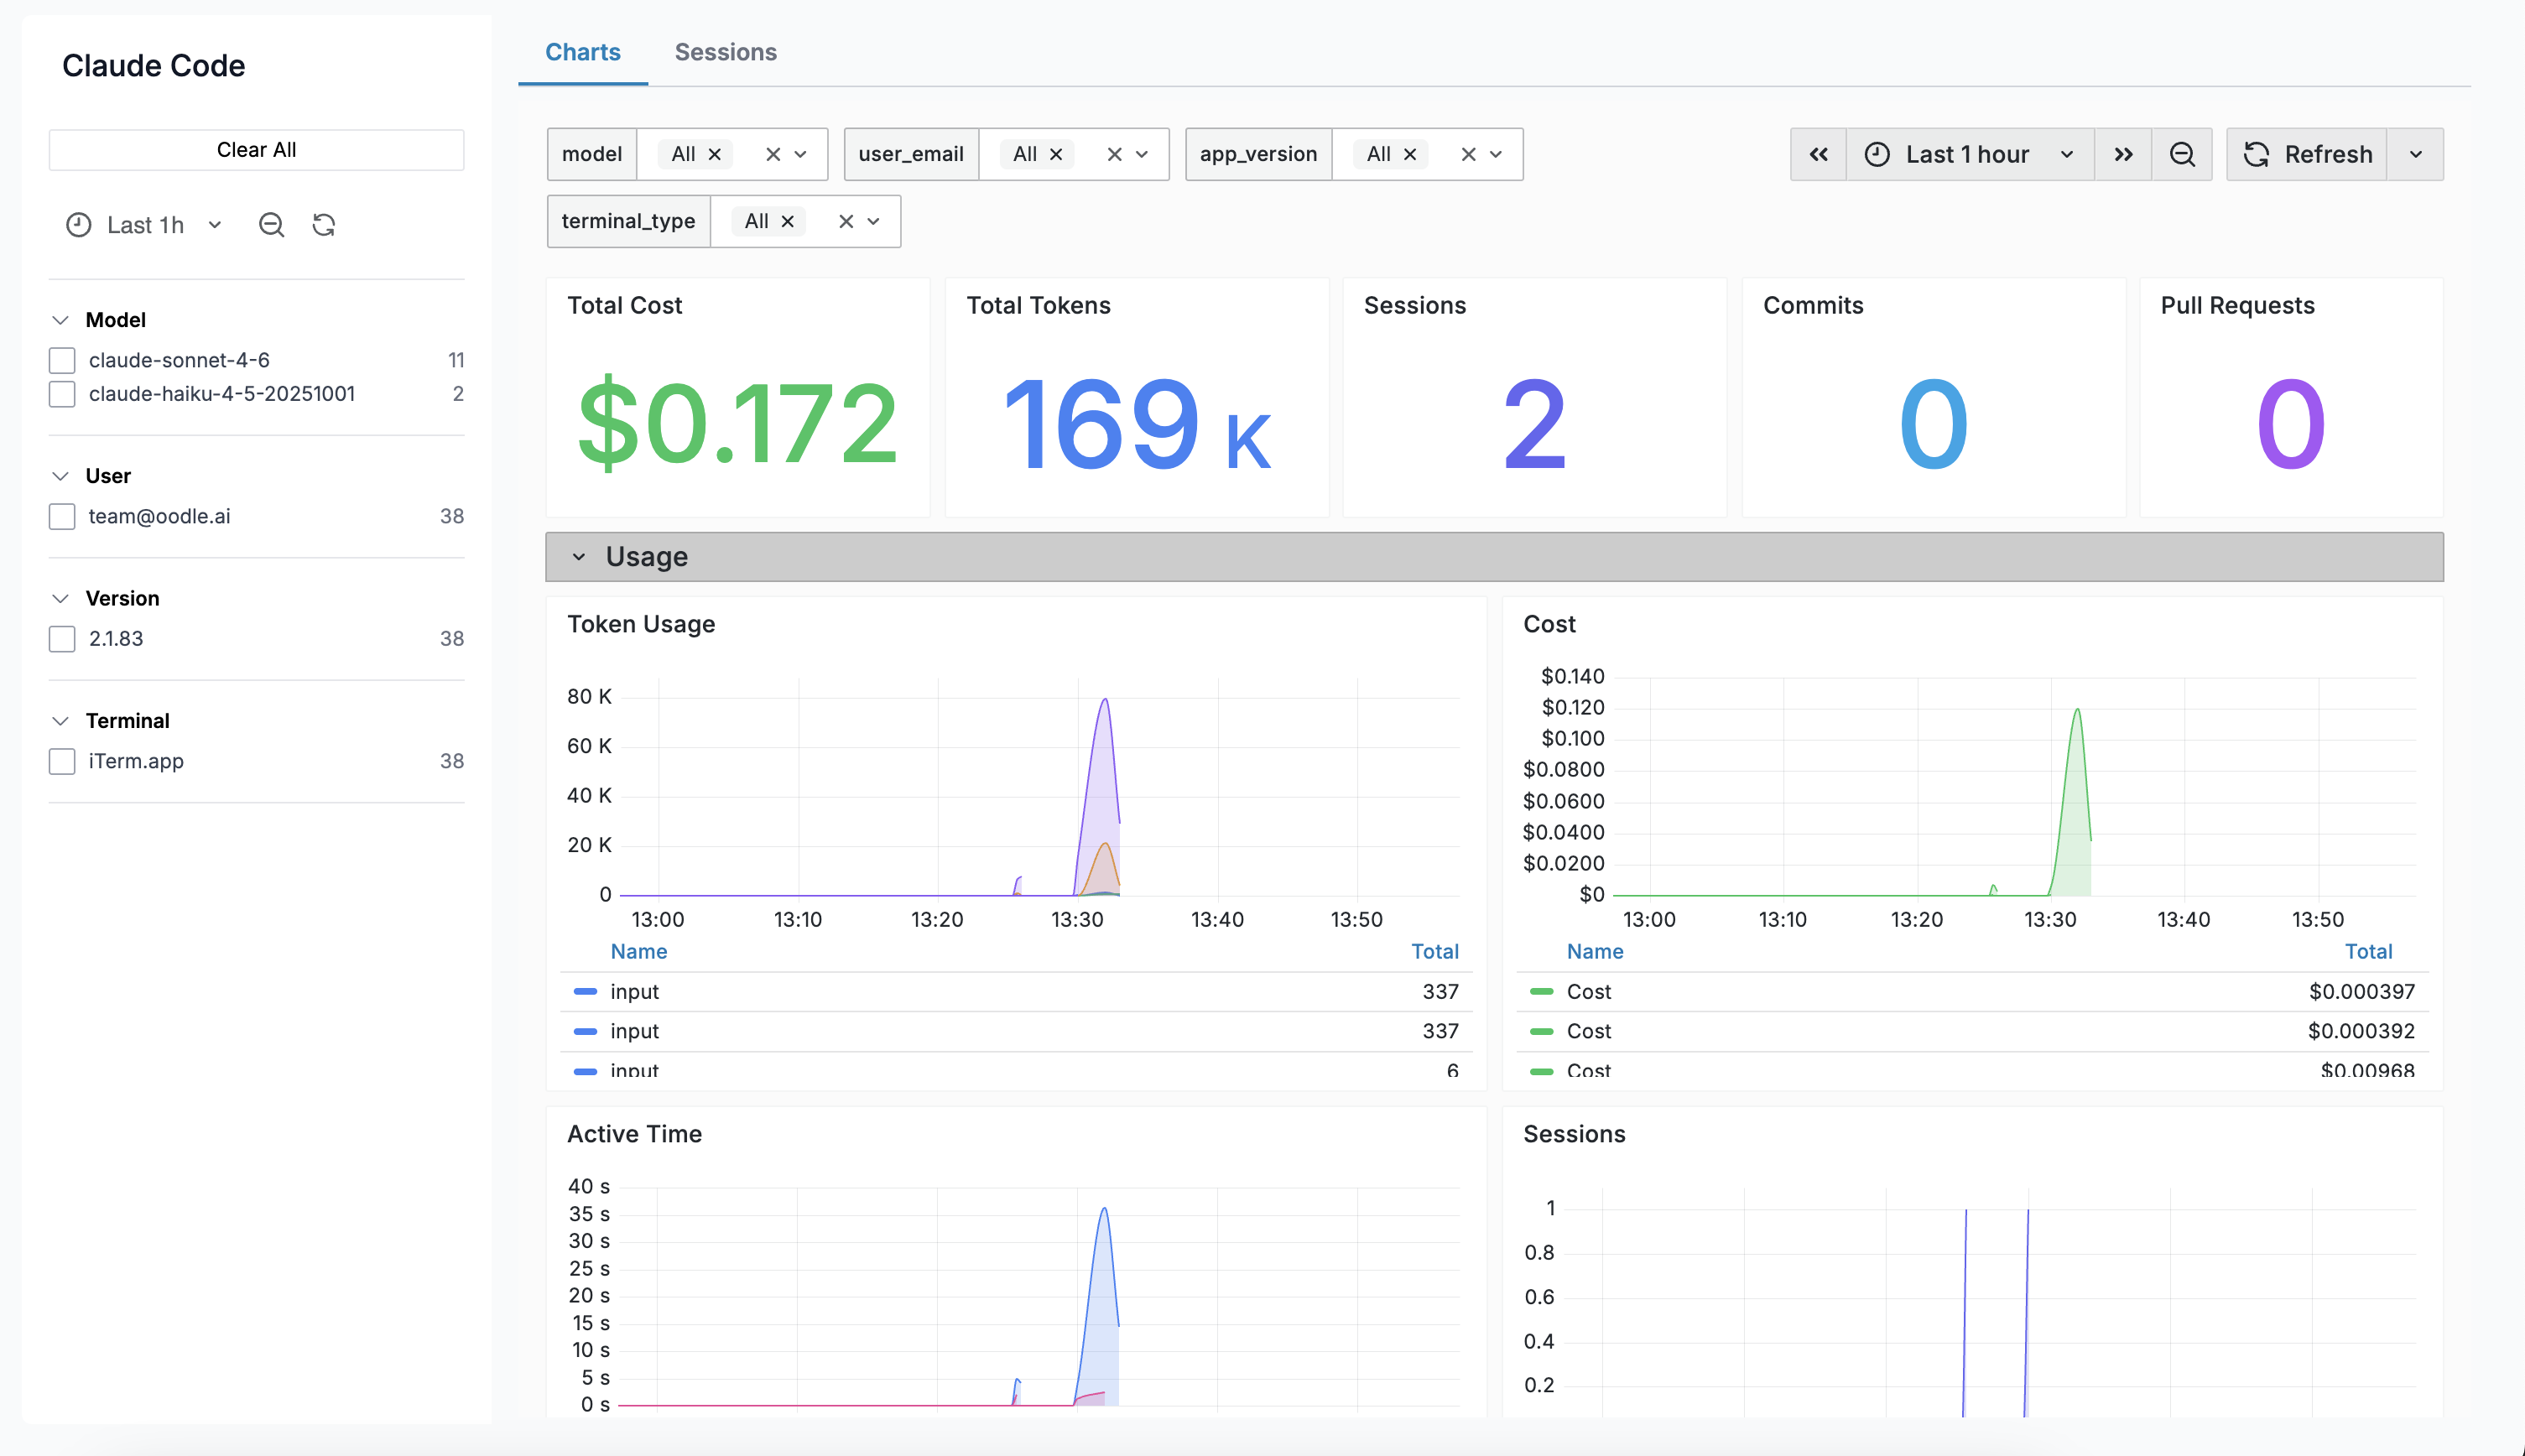
Charts Dashboard
The Charts tab embeds a Grafana dashboard with panels covering:
| Panel | Description |
|---|---|
| Total Cost | Aggregate estimated cost over the selected range |
| Total Tokens | Sum of input + output tokens |
| Sessions | Number of CLI sessions started |
| Commits | Commits created via Claude Code |
| Pull Requests | PRs created via Claude Code |
| Token Usage | Time series of input vs output tokens |
| Cost Over Time | Time series of estimated cost by model |
| Active Time | User interaction and CLI processing time |
| Lines of Code | Lines added vs removed |
| Tool Calls | Tool invocations over time |
| API Requests | API calls by model |
| Decisions | Tool accept / reject decisions |
Sessions
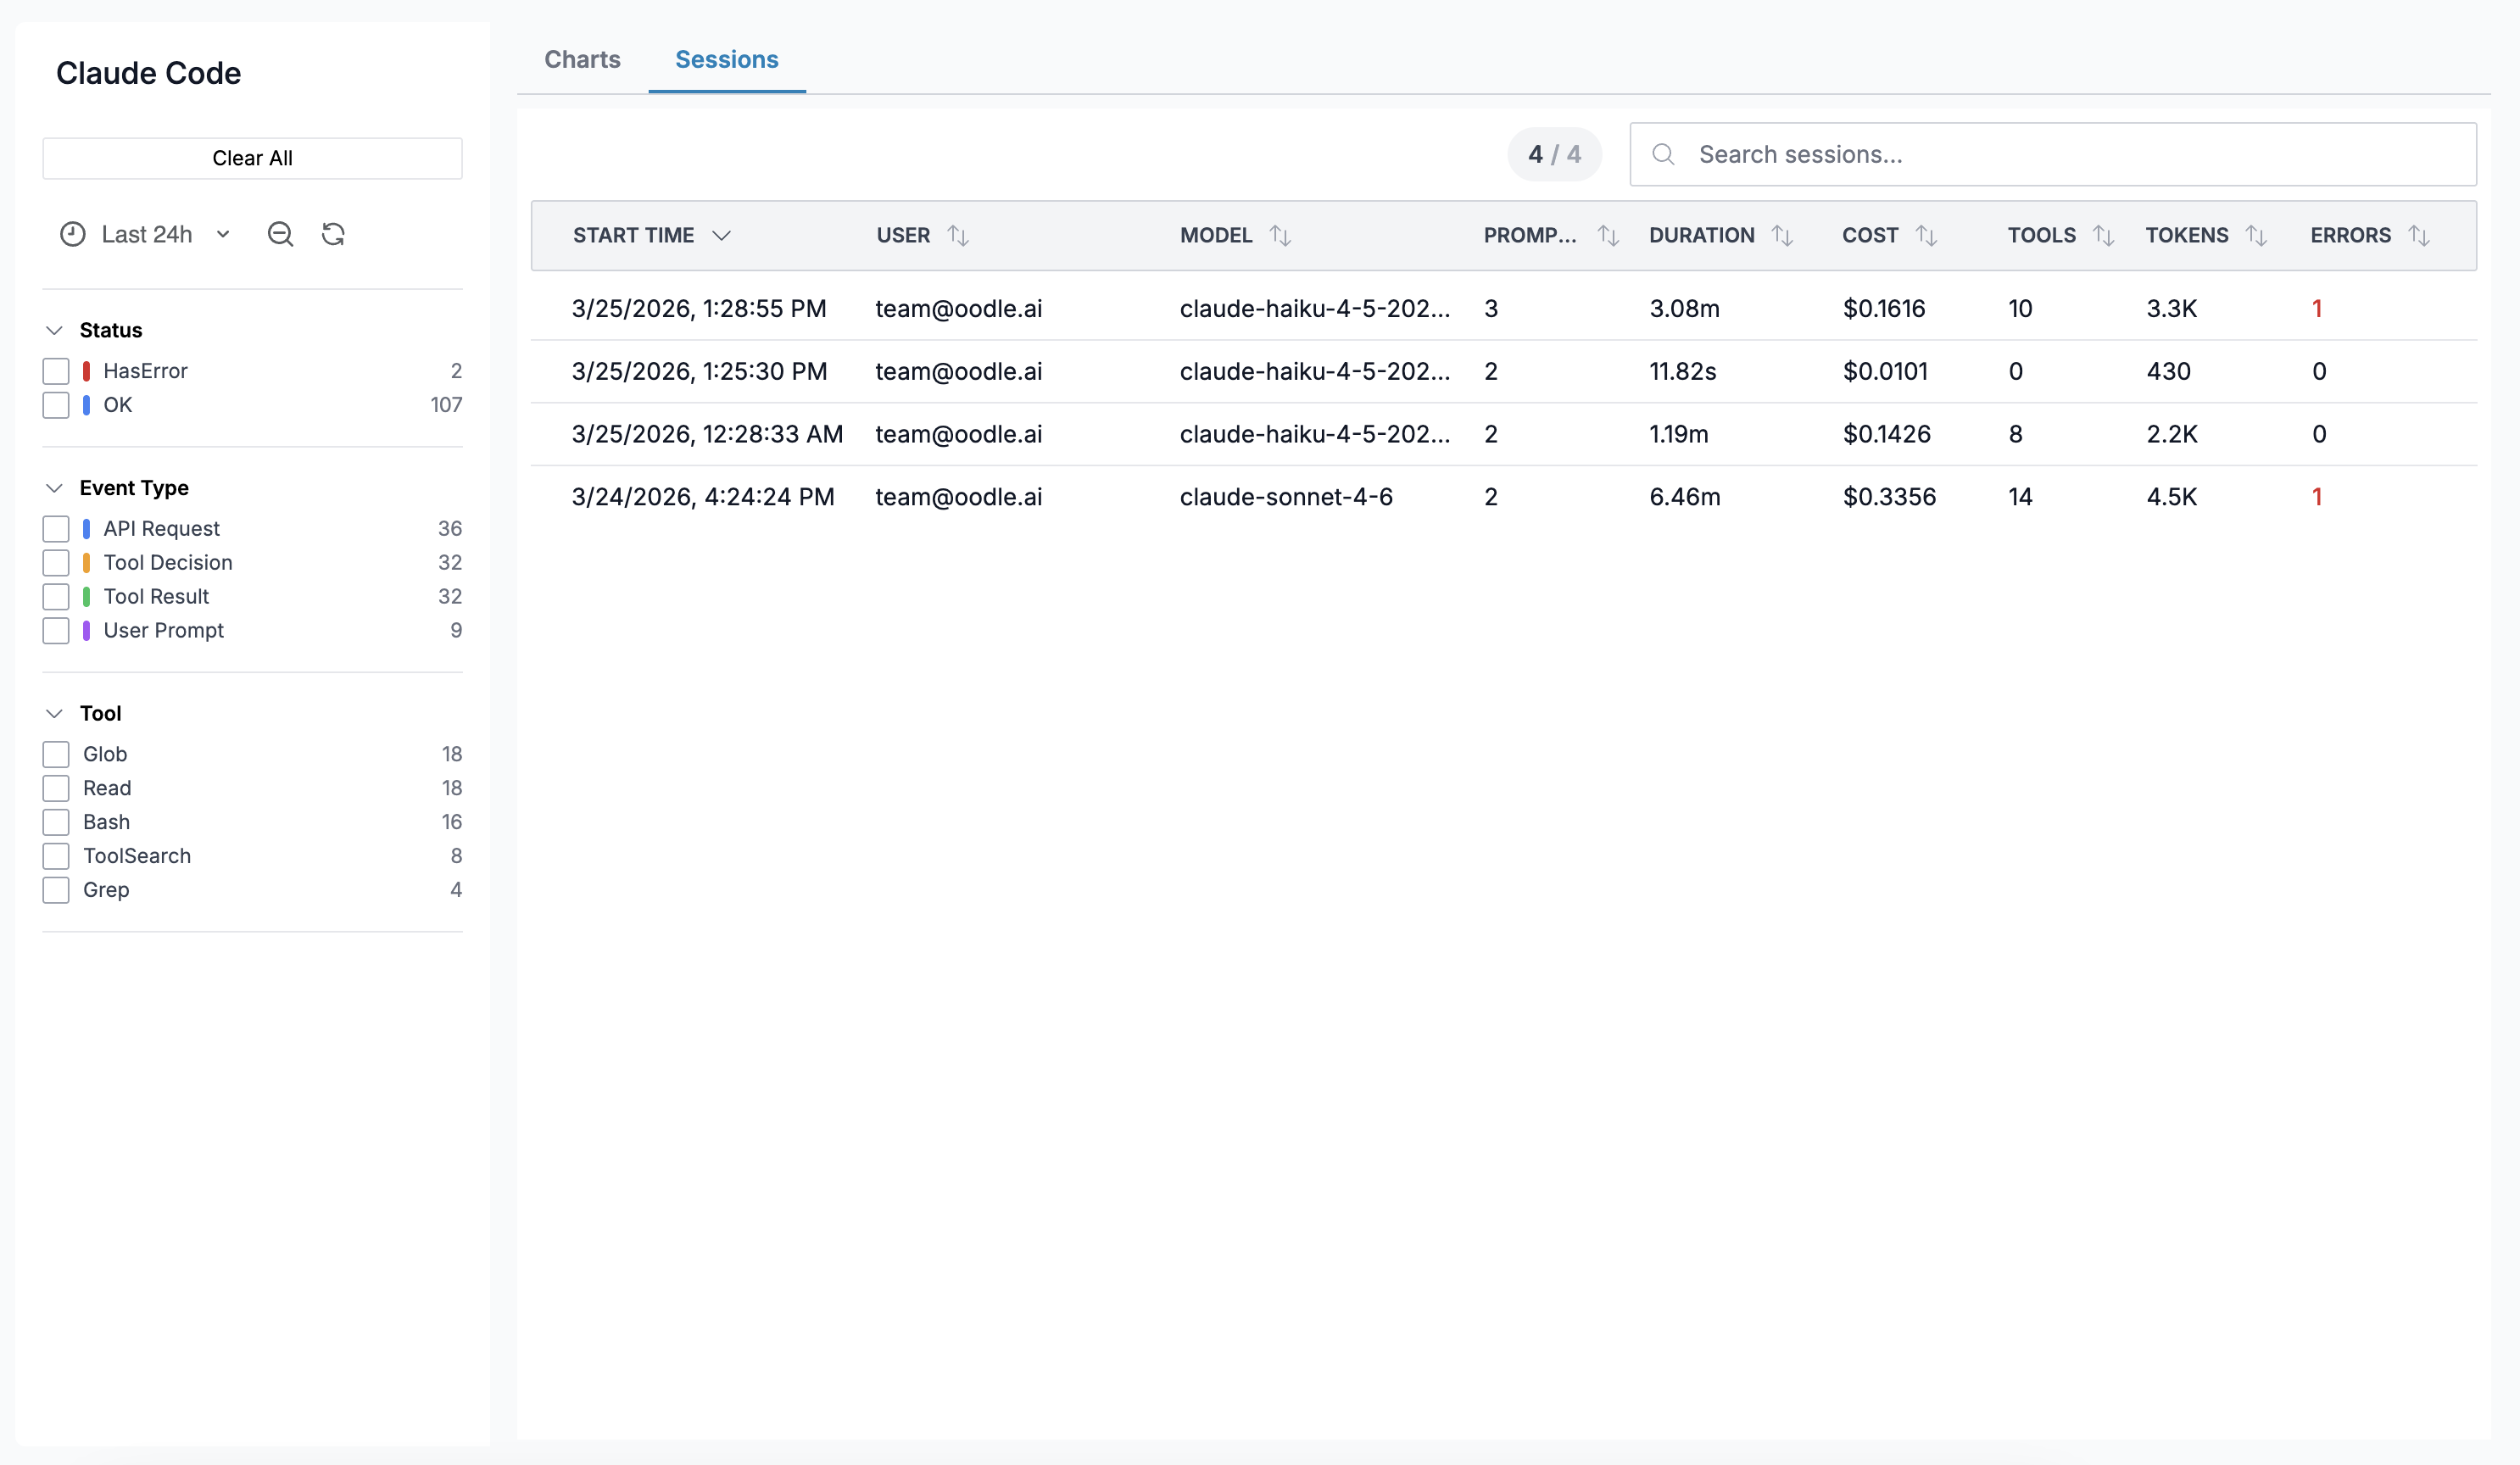
The Sessions tab shows individual Claude Code sessions:
| Column | Description |
|---|---|
| Start Time | When the session began |
| User | Email of the developer |
| Model | Primary model used |
| Prompts | Number of user prompts |
| Duration | Wall-clock duration |
| Cost | Total estimated cost |
| Tools | Number of tool calls |
| Tokens | Total tokens (input + output) |
| Errors | Count of errors |
Click any row to open a Session Detail drawer showing a turn-by-turn timeline of every event.
Session Detail Drawer
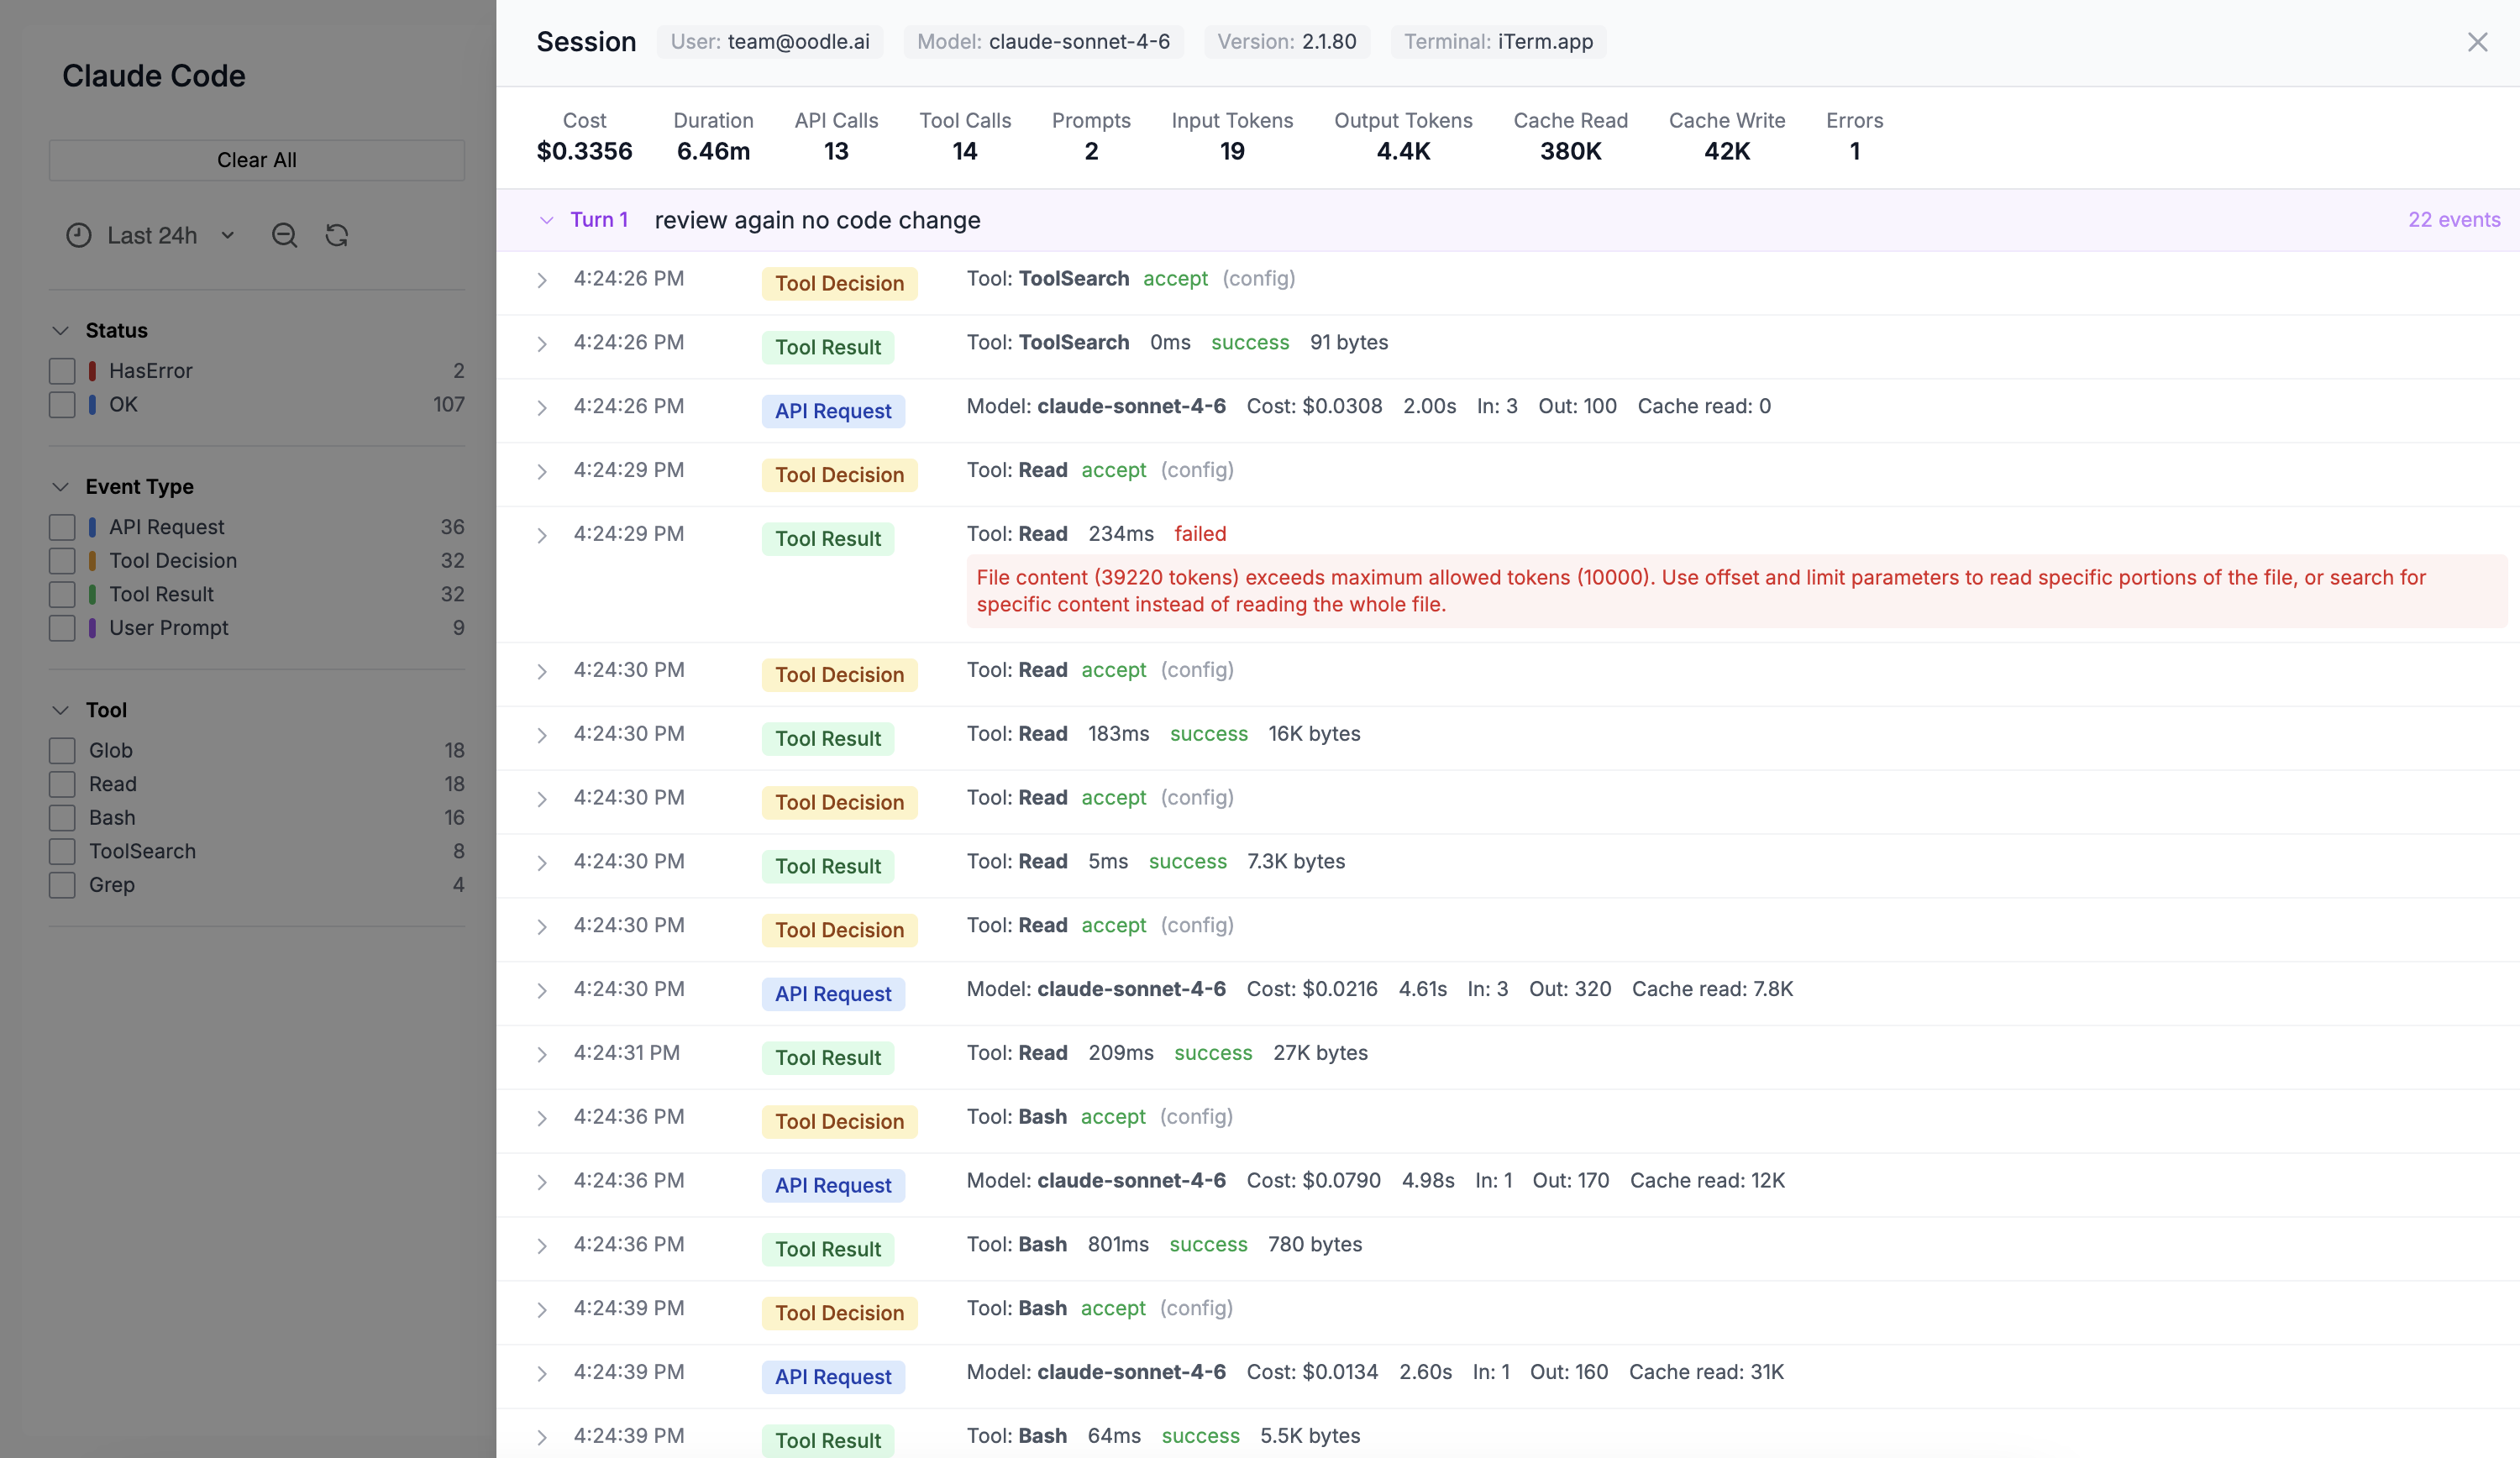
The drawer displays:
- Session metadata — user, model, app version, terminal type
- Aggregated stats — total cost, tokens, tool calls, errors, duration
- Turn-by-turn timeline — each turn is collapsible and shows the user prompt followed by individual events (API requests, tool calls, decisions). Every event row is expandable to reveal the full raw JSON payload.
What Gets Collected
Metrics
Claude Code exports the following as OpenTelemetry metrics (delta temporality):
| Metric | Labels | Description |
|---|---|---|
claude_code_token_usage | type, model | Token count by type (input, output, cache_read, cache_creation) |
claude_code_cost_usage | model | Estimated cost in USD |
claude_code_session_count | — | Sessions started |
claude_code_active_time | type | User and CLI active time |
claude_code_lines_of_code | type | Lines added / removed |
claude_code_num_commits | — | Commits created |
claude_code_pull_request_count | — | Pull requests created |
claude_code_tool_call_count | tool_name | Tool invocations |
claude_code_api_request_count | model | API calls by model |
claude_code_decision | type | Accept / reject decisions |
Events (Logs)
Events are exported via the OpenTelemetry logs
protocol. Each event has a log.attributes.event_type
field:
| Event Type | Key Attributes |
|---|---|
claude_code.user_prompt | Prompt text (opt-in), character count |
claude_code.api_request | Model, cost, input/output tokens, cache tokens, duration |
claude_code.tool_result | Tool name, success, duration |
claude_code.tool_use_decision | Decision (accept/reject), source |
Events are grouped by session_id to reconstruct the
turn-by-turn timeline on the Sessions tab.
Multi-team Organization Support
Organizations with multiple teams or departments can add custom resource attributes to segment telemetry by repository, team, department, or cost center.
Recommended Attributes
| Attribute | Purpose | Example |
|---|---|---|
git.repository.name | Per-repository breakdowns | my-service |
org.team.name | Team-level filtering | platform |
org.department | Department or business unit | engineering |
org.cost_center | Charge-back / cost allocation | eng-123 |
Configuration
Set OTEL_RESOURCE_ATTRIBUTES as a comma-separated list of
key=value pairs:
export OTEL_RESOURCE_ATTRIBUTES="git.repository.name=my-repo,org.team.name=platform,org.department=engineering,org.cost_center=eng-123"
Or add it to your managed settings file (.claude/settings.json):
{
  "env": {
    "OTEL_RESOURCE_ATTRIBUTES": "git.repository.name=my-repo,org.team.name=platform,org.department=engineering,org.cost_center=eng-123"
  }
}
Values must not contain spaces. Use underscores, camelCase, or percent-encoding for special characters. See the Claude Code docs for the full specification.
Once set, these attributes appear on all metrics and events, allowing you to:
- Filter dashboards by team or department
- Track costs per cost center
- Create per-repository usage reports
- Set up team-specific alerts
Further Reading
Support
If you need assistance or have any questions, please reach out to us through:
- Email at [email protected]