OpenAI Codex
OpenAI Codex has native OpenTelemetry support. Once enabled, Oodle collects metrics and event logs so you can track token usage, session activity, tool calls, and WebSocket request patterns across your organization.
Getting Started
1. Enable Telemetry
The fastest way is to use the integration tile in the Oodle UI:
- Navigate to Settings → Integrations
- Open the AI Agent Observability section
- Click the Codex Observability tile
- Select an API key and follow the steps shown
Alternatively, add the following to your Codex
configuration file (~/.codex/config.toml):
#:schema https://developers.openai.com/codex/config-schema.json

[otel]
environment = "production"
log_user_prompt = true

exporter = { otlp-http = {
  endpoint = "https://<LOGS_ENDPOINT>/ingest/otel/v1/logs",
  protocol = "binary",
  headers = {
    "X-API-KEY" = "<API_KEY>",
    "X-OODLE-INSTANCE" = "<INSTANCE_ID>",
  },
}}

metrics_exporter = { otlp-http = {
  endpoint = "https://<METRICS_ENDPOINT>/v2/otlp/metrics/<INSTANCE_ID>",
  protocol = "binary",
  headers = {
    "X-API-KEY" = "<API_KEY>",
    "X-OODLE-INSTANCE" = "<INSTANCE_ID>",
  },
}}
Replace <METRICS_ENDPOINT>, <API_KEY>, and
<INSTANCE_ID> with values from the integration tile.
The integration tile in the Oodle UI generates a
ready-to-copy config.toml with the correct
endpoints and API key pre-filled.
Alternative: Environment Variables
For quick testing you can export the standard OpenTelemetry variables directly in your shell:
export OTEL_EXPORTER_OTLP_PROTOCOL=http/protobuf
export OTEL_EXPORTER_OTLP_METRICS_ENDPOINT=https://<METRICS_ENDPOINT>/v2/otlp/metrics/<INSTANCE_ID>
export OTEL_EXPORTER_OTLP_LOGS_ENDPOINT=https://<LOGS_ENDPOINT>/ingest/otel/v1/logs
export OTEL_EXPORTER_OTLP_HEADERS="X-API-KEY=<API_KEY>, X-OODLE-INSTANCE=<INSTANCE_ID>"
export OTEL_LOG_USER_PROMPTS=1
export OTEL_METRIC_EXPORT_INTERVAL=10000
export OTEL_LOGS_EXPORT_INTERVAL=5000
2. Roll Out to Your Team
Commit the config.toml above to your dotfiles
repository or place it in each developer's
~/.codex/ directory via your configuration
management tool.
3. Verify Data
Once telemetry starts flowing, navigate to AI Assistants → Codex in the Oodle sidebar.
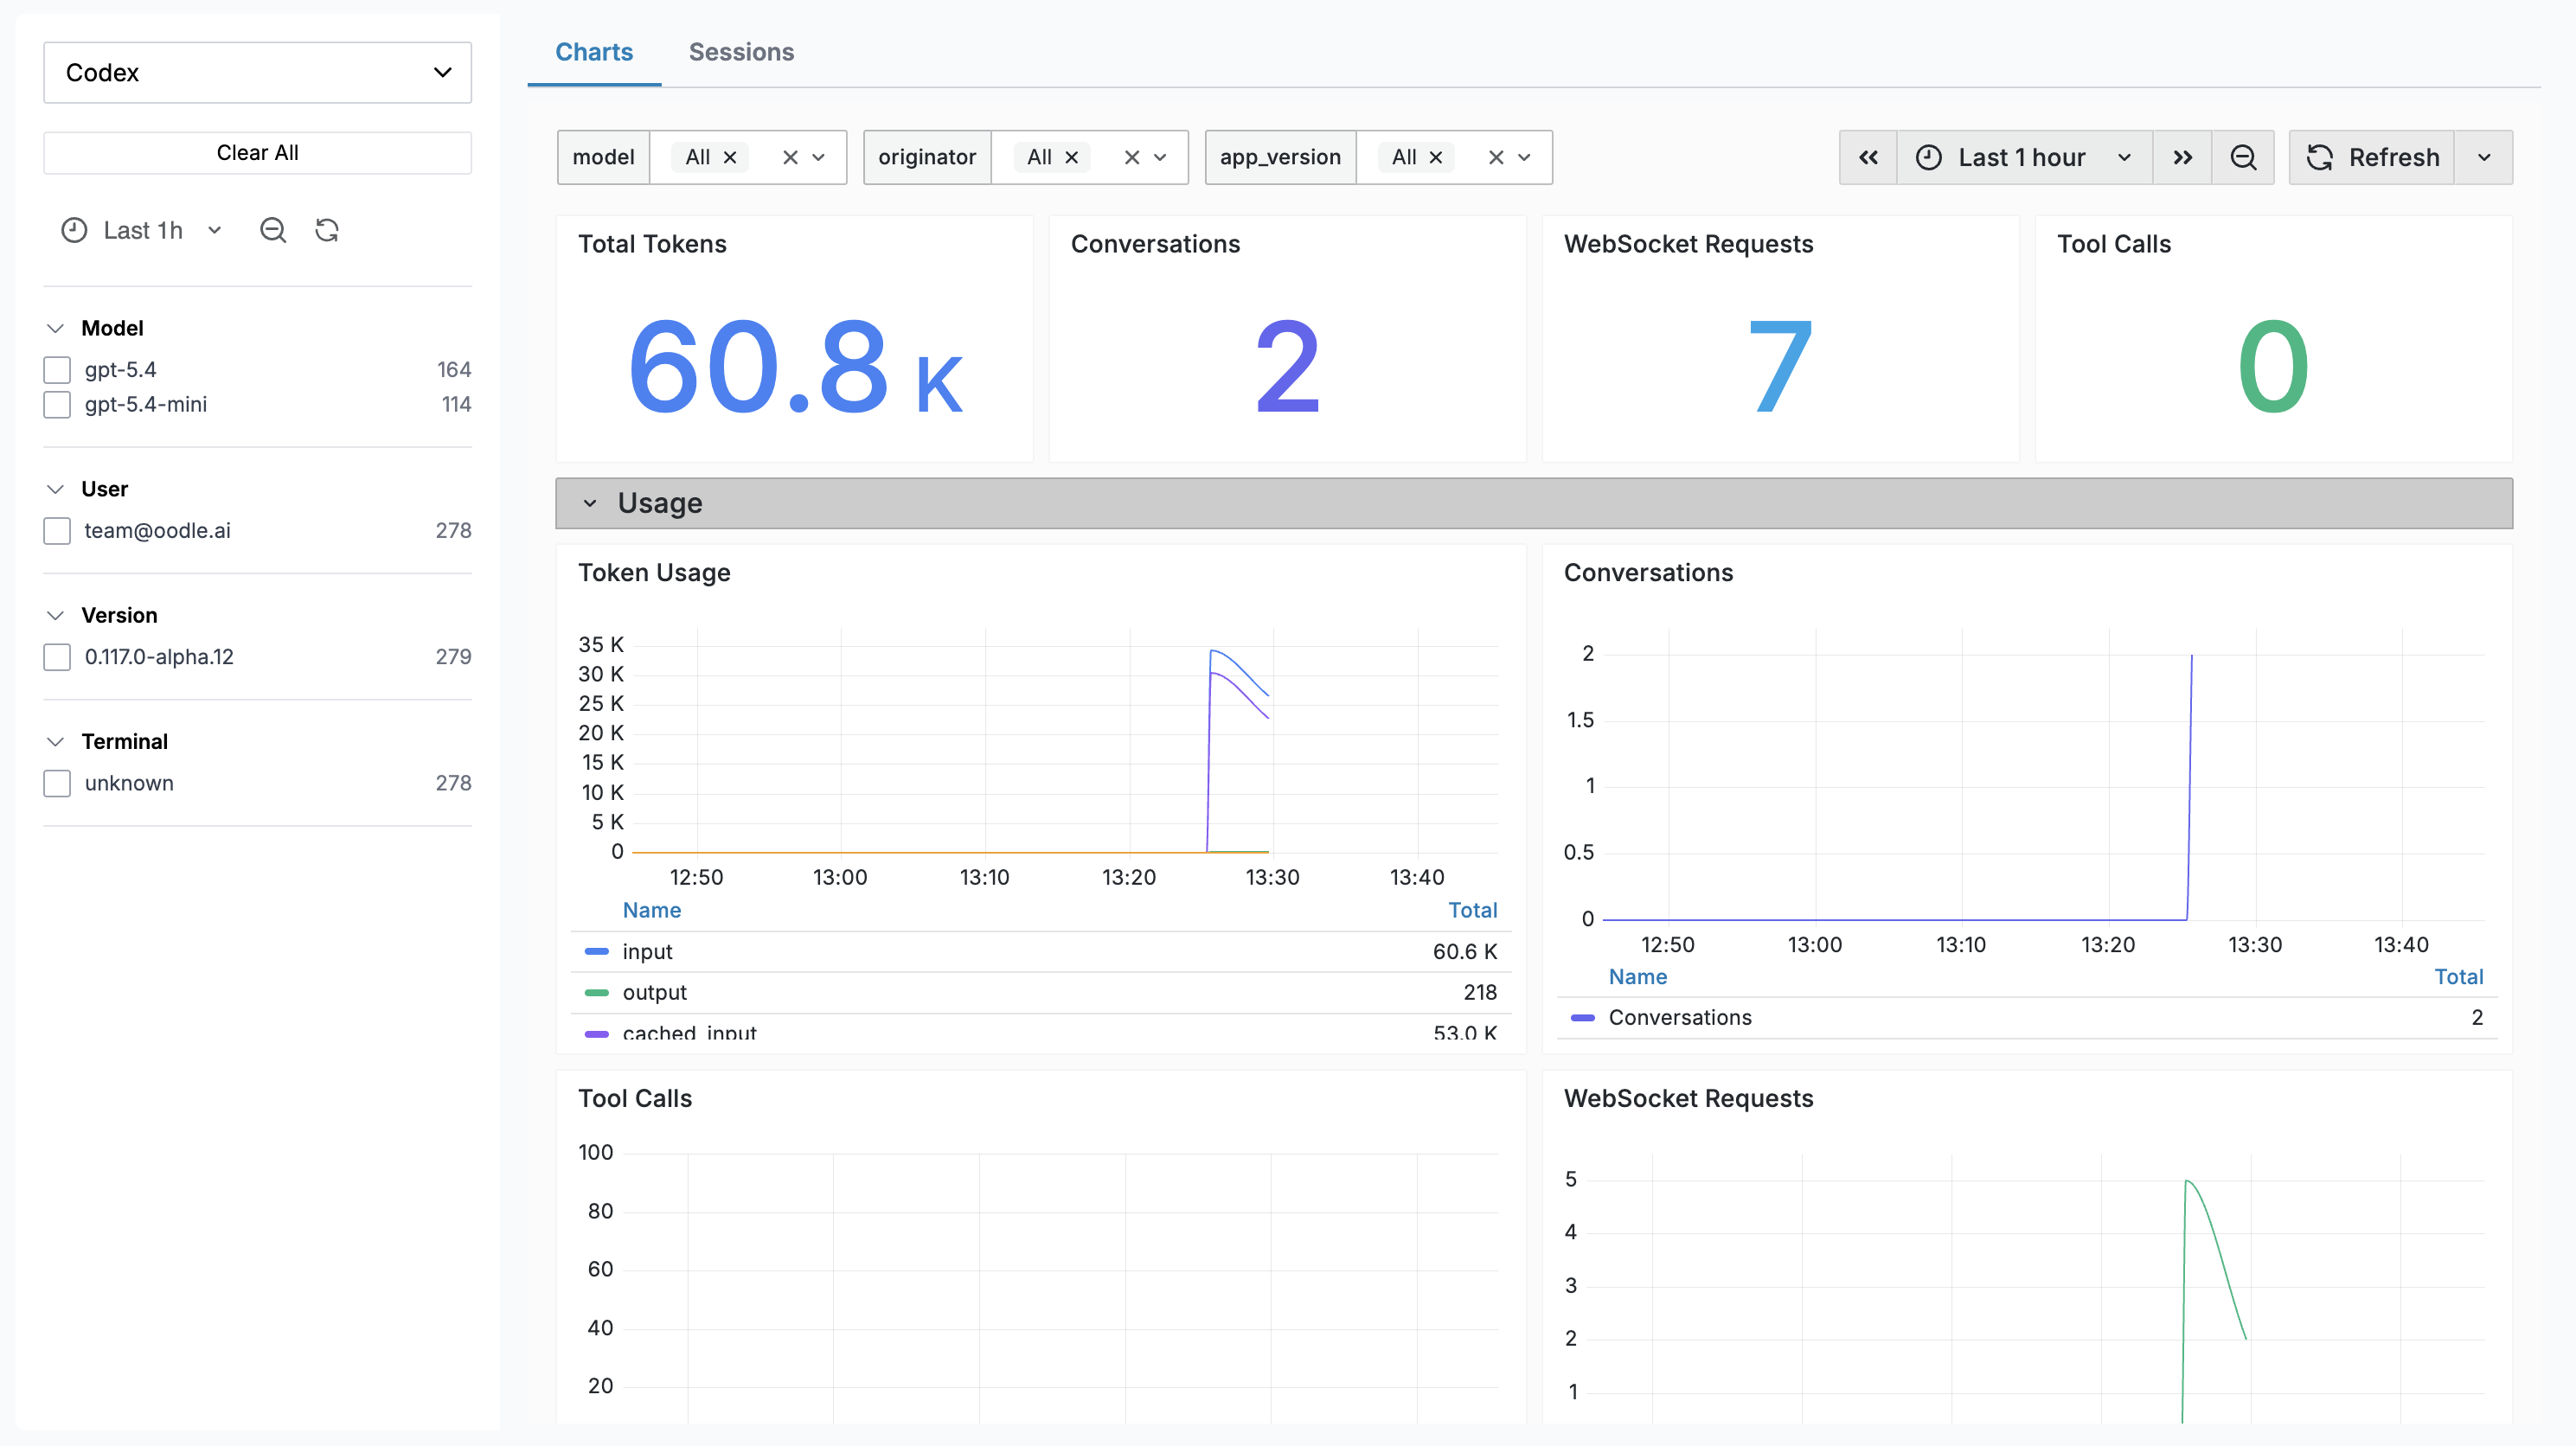
Charts Dashboard
The Charts tab embeds a Grafana dashboard with panels covering:
| Panel | Description |
|---|---|
| Total Tokens | Aggregate token usage over the selected range |
| Conversations | Number of Codex conversations started |
| WebSocket Requests | Total WebSocket requests made |
| Tool Calls | Total tool invocations |
| Token Usage | Time series by token type (input, output, cached, reasoning) |
| Conversations Over Time | Conversation start trends |
| Tool Call Activity | Tool invocations over time |
| WebSocket Requests | Success vs failure rates |
| Avg Turn E2E Duration | End-to-end latency per turn |
| Avg TTFT | Time to first token |
| Avg TTFM | Time to first message |
| Avg WS Event Duration | WebSocket event processing time |
| Startup Prewarm Duration | Agent startup prewarm latency |
| Shell Snapshot Duration | Shell snapshot capture latency |
Sessions
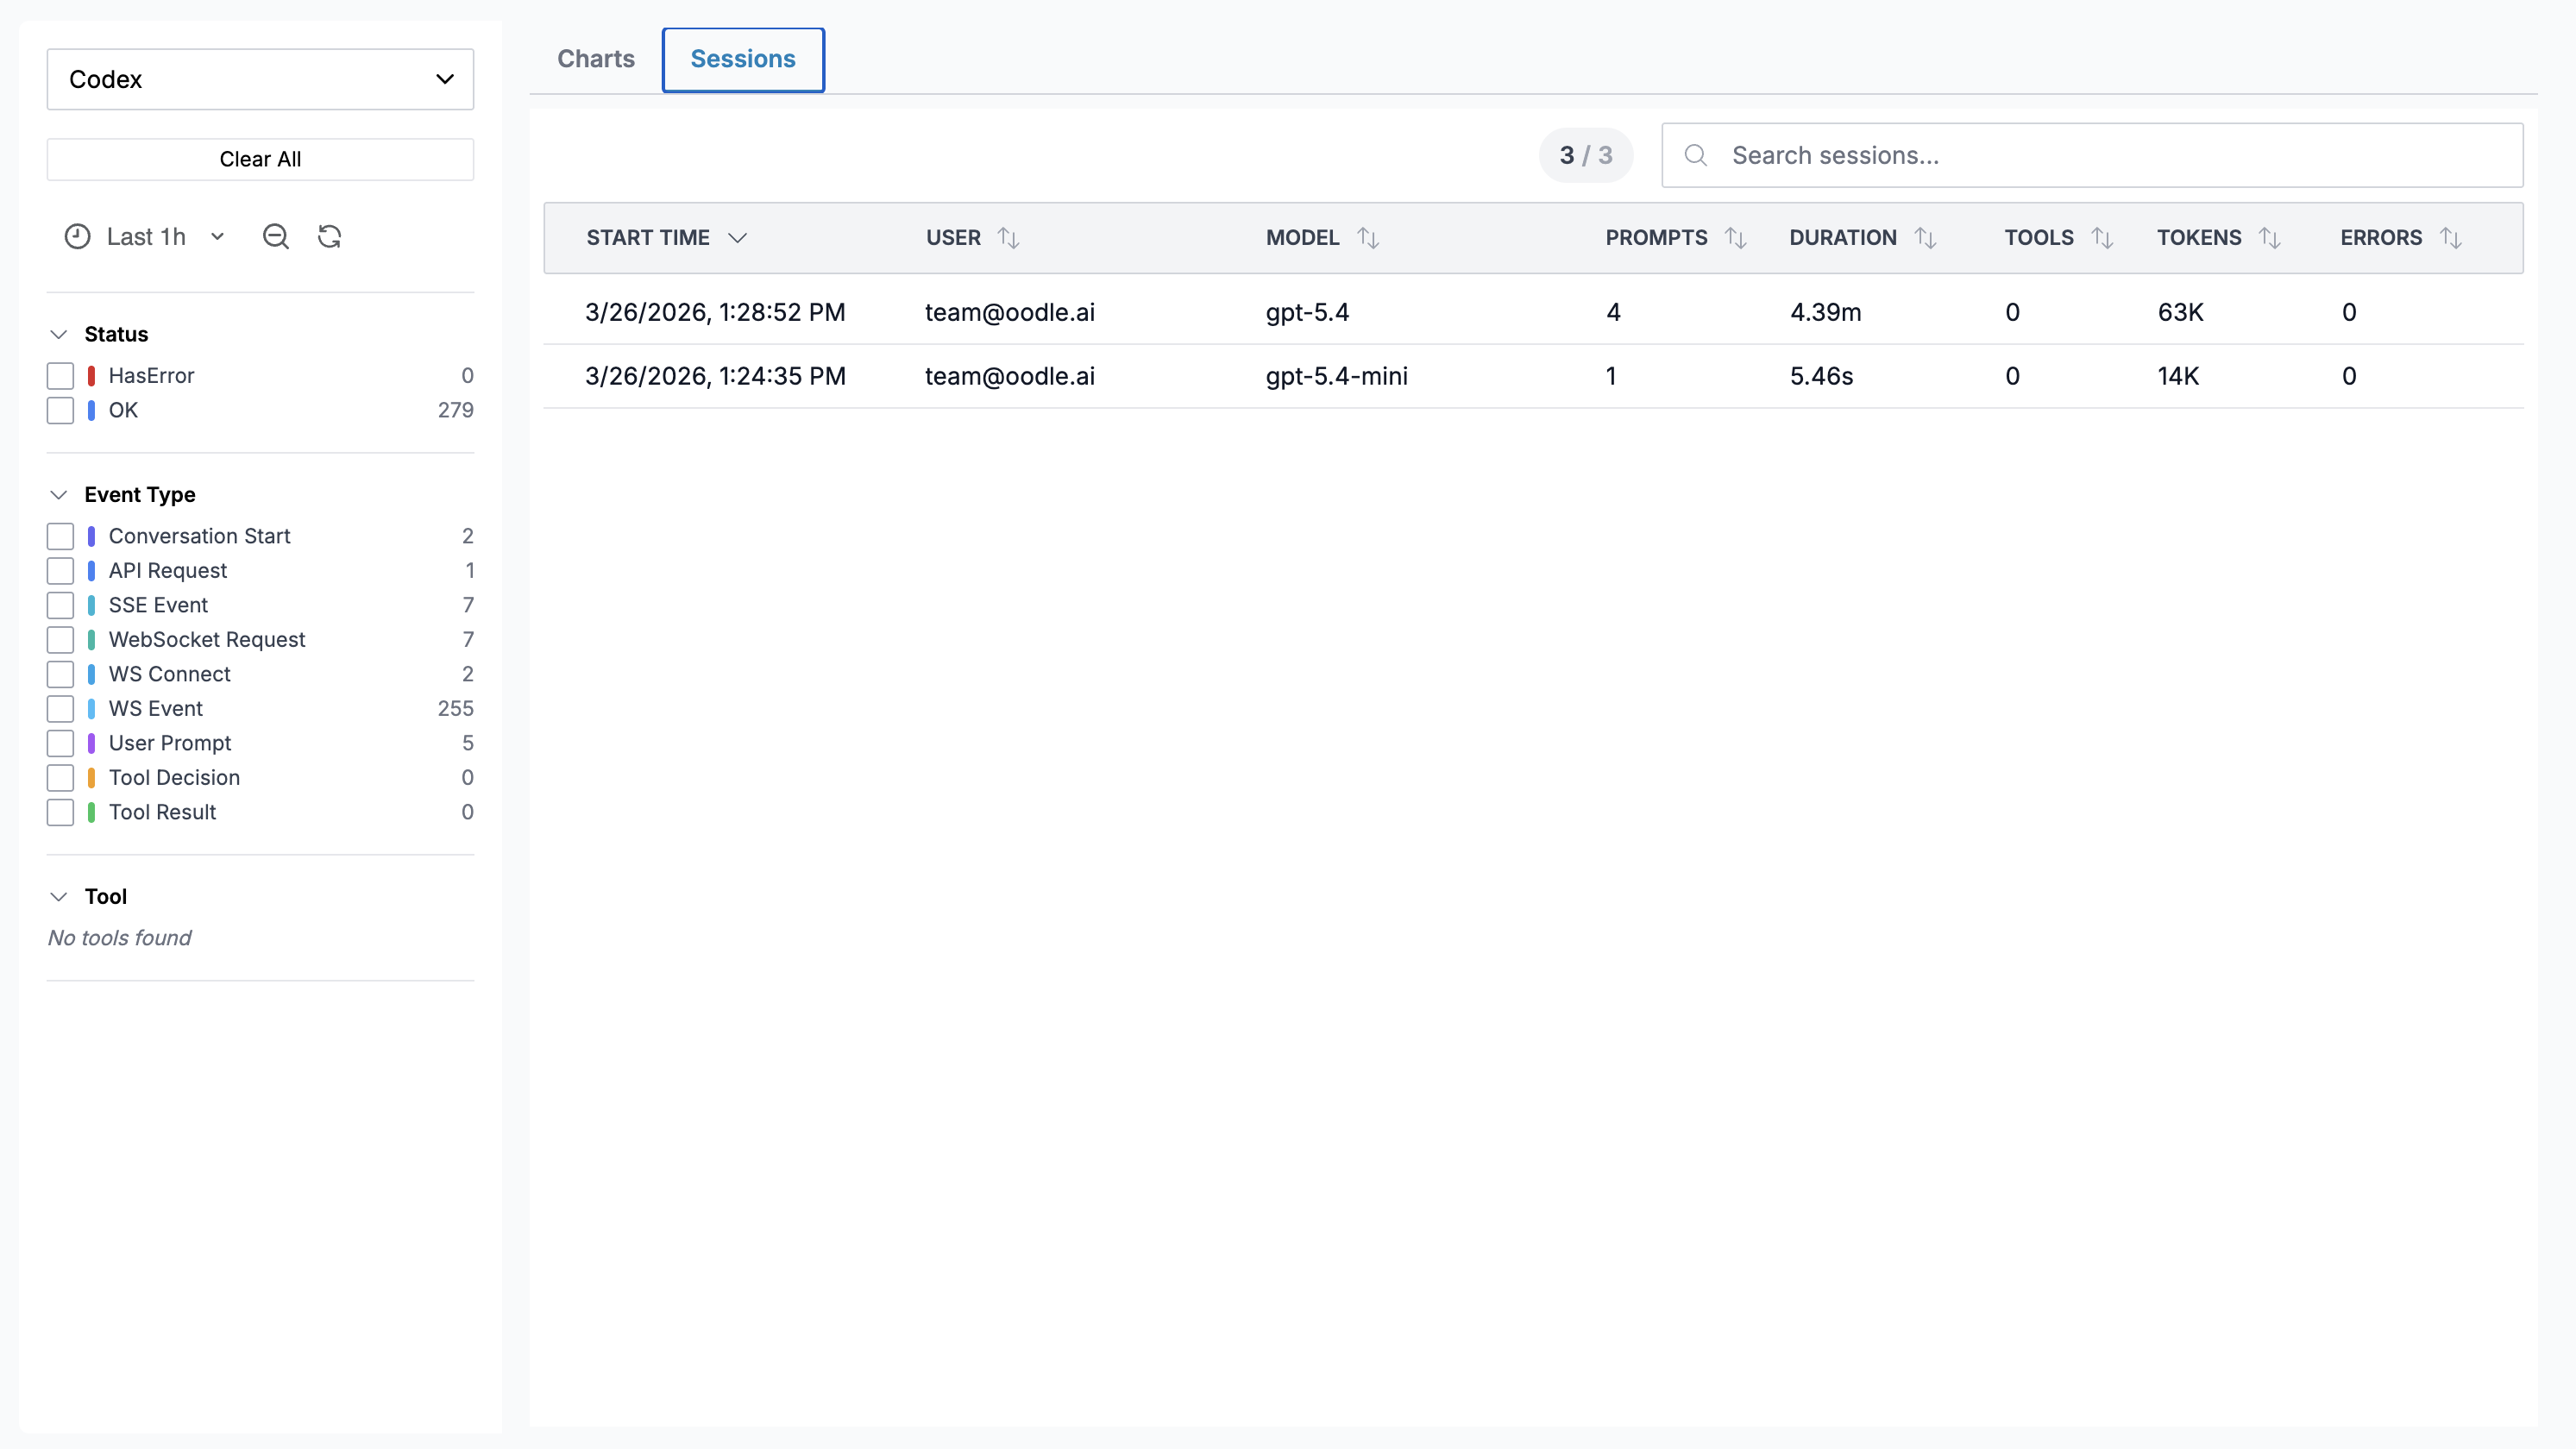
The Sessions tab shows individual Codex sessions:
| Column | Description |
|---|---|
| Start Time | When the session began |
| User | Email of the developer |
| Model | Primary model used |
| Prompts | Number of user prompts |
| Duration | Wall-clock duration |
| Tools | Number of tool calls |
| Tokens | Total tokens (input + output) |
| Errors | Count of errors |
Codex does not currently export cost data. The Cost column is hidden for Codex sessions.
Click any row to open a Session Detail drawer showing a turn-by-turn timeline of every event.
Session Detail Drawer
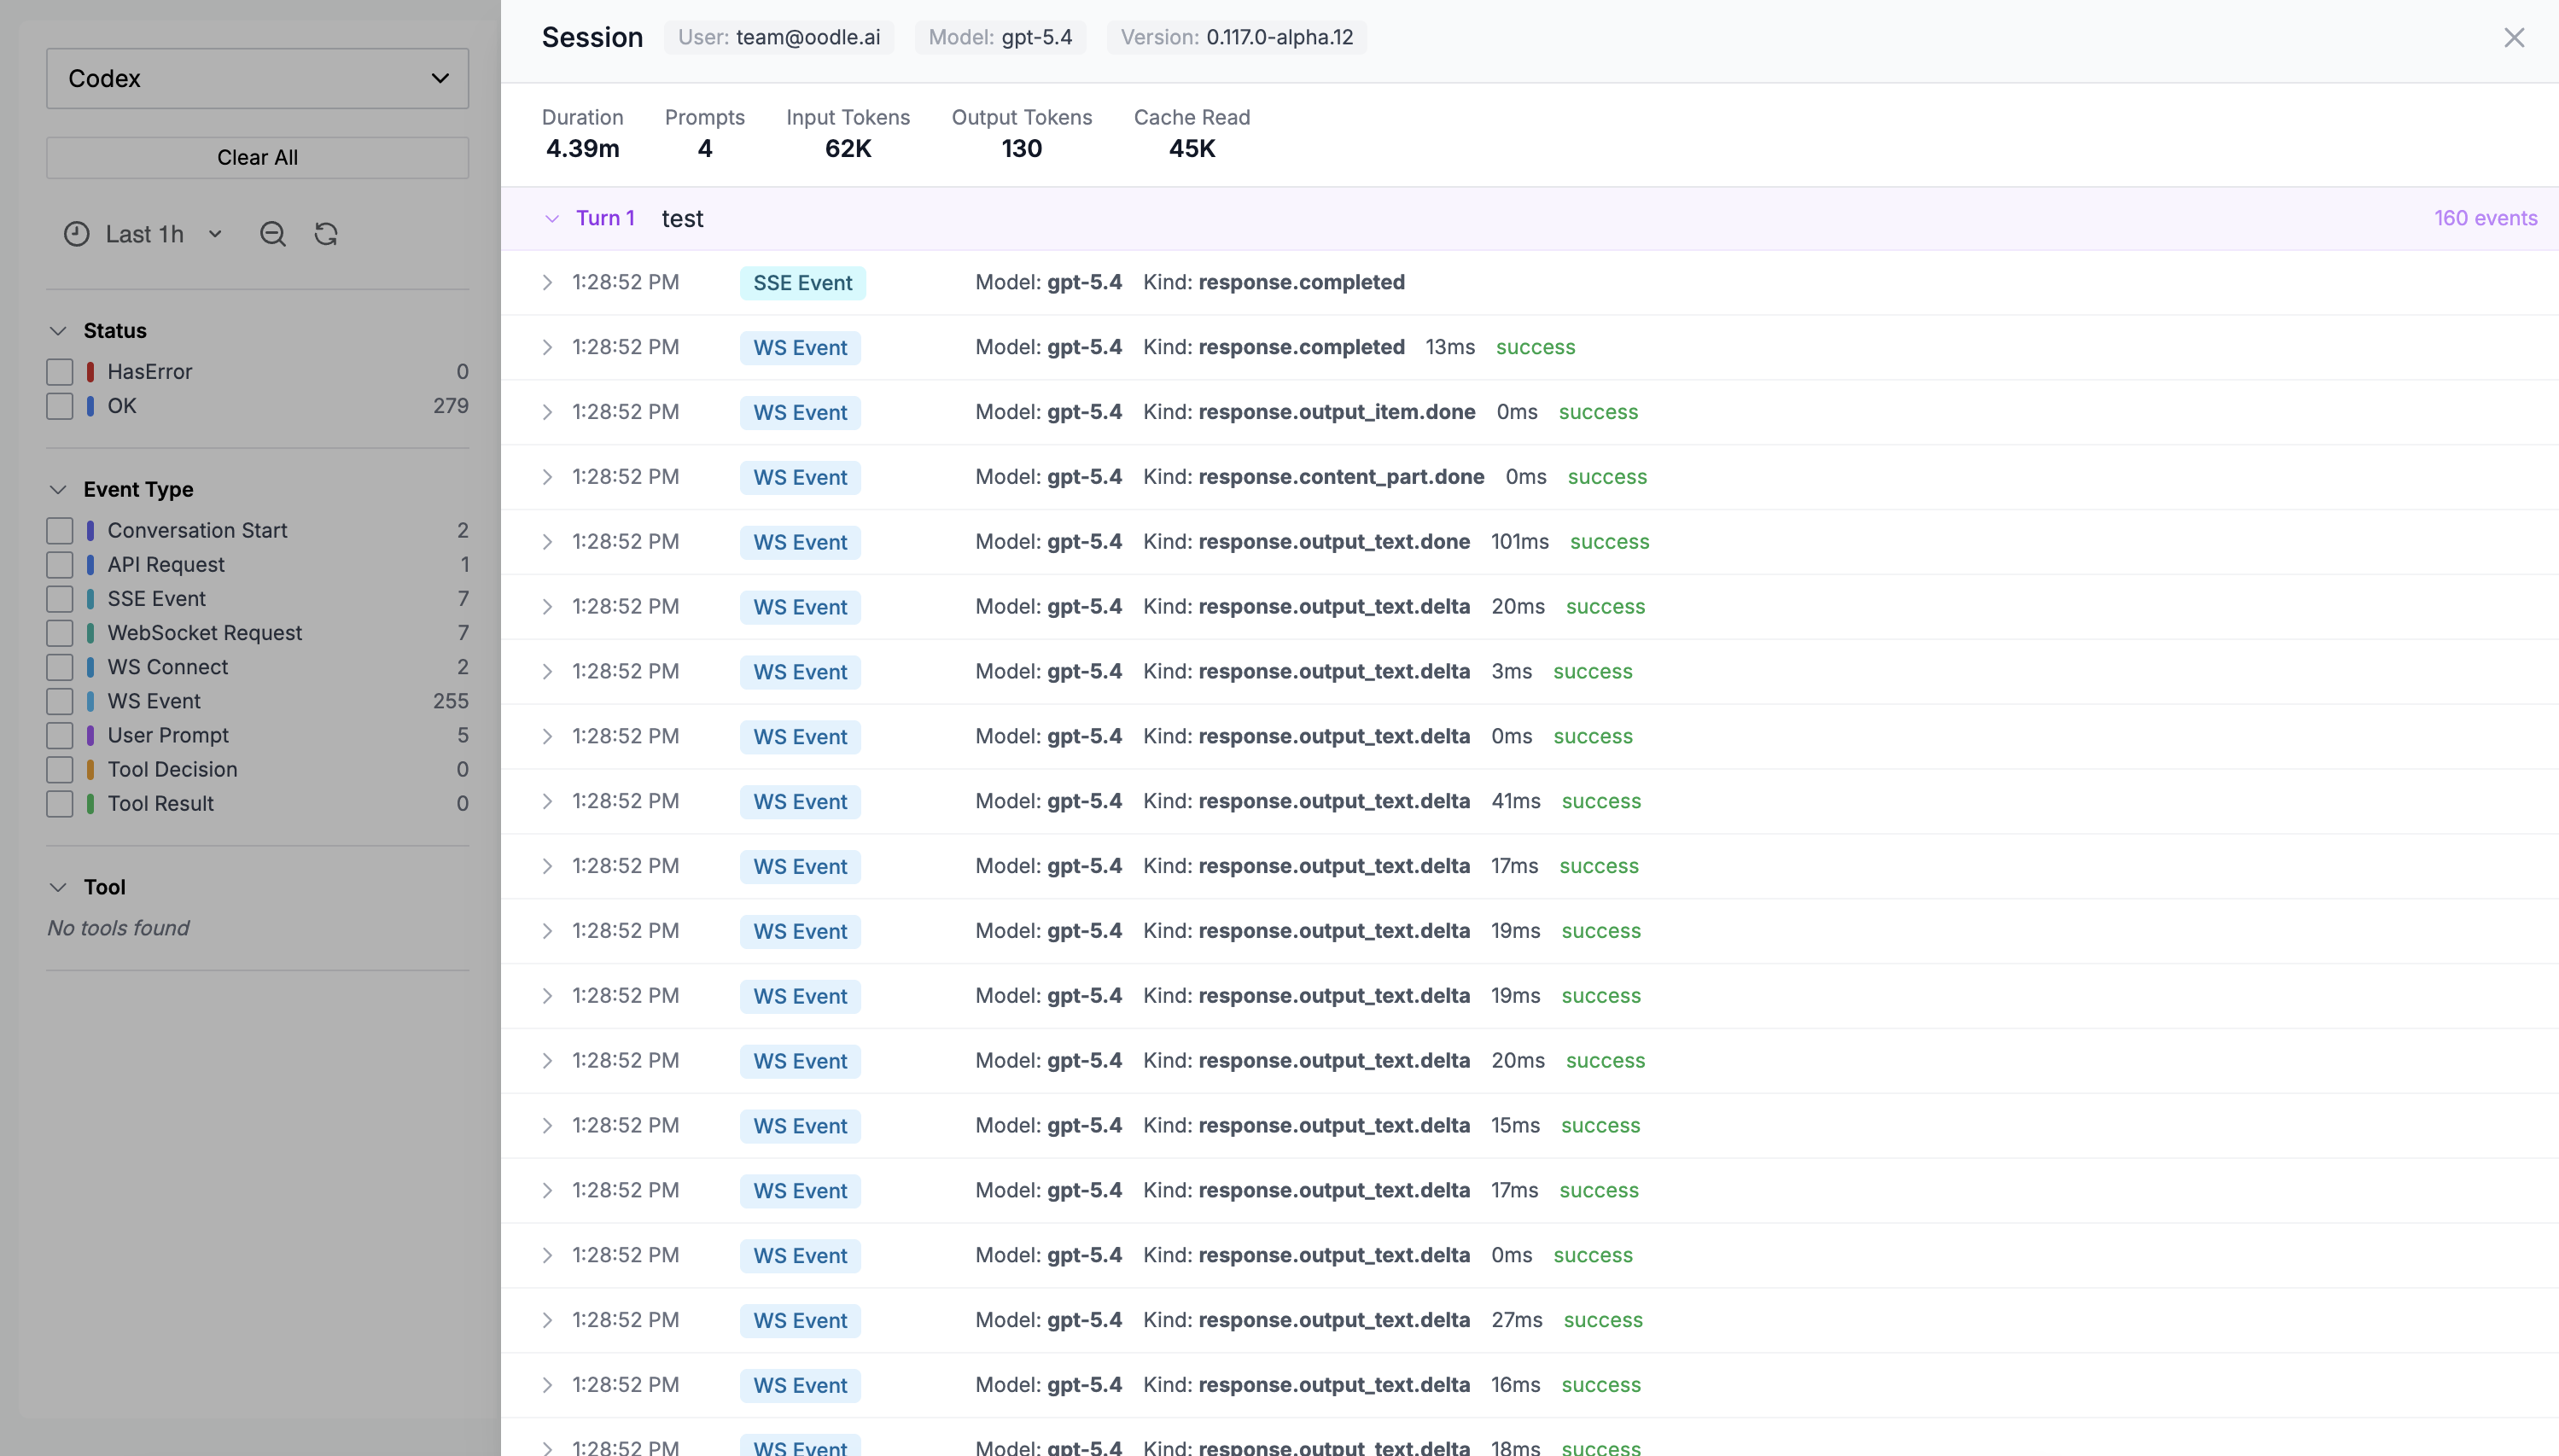
The drawer displays:
- Session metadata — user, model, app version
- Aggregated stats — tokens, tool calls, errors, duration (only populated fields are shown)
- Turn-by-turn timeline — each turn is collapsible and shows individual events (SSE events, WebSocket events, tool calls). Every event row is expandable to reveal the full raw JSON payload.
What Gets Collected
Metrics
Codex exports the following as OpenTelemetry metrics (delta temporality):
| Metric | Labels | Description |
|---|---|---|
codex_turn_token_usage | model, token_type, originator | Token count by type (input, output, cached, reasoning) |
codex_thread_started | model, originator | Conversations started |
codex_turn_tool_call | model, originator | Tool invocations |
codex_websocket_request | model, success | WebSocket API requests |
codex_turn_e2e_duration_ms | model | End-to-end turn latency |
codex_turn_ttft_ms | model | Time to first token |
codex_turn_ttfm_ms | model | Time to first message |
codex_ws_event_duration_ms | model | WebSocket event processing time |
codex_startup_prewarm_duration_ms | — | Startup prewarm latency |
codex_shell_snapshot_duration_ms | — | Shell snapshot capture latency |
Events (Logs)
Events are exported via the OpenTelemetry logs
protocol. Each event has an
attributes.event.name field:
| Event Type | Key Attributes |
|---|---|
codex.conversation_starts | Conversation ID, model, user email |
codex.sse_event | Model, event kind, token counts, duration |
codex.websocket_event | Model, event kind, duration, success |
codex.websocket_request | Model, duration, success |
codex.websocket_connect | Model, duration |
codex.user_prompt | Prompt text, prompt length |
codex.tool_decision | Tool name, decision, source |
codex.tool_result | Tool name, success, duration, error |
Events are grouped by conversation.id to reconstruct
the turn-by-turn timeline on the Sessions tab.
Further Reading
Support
If you need assistance or have any questions, please reach out to us through:
- Email at [email protected]