Query Metrics
Query metrics from Oodle using the Prometheus-compatible HTTP API. This API supports both range queries (time series) and instant queries (point-in-time values).
Configuration
To query metrics from Oodle via HTTP, you'll need the following values:
OODLE_INSTANCE: Your Oodle instance ID. Go toSettingsicon ->API Keyspage in your Oodle UI to find out. (Oodle UI links: ap1, us1)OODLE_API_KEY: Your Oodle API key for authentication. Go toSettingsicon ->API Keysin your Oodle UI to choose an appropriate key. (Oodle UI links: ap1, us1)
Steps
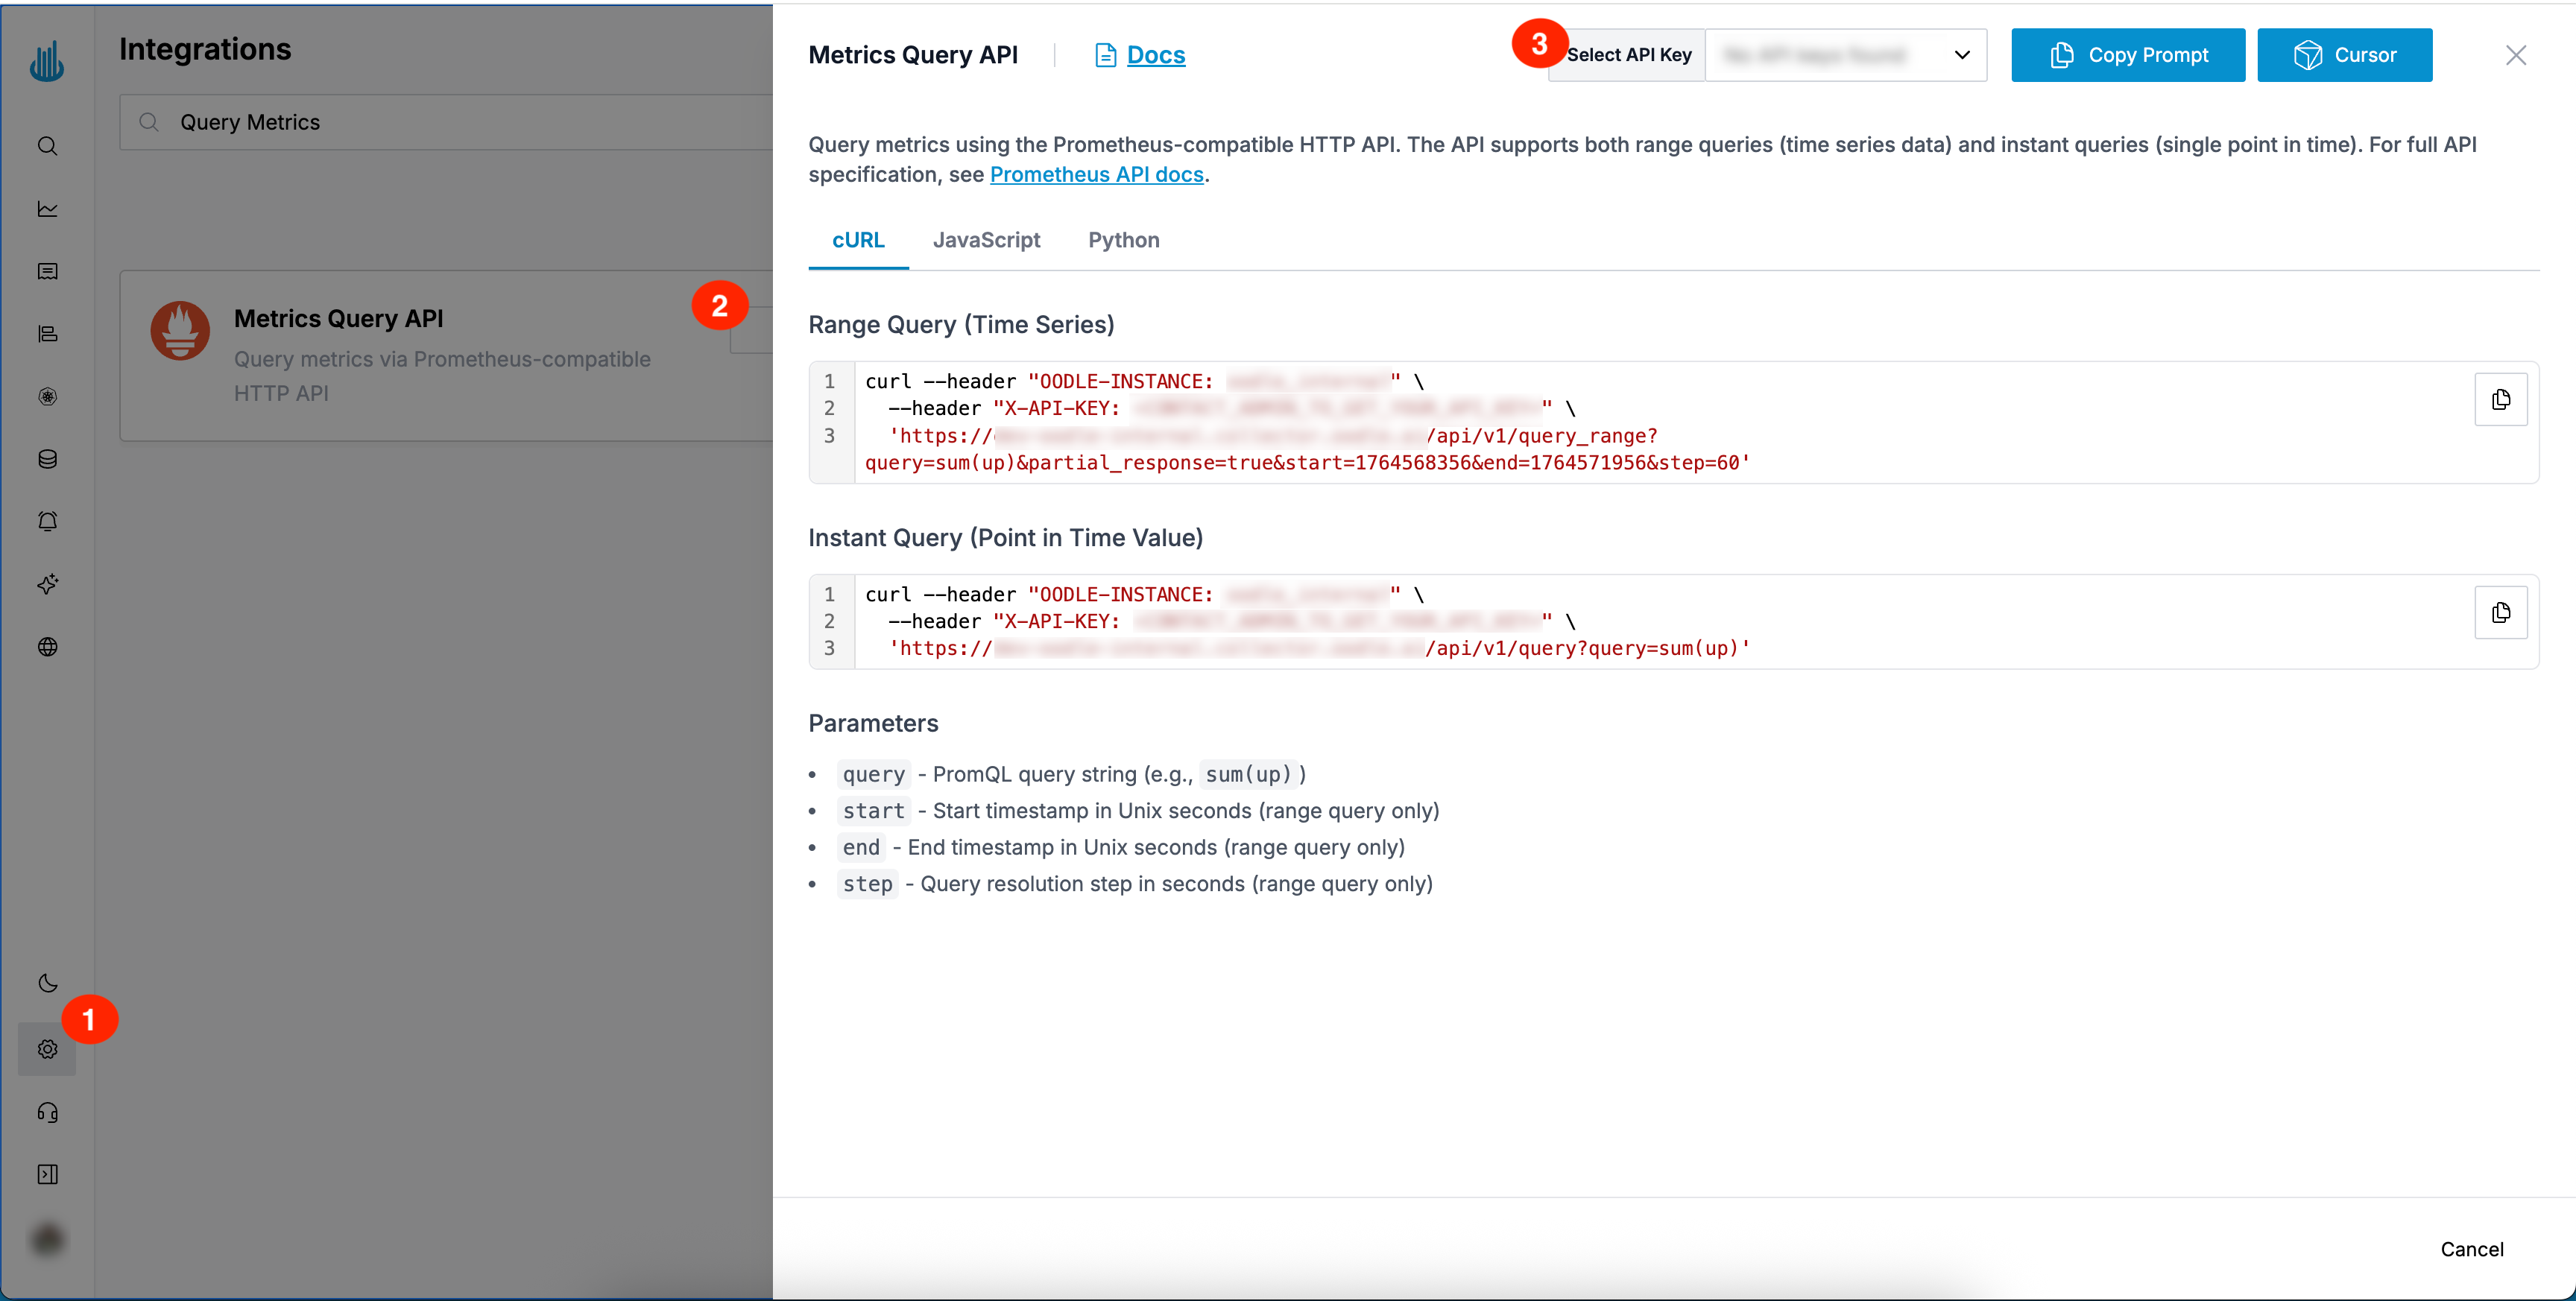
You can find the Query Metrics commands and steps by doing the following:
- Login to the Oodle UI, then navigate to the Integrations page
- Click on the Query Metrics tile
- Choose an appropriate API key from the list on top of the drawer
Query Types
Oodle supports two types of Prometheus queries:
Range Query (Time Series)
Retrieve metrics over a time range, useful for visualizing trends and patterns.
Endpoint: https://<OODLE_INSTANCE>.api.oodle.ai/api/v1/query_range
- cURL
- JavaScript
- Python
# Range query - get time series data
curl "https://<OODLE_INSTANCE>.api.oodle.ai/api/v1/query_range?query=up&start=1747000000&end=1747003600&step=15" \
  -H "OODLE-INSTANCE: <OODLE_INSTANCE>" \
  -H "X-API-KEY: <OODLE_API_KEY>"
// Range query - get time series data
const params = new URLSearchParams({
  query: "up",
  start: "1747000000",
  end: "1747003600",
  step: "15"
});

const response = await fetch(
  `https://<OODLE_INSTANCE>.api.oodle.ai/api/v1/query_range?${params}`,
  {
    headers: {
      "OODLE-INSTANCE": "<OODLE_INSTANCE>",
      "X-API-KEY": "<OODLE_API_KEY>"
    }
  }
);
const data = await response.json();
import requests

# Range query - get time series data
response = requests.get(
    "https://<OODLE_INSTANCE>.api.oodle.ai/api/v1/query_range",
    headers={
        "OODLE-INSTANCE": "<OODLE_INSTANCE>",
        "X-API-KEY": "<OODLE_API_KEY>"
    },
    params={
        "query": "up",
        "start": "1747000000",
        "end": "1747003600",
        "step": "15"
    }
)
data = response.json()
Range Query Parameters
query(required) - PromQL query expression (e.g.,up,rate(http_requests_total[5m]))start(required) - Start timestamp (Unix epoch seconds)end(required) - End timestamp (Unix epoch seconds)step(required) - Query resolution step width (in seconds)partial_response(optional) - Enable partial response for large queries (default:false)
Instant Query (Point in Time Value)
Get the current value of a metric at a specific point in time.
Endpoint: https://<OODLE_INSTANCE>.api.oodle.ai/api/v1/query
- cURL
- JavaScript
- Python
# Instant query - get current value
curl "https://<OODLE_INSTANCE>.api.oodle.ai/api/v1/query?query=up" \
  -H "OODLE-INSTANCE: <OODLE_INSTANCE>" \
  -H "X-API-KEY: <OODLE_API_KEY>"
// Instant query - get current value
const params = new URLSearchParams({
  query: "up"
});

const response = await fetch(
  `https://<OODLE_INSTANCE>.api.oodle.ai/api/v1/query?${params}`,
  {
    headers: {
      "OODLE-INSTANCE": "<OODLE_INSTANCE>",
      "X-API-KEY": "<OODLE_API_KEY>"
    }
  }
);
const data = await response.json();
import requests

# Instant query - get current value
response = requests.get(
    "https://<OODLE_INSTANCE>.api.oodle.ai/api/v1/query",
    headers={
        "OODLE-INSTANCE": "<OODLE_INSTANCE>",
        "X-API-KEY": "<OODLE_API_KEY>"
    },
    params={
        "query": "up"
    }
)
data = response.json()
Instant Query Parameters
query(required) - PromQL query expressiontime(optional) - Evaluation timestamp (Unix epoch seconds, defaults to current time)
PromQL Query Examples
Basic Queries
Get all instances of a metric:
up
Calculate rate over time:
rate(http_requests_total[5m])
Sum across dimensions:
sum(rate(http_requests_total[5m])) by (status)
Aggregations
Average value:
avg(cpu_usage_percent)
Maximum value:
max(memory_usage_bytes)
Count instances:
count(up == 1)
Filtering
Filter by label:
up{job="api"}
Multiple label filters:
http_requests_total{status="200", method="GET"}
Regex label matching:
up{job=~"api.*"}
Response Format
Both query types return a JSON response in Prometheus format:
Range Query Response
{
  "status": "success",
  "data": {
    "resultType": "matrix",
    "result": [
      {
        "metric": { "__name__": "up", "job": "api" },
        "values": [
          [1747000000, "1"],
          [1747000015, "1"],
          [1747000030, "1"]
        ]
      }
    ]
  }
}
Instant Query Response
{
  "status": "success",
  "data": {
    "resultType": "vector",
    "result": [
      {
        "metric": { "__name__": "up", "job": "api" },
        "value": [1747000000, "1"]
      }
    ]
  }
}
Time Formats
Timestamps should be provided as:
- Unix epoch seconds (e.g.,
1747000000) - RFC 3339 (e.g.,
2025-01-20T10:30:00Z)
API Compatibility
The Oodle metrics query API is compatible with the Prometheus HTTP API. Most Prometheus client libraries and tools can be configured to work with Oodle by changing the base URL and adding Oodle-specific headers.
Support
If you need assistance or have any questions, please reach out to us through:
- Email at [email protected]