Agent Observability
Oodle's Agent Observability helps engineering teams track how large language models are used across their applications - including prompts, responses, token consumption, and estimated costs.
New to Oodle? Sign up for free, then pick your SDK or framework on the Agent Observability integrations page: each one is a paste-ready OpenTelemetry snippet.
How It Works
Oodle ingests traces and logs that follow the OpenTelemetry Gen AI semantic conventions. When your application instruments LLM calls with these conventions, Oodle automatically:
- Detects the model from
gen_ai.request.modelandgen_ai.response.modelspan attributes - Extracts input and output token counts from
gen_ai.usage.input_tokensandgen_ai.usage.output_tokens - Displays prompt and response content from
gen_ai.input.messages,gen_ai.output.messages, andgen_ai.system_instructionsspan attributes - Calculates estimated costs based on your configured model pricing
All of this is surfaced in the Agent Observability hub at Agent Observability → Overview (ap1, us1).
Exploring Traces
The Agent Observability hub has several tabs for different views of your GenAI data.
Overview
The default tab shows an embedded Grafana dashboard with key metrics: token usage, cost trends, trace counts, and model breakdowns over time.
Traces
The main trace list with columns for timestamp, name, input, output, model, sentiment, turns, latency, and cost.
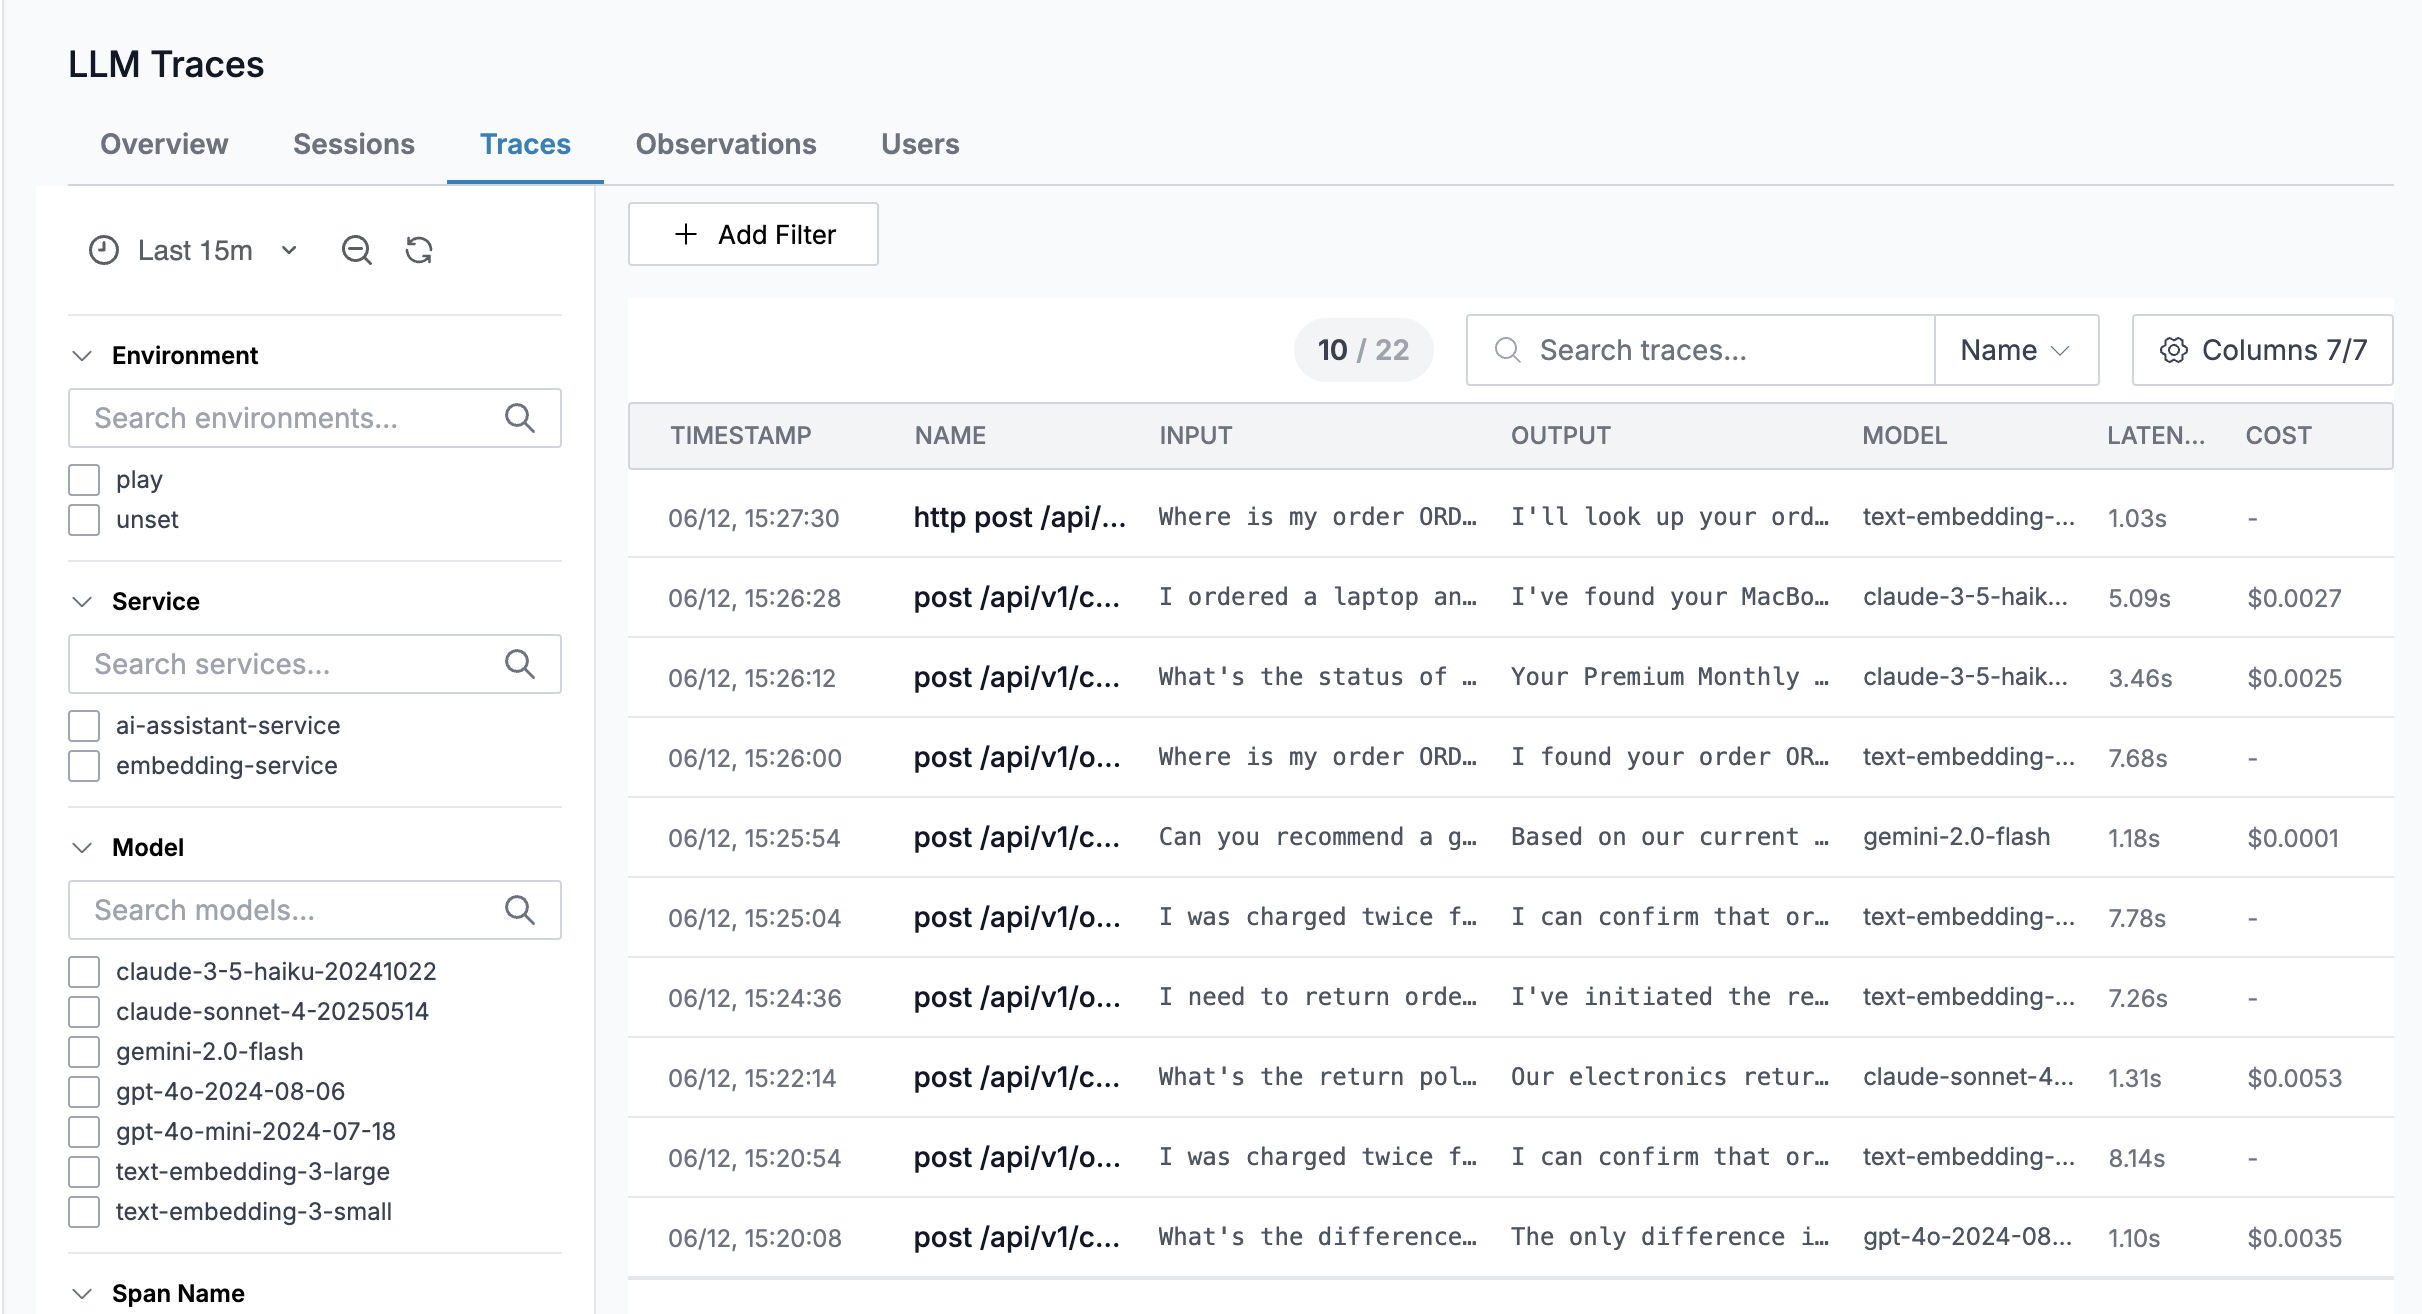
Search traces by Name, Input, Output, or Input/Output combined using the field dropdown next to the search box.
Click any trace to open the detail view (see Trace Detail below).
Agent Graph
An interactive topology graph showing how agents, tools, and LLM calls connect in your application. Each node displays request count, error rate, and average latency. Click a node to see:
- Decision Paths — outgoing connections split into sub-agents and tool calls with probability, error rate, and latency
- Traces — filtered trace list for that agent
- Insights — AI-generated recommendations specific to that agent (if available)
The Agent Graph has its own sidebar with environment and service filters, plus a node search and visibility toggle.
Observations
A span-level table showing individual LLM calls rather than full traces. Columns include start time, span type, name, input, output, model, sentiment, log level, latency, and cost.
Sessions
Groups traces by session.id into multi-turn
conversations. Each row shows the session ID, trace
count, turns, sentiment, total cost, duration, and
last activity time. Click a session to open a detail
drawer with stats and a cross-trace transcript.
To enable sessions, set session.id as a span
attribute in your instrumentation. Traces sharing
the same session ID are grouped together
automatically.
Users
Aggregates usage by user.id — showing total events,
turns, sentiment, token count, and cost per user.
Click a user to filter the Traces tab to that user's
activity.
Set user.id as a span attribute to enable
per-user tracking.
Insights
Appears when Oodle has generated AI-powered recommendations for your GenAI application. Insights are categorized by type (Quality, Efficiency, Resource, Performance) and severity (High, Medium, Low). Use this tab to identify optimization opportunities and quality issues.
Sidebar Filters
The sidebar on the left lets you filter data across most tabs:
| Filter | Description |
|---|---|
| Time Range | Controls the query window |
| Has Error | Show only traces with errors |
| Environment | Filter by resource::env |
| Service | Filter by resource::service.name |
| Model | Filter by gen_ai.request.model |
| Agent Name | Filter by gen_ai.agent.name |
| Operation Name | Filter by gen_ai.operation.name |
| User ID | Filter by user.id |
| Sentiment | Range slider from −1 to 1 |
| Score | Range slider from 0 to 1 |
| Score Name | Filter by evaluator score name |
You can also add arbitrary label filters using the filter bar above the tab content.
Trace Detail
Clicking on a trace opens the detail view with tabs for Transcript, Trace, Logs, Scores, and Costs.
Transcript
Displays the full conversation — system instructions, user prompts, and assistant responses — alongside the model name and token count.
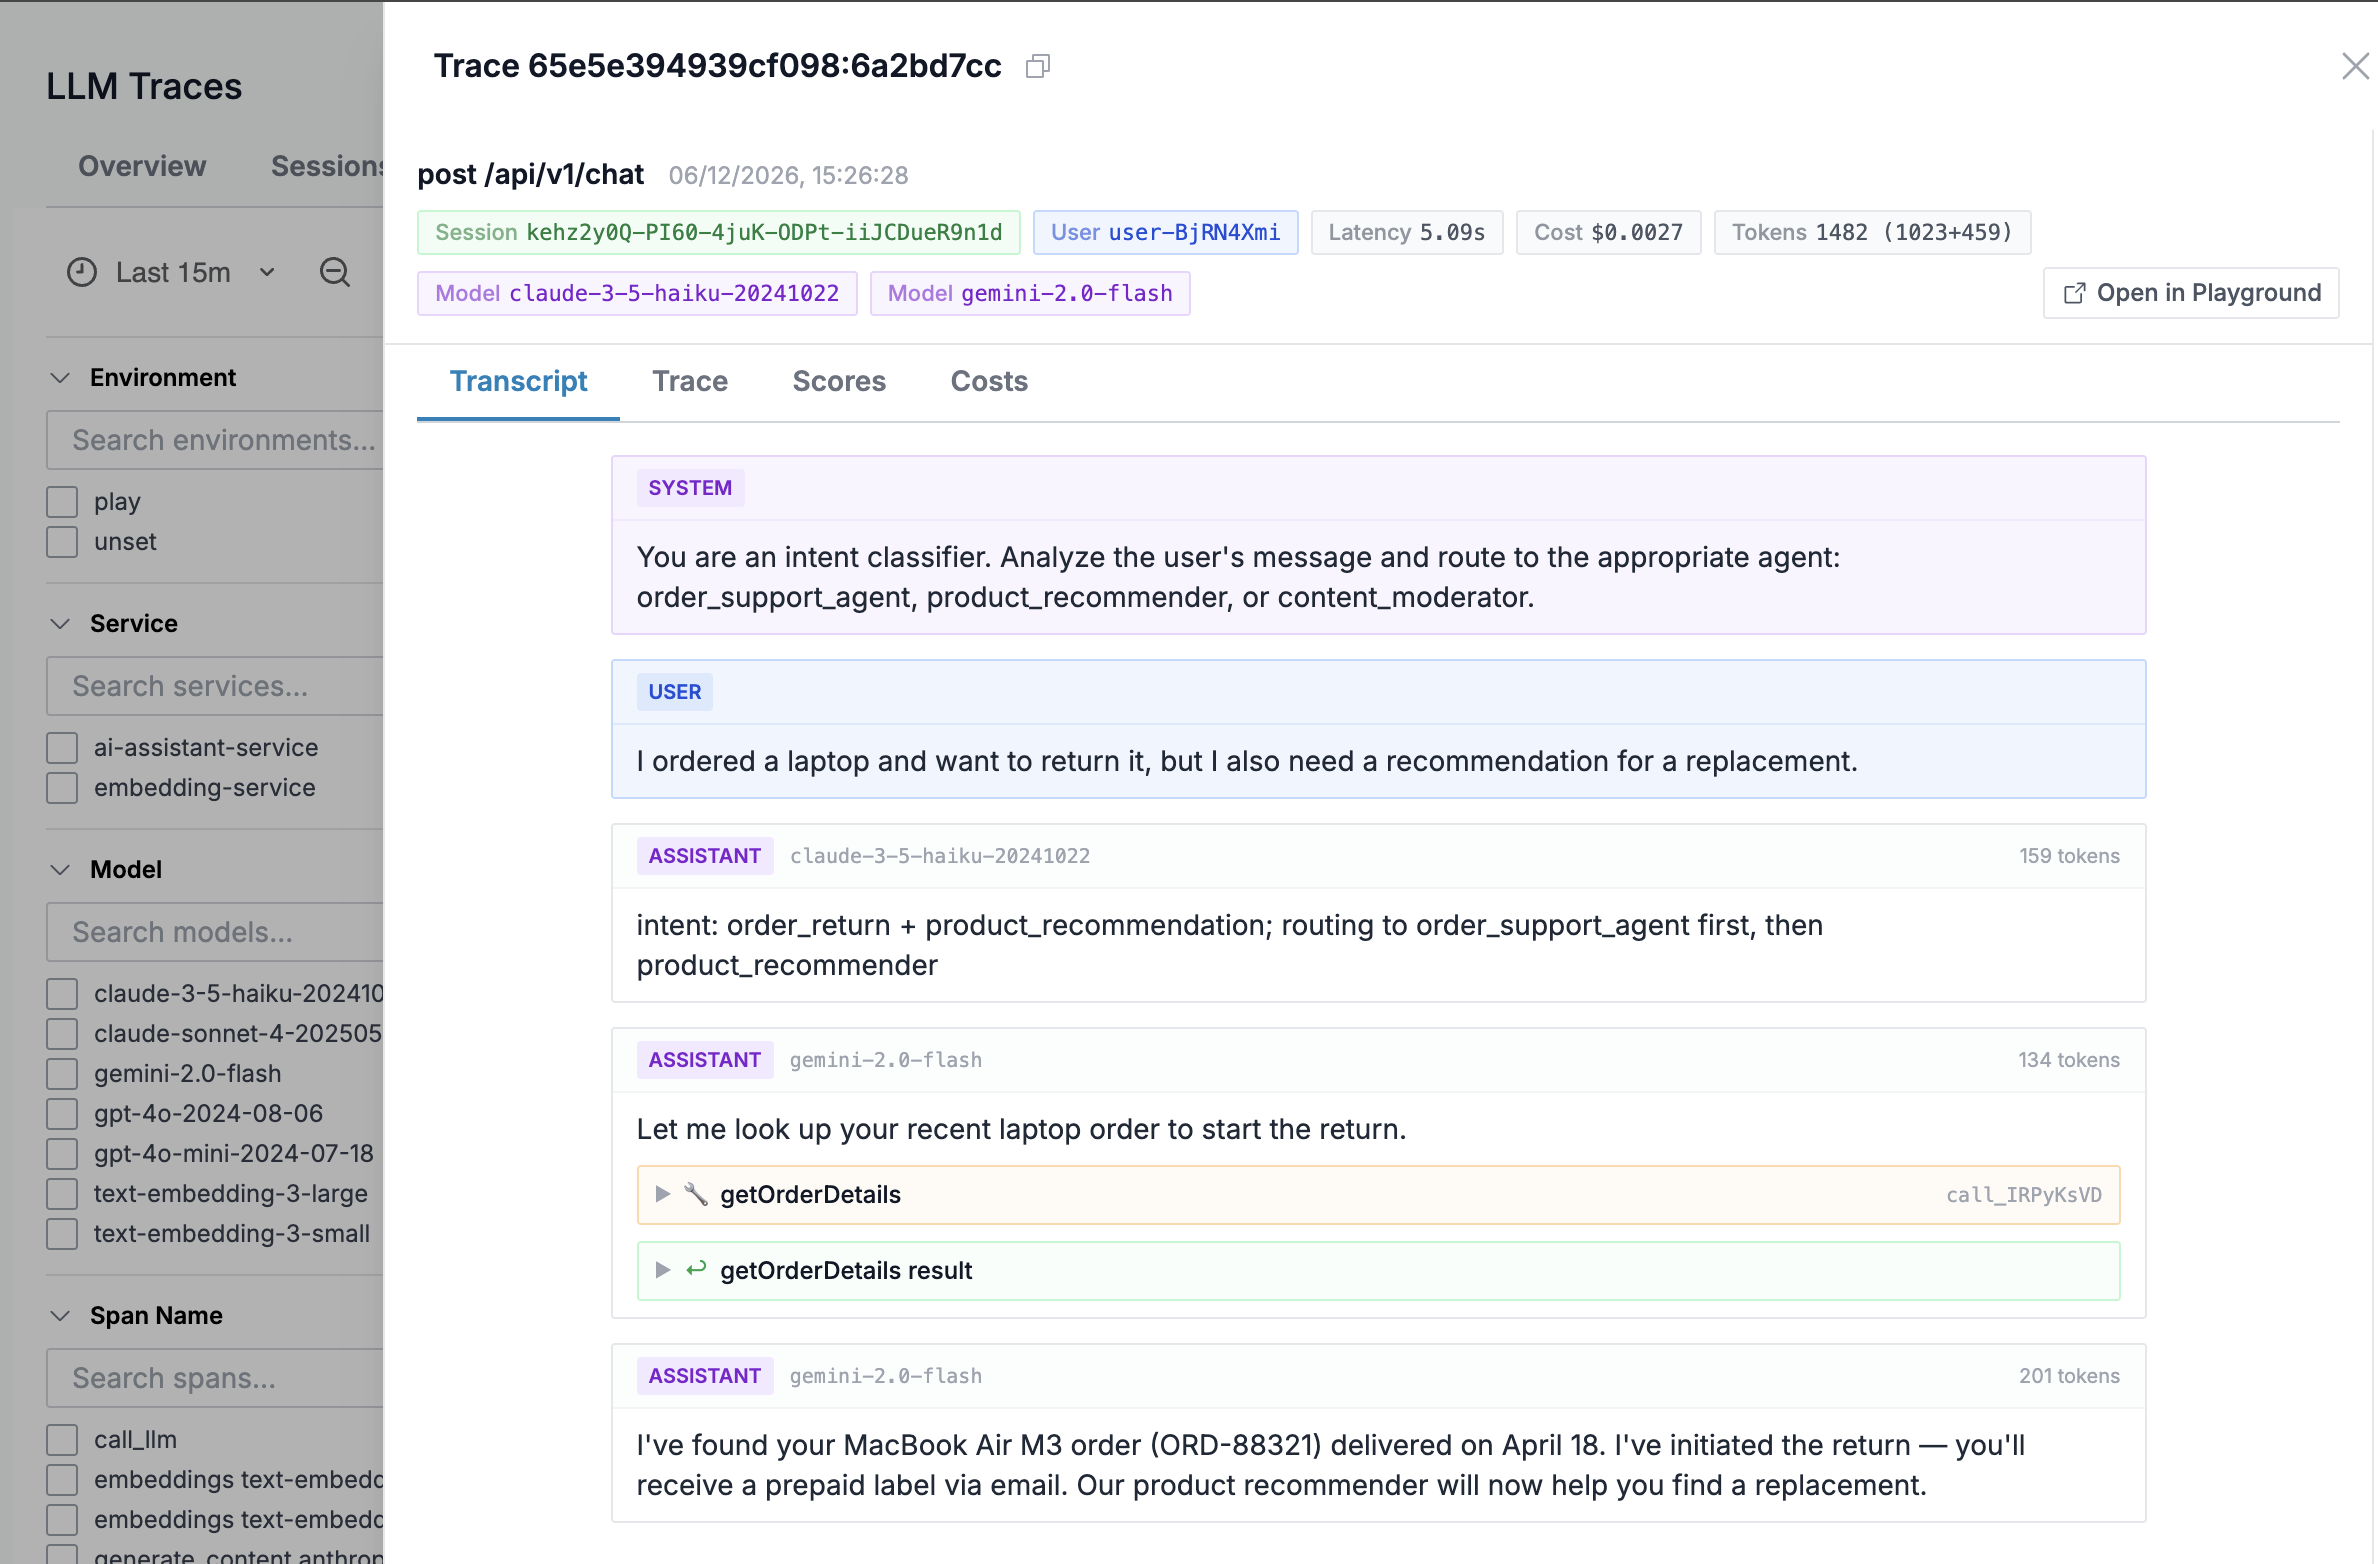
Use the search bar to find text across all messages. Matches are highlighted and the view scrolls to each result.
For traces with multiple agents (identified by
gen_ai.agent.name), a By Agent toggle groups
the conversation by agent.
Trace
Shows the span waterfall with the full request lifecycle, including nested agent invocations and LLM calls.
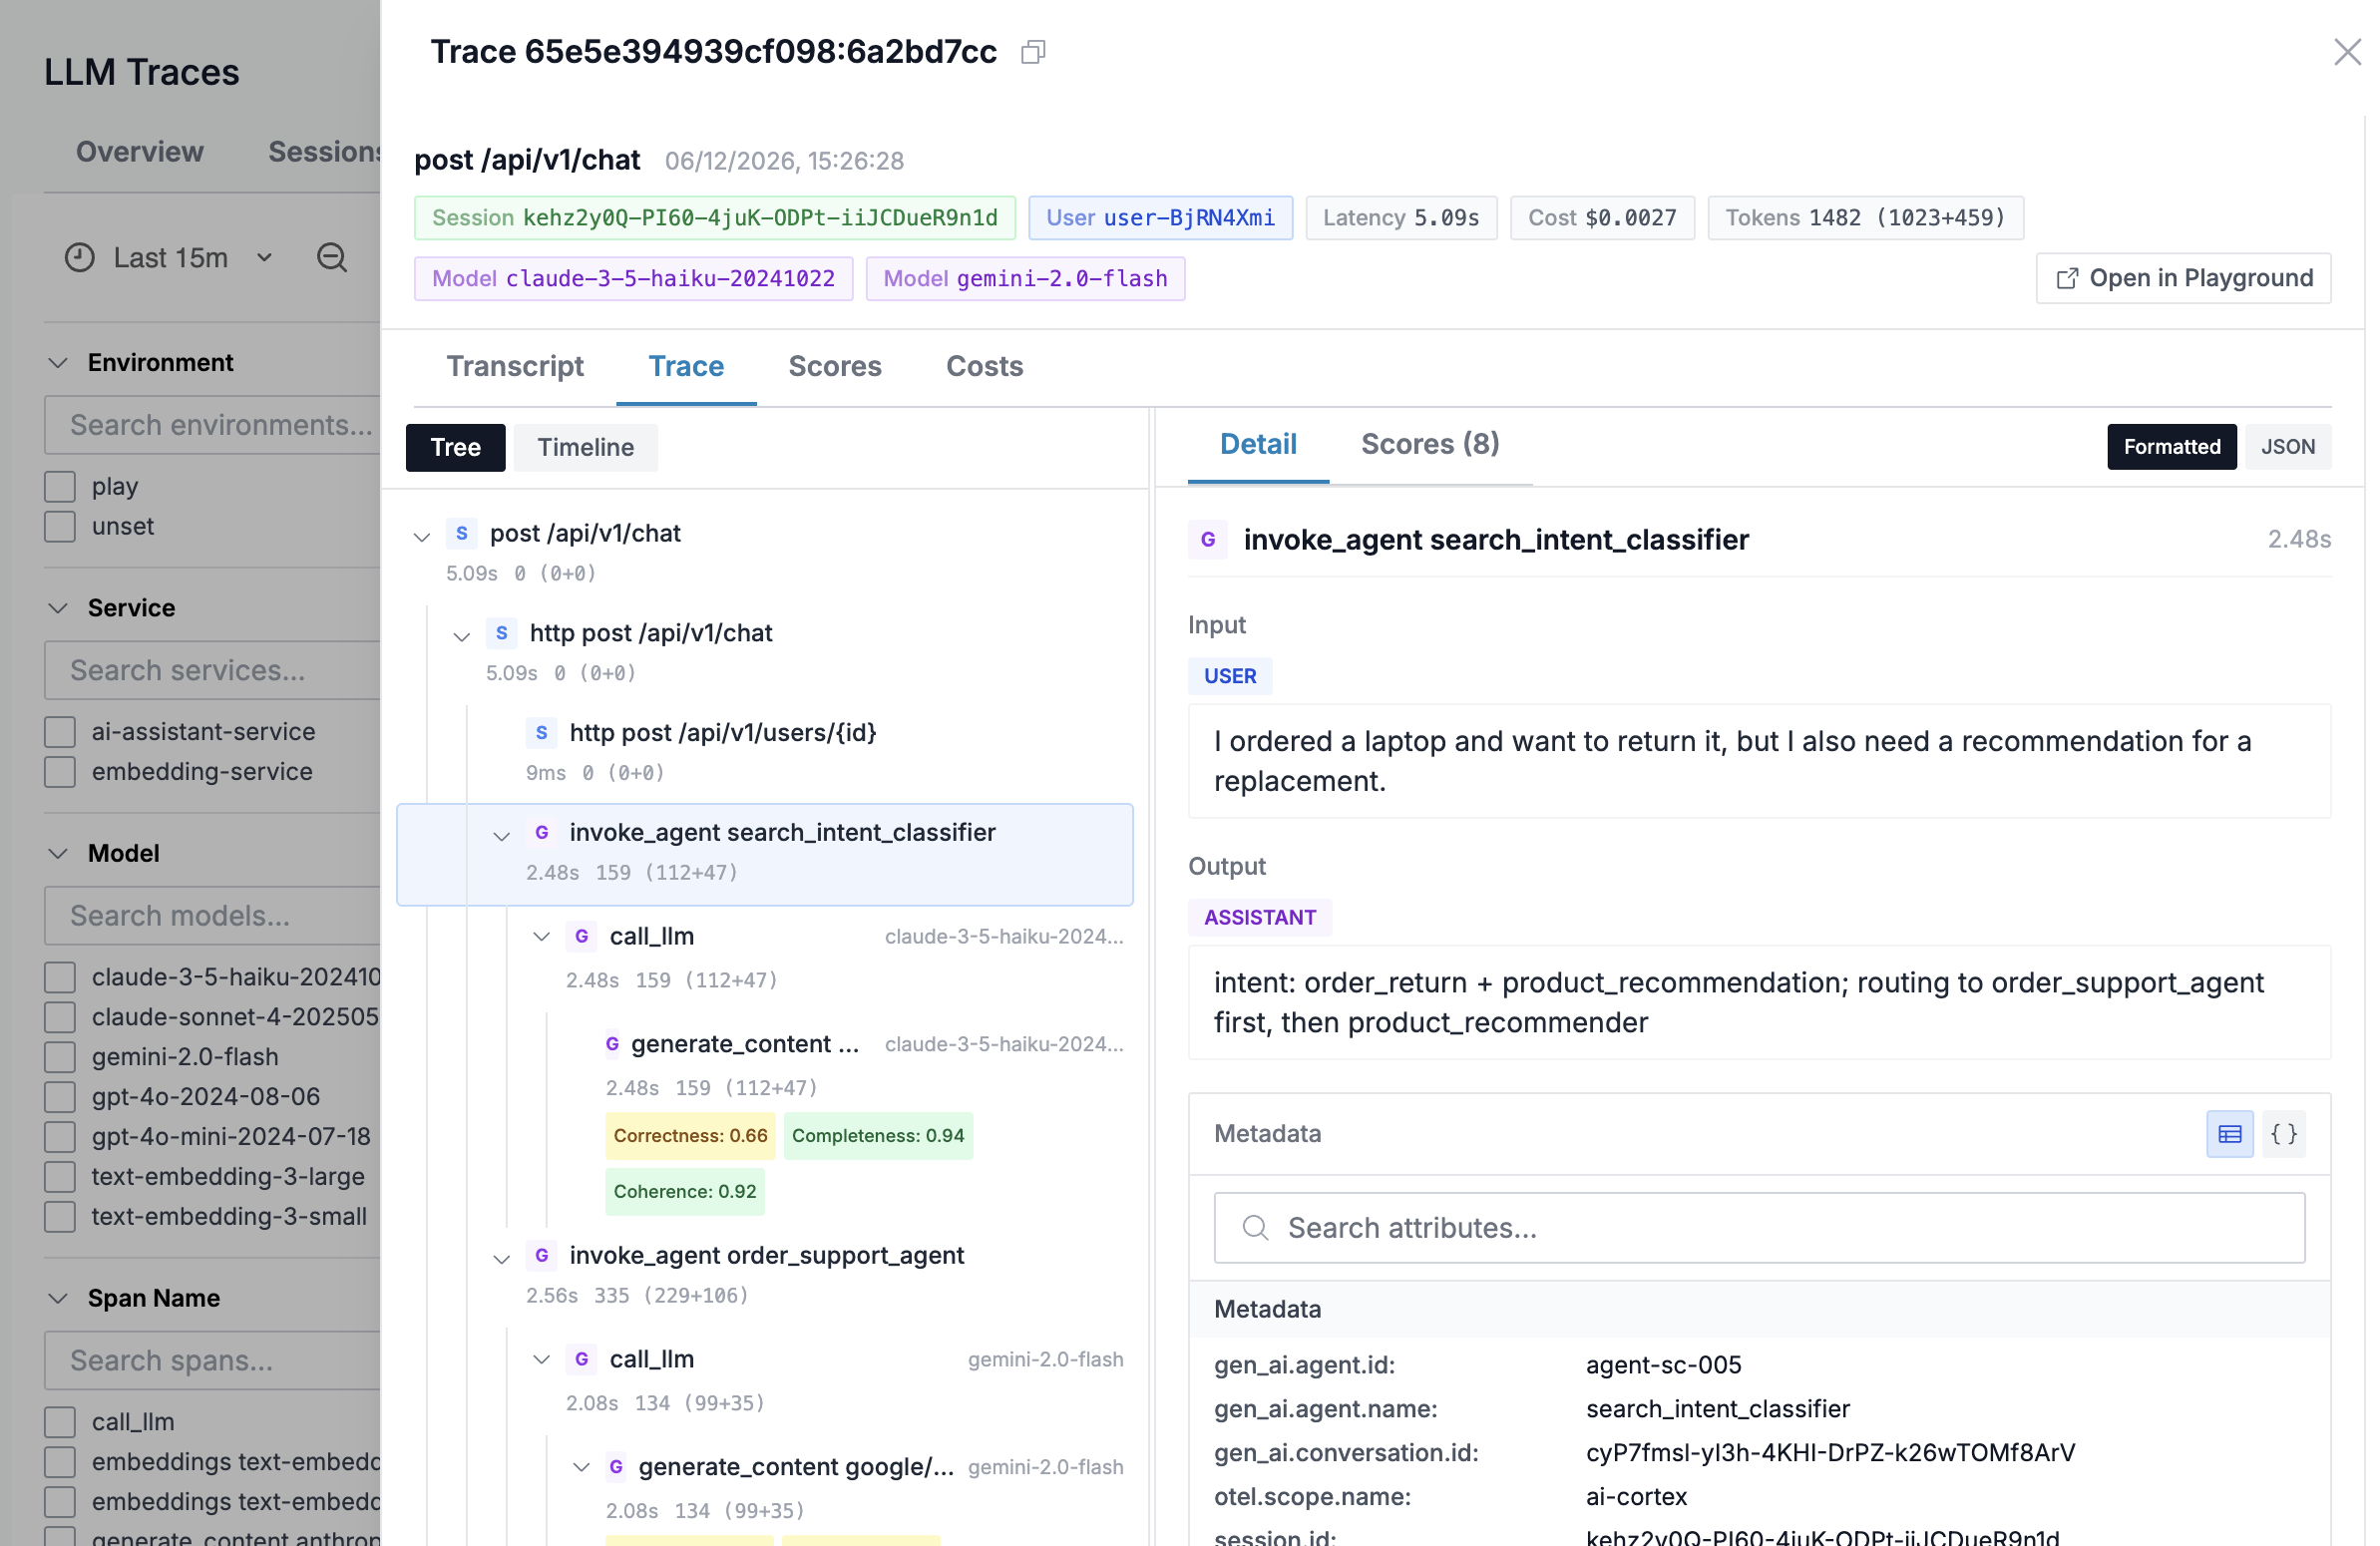
By default, non-GenAI infrastructure spans are hidden. Toggle Show all spans to reveal them. GenAI-related spans (GENERATION, AGENT, TOOL) are expanded automatically while infrastructure spans start collapsed.
Each span has sub-tabs for Overview, Gen AI (model/token/cost summary), Transcript, and Errors.
Scores
Shows all evaluator scores attached to the trace. Each row displays the score name, value, source (EVAL, ANNOTATION, or API), data type, model used, and comment.
Costs
Summarizes total cost, tokens, and LLM calls broken down by model. Shows separate breakdowns for model costs and evaluator costs.
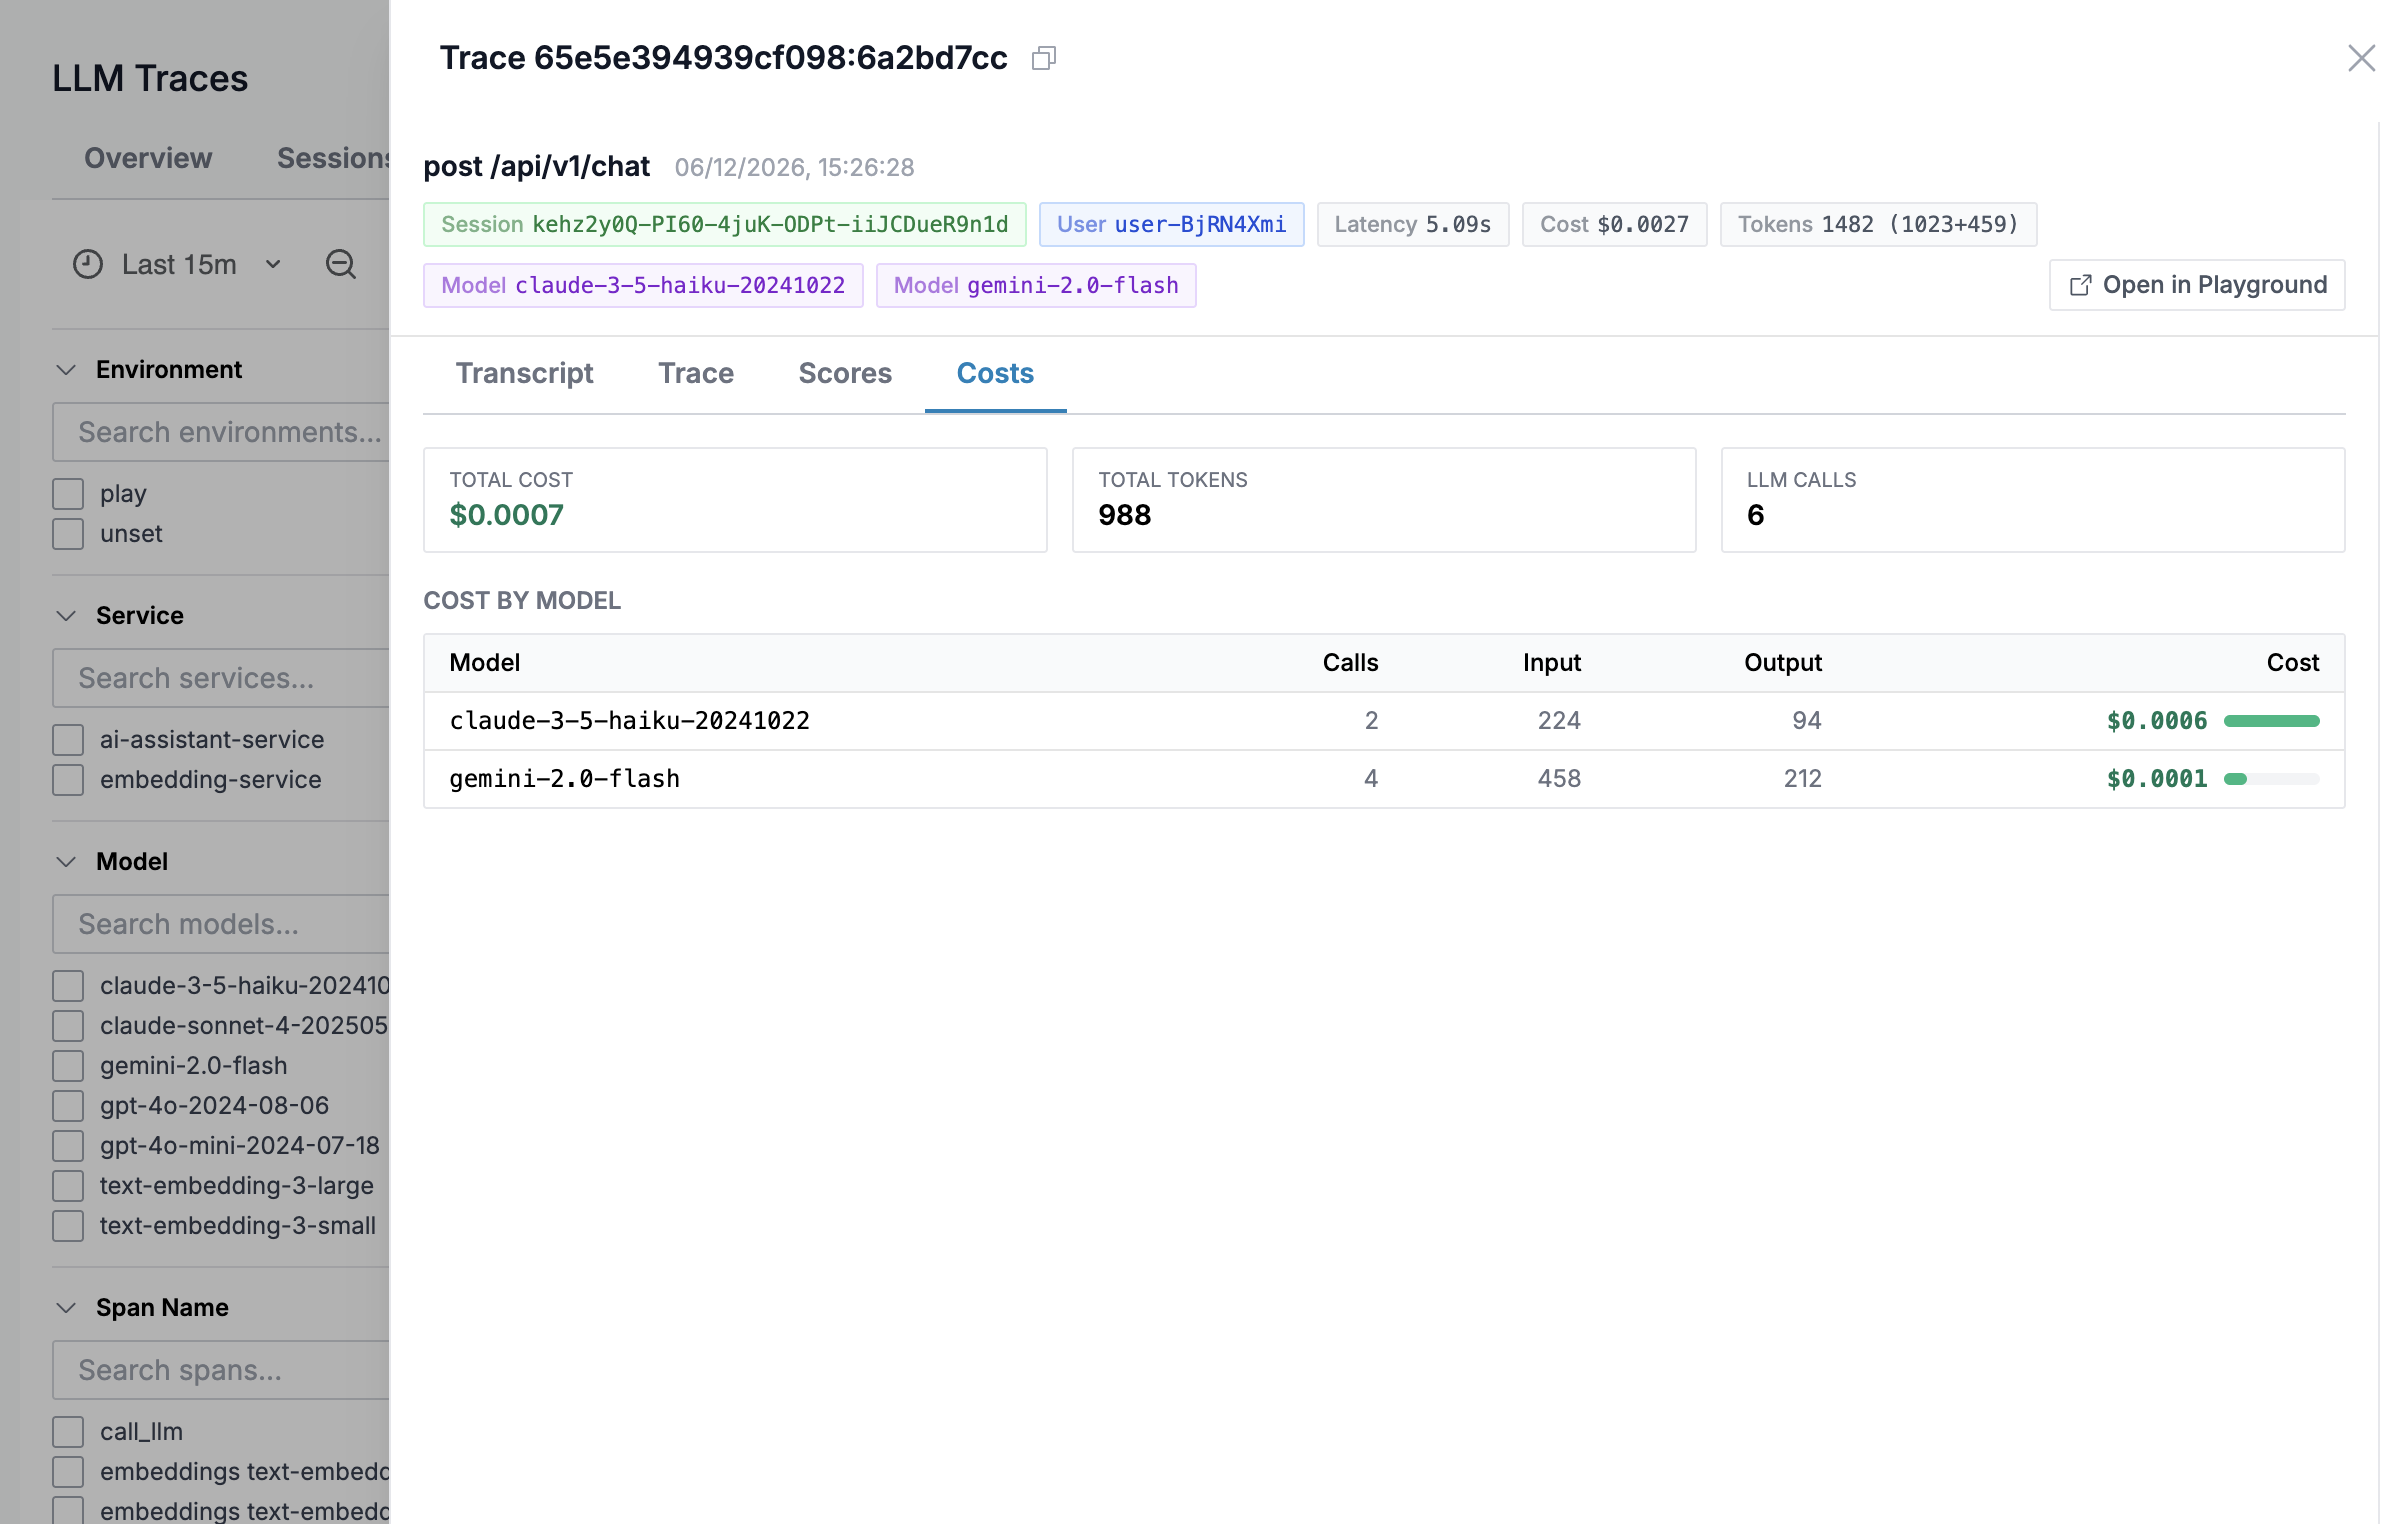
Trace Actions
The trace detail toolbar includes several actions:
| Action | Description |
|---|---|
| Analyze with AI | Opens the AI sidebar assistant with the trace as context |
| Open in Playground | Loads the trace conversation into the Playground for iteration |
| Add to Dataset | Adds the trace as a test case to a dataset |
| Open Trace | Opens the trace in the standard trace lookup view |
Getting Started
1. Choose how data reaches Oodle
There are two supported paths. Both send the same OpenTelemetry data, so pick the one that matches your environment.
Via an OpenTelemetry Collector. Your application exports to a collector you run, and the collector forwards to Oodle. Redaction, sampling and batching live in the collector, and every service uses one export path. Use this if you already run a collector.
Direct to Oodle. Your application exports to Oodle with no collector in between. There is nothing extra to operate, but the application holds the Oodle API key and there is no collector hop to redact content. Use the SDK's own options to limit what is captured.
Oodle's OTLP endpoint serves the standard OTLP signal
paths (/v1/traces, /v1/logs, /v1/metrics) and
requires the X-API-KEY and X-OODLE-INSTANCE headers.
Requests without them are rejected with 401.
2. Install instrumentation
Install the instrumentation for your LLM provider. Google
Gemini, Pydantic AI and LiteLLM are Python only: there is
no OpenTelemetry instrumentation for the @google/genai
JavaScript SDK, Pydantic AI has no JavaScript port, and
LiteLLM carries its OTel callback in the Python SDK only.
- Langfuse
- OpenLIT
- OpenAI
- Pydantic AI
- Google Gemini
- LiteLLM
- LangChain
- Traceloop
- Python
- TypeScript
pip install langfuse openai \
  opentelemetry-exporter-otlp-proto-http \
  opentelemetry-sdk
npm install @langfuse/tracing @langfuse/openai \
  @opentelemetry/exporter-trace-otlp-proto \
  @opentelemetry/sdk-trace-base @opentelemetry/sdk-trace-node \
  @opentelemetry/resources @opentelemetry/semantic-conventions openai
- Python
- TypeScript
pip install openlit
npm install openlit
- Python
- TypeScript
pip install opentelemetry-instrumentation-openai-v2 \
  opentelemetry-exporter-otlp-proto-http \
  opentelemetry-sdk \
  httpx \
  openai
httpx must be installed explicitly. openai 3.x depends
on httpx2, while
opentelemetry-instrumentation-openai-v2 imports httpx
without declaring it as a dependency. Without httpx the
instrumentor raises ModuleNotFoundError on import.
npm install @opentelemetry/instrumentation-openai \
  @opentelemetry/instrumentation \
  @opentelemetry/exporter-trace-otlp-proto \
  @opentelemetry/resources \
  @opentelemetry/sdk-trace-base \
  @opentelemetry/sdk-trace-node \
  @opentelemetry/semantic-conventions \
  "openai@^6"
@opentelemetry/instrumentation-openai supports
openai >=4.19.0 <7. On openai 7 it patches nothing and
emits no spans, without an error. Keep the version pin.
pip install pydantic-ai \
  opentelemetry-exporter-otlp-proto-http \
  opentelemetry-sdk
pip install opentelemetry-instrumentation-google-genai \
  opentelemetry-exporter-otlp-proto-http \
  opentelemetry-sdk \
  google-genai
pip install litellm \
  opentelemetry-exporter-otlp-proto-http \
  opentelemetry-sdk
LiteLLM depends on neither OpenTelemetry package. Without them the callback fails to start, LiteLLM logs one non-blocking error, and the application serves traffic and sends nothing.
- Python
- TypeScript
pip install langchain langchain-openai langgraph \
  opentelemetry-instrumentation-langchain \
  opentelemetry-exporter-otlp-proto-http \
  opentelemetry-sdk
npm install @traceloop/instrumentation-langchain \
  @opentelemetry/instrumentation \
  @opentelemetry/exporter-trace-otlp-proto \
  @opentelemetry/resources \
  @opentelemetry/sdk-trace-base \
  @opentelemetry/sdk-trace-node \
  @opentelemetry/semantic-conventions \
  langchain @langchain/openai @langchain/core
- Python
- TypeScript
pip install traceloop-sdk google-genai
npm install @traceloop/node-server-sdk openai
See the OpenTelemetry GenAI instrumentation registry for a full list of supported providers (Anthropic, AWS Bedrock, and more).
3. Instrument your application
The examples below export to a collector at
http://otel-collector:4318. For the direct path, replace
that endpoint with your Oodle OTLP endpoint and add the
authentication headers, as shown in step 4.
OpenTelemetry auto-instrumentation patches modules as they load. The SDK initialization must run before the LLM client is required. If you require the client first, the application works but emits no spans.
- Langfuse
- OpenLIT
- OpenAI
- Pydantic AI
- Google Gemini
- LiteLLM
- LangChain
- Traceloop
The Langfuse SDK is built on
OpenTelemetry, so its spans can be sent to Oodle like any
other instrumentation. Oodle resolves the langfuse.*
attributes to the standard gen_ai.* attributes when it
ingests them.
- Python
- TypeScript
from opentelemetry.exporter.otlp.proto.http.trace_exporter import OTLPSpanExporter
from opentelemetry.sdk.resources import Resource
from opentelemetry.sdk.trace import TracerProvider
from opentelemetry.sdk.trace.export import BatchSpanProcessor
from opentelemetry.trace import set_tracer_provider
from langfuse import Langfuse, get_client, observe


def setup_opentelemetry():
    resource = Resource.create({"service.name": "my-llm-app"})

    tracer_provider = TracerProvider(resource=resource)
    tracer_provider.add_span_processor(
        BatchSpanProcessor(OTLPSpanExporter())
    )
    set_tracer_provider(tracer_provider)
    return tracer_provider


# Langfuse writes into the application tracer provider.
Langfuse(tracer_provider=setup_opentelemetry())

# The Langfuse OpenAI drop-in traces every call it makes.
from langfuse.openai import openai


@observe()
def chat(message: str) -> str:
    response = openai.chat.completions.create(
        model="gpt-4o-mini",
        messages=[{"role": "user", "content": message}],
    )
    return response.choices[0].message.content


chat("Hello!")

# Short-lived processes must flush before they exit.
get_client().flush()
// instrumentation.ts
import { setLangfuseTracerProvider } from '@langfuse/tracing';
import { OTLPTraceExporter } from '@opentelemetry/exporter-trace-otlp-proto';
import { resourceFromAttributes } from '@opentelemetry/resources';
import { BatchSpanProcessor } from '@opentelemetry/sdk-trace-base';
import { NodeTracerProvider } from '@opentelemetry/sdk-trace-node';
import { ATTR_SERVICE_NAME } from '@opentelemetry/semantic-conventions';

export const provider = new NodeTracerProvider({
  resource: resourceFromAttributes({ [ATTR_SERVICE_NAME]: 'my-llm-app' }),
  spanProcessors: [new BatchSpanProcessor(new OTLPTraceExporter())],
});

provider.register();

// Langfuse writes into this provider.
setLangfuseTracerProvider(provider);
// index.ts - import the instrumentation first.
import { provider } from './instrumentation';
import { observe } from '@langfuse/tracing';
import { observeOpenAI } from '@langfuse/openai';
import OpenAI from 'openai';

const openai = observeOpenAI(new OpenAI());

const chat = observe(
  async (message: string) => {
    const response = await openai.chat.completions.create({
      model: 'gpt-4o-mini',
      messages: [{ role: 'user', content: message }],
    });
    return response.choices[0].message.content;
  },
  { name: 'chat' },
);

async function main() {
  await chat('Hello!');

  // Short-lived processes must flush before they exit.
  await provider.forceFlush();
}

main();
Attach Langfuse to the application tracer provider, as
shown. If you register LangfuseSpanProcessor and an
OTLP span processor in the same provider, every Langfuse
span is exported twice, which double counts tokens and
cost. See the Langfuse guide on
using an existing OpenTelemetry setup.
LANGFUSE_PUBLIC_KEY and LANGFUSE_SECRET_KEY must be
set even when the OTLP exporter owns transport. Without
them the Langfuse client disables itself and emits
nothing. Any value works in that case.
OpenLIT auto-instruments
supported LLM providers, vector databases, MCP tools, and GPUs
with a single init() call.
- Python
- TypeScript
import openlit

openlit.init(
    service_name="my-llm-app",
    otlp_endpoint="http://otel-collector:4318",
    capture_message_content=True,
)

# Import your LLM SDK after openlit.init so it gets patched.
import openai
const Openlit = require('openlit').default;

Openlit.init({
  applicationName: 'my-llm-app',
  otlpEndpoint: 'http://otel-collector:4318',
  captureMessageContent: true,
});

// Require your LLM SDK after Openlit.init.
const OpenAI = require('openai');
Set capture_message_content to capture prompt and
response content in span attributes. Review your
organization's data policies before you enable it in
production.
- Python
- TypeScript
from opentelemetry import _logs as otel_logs
from opentelemetry import trace as otel_trace
from opentelemetry.exporter.otlp.proto.http._log_exporter import OTLPLogExporter
from opentelemetry.exporter.otlp.proto.http.trace_exporter import OTLPSpanExporter
from opentelemetry.instrumentation.openai_v2 import OpenAIInstrumentor
from opentelemetry.sdk._logs import LoggerProvider
from opentelemetry.sdk._logs.export import BatchLogRecordProcessor
from opentelemetry.sdk.resources import Resource
from opentelemetry.sdk.trace import TracerProvider
from opentelemetry.sdk.trace.export import BatchSpanProcessor


def setup_opentelemetry():
    resource = Resource.create({"service.name": "my-llm-app"})

    tracer_provider = TracerProvider(resource=resource)
    tracer_provider.add_span_processor(BatchSpanProcessor(OTLPSpanExporter()))
    otel_trace.set_tracer_provider(tracer_provider)

    logger_provider = LoggerProvider(resource=resource)
    logger_provider.add_log_record_processor(
        BatchLogRecordProcessor(OTLPLogExporter())
    )
    otel_logs.set_logger_provider(logger_provider)


setup_opentelemetry()
OpenAIInstrumentor().instrument()
Put the setup in instrumentation.js and load it before
the application with node --require ./instrumentation.js app.js:
// instrumentation.js
const { OpenAIInstrumentation } = require('@opentelemetry/instrumentation-openai');
const { registerInstrumentations } = require('@opentelemetry/instrumentation');
const { OTLPTraceExporter } = require('@opentelemetry/exporter-trace-otlp-proto');
const { resourceFromAttributes } = require('@opentelemetry/resources');
const { BatchSpanProcessor } = require('@opentelemetry/sdk-trace-base');
const { NodeTracerProvider } = require('@opentelemetry/sdk-trace-node');
const { ATTR_SERVICE_NAME } = require('@opentelemetry/semantic-conventions');

const provider = new NodeTracerProvider({
  resource: resourceFromAttributes({ [ATTR_SERVICE_NAME]: 'my-llm-app' }),
  spanProcessors: [new BatchSpanProcessor(new OTLPTraceExporter())],
});
provider.register();

registerInstrumentations({ instrumentations: [new OpenAIInstrumentation()] });

process.on('beforeExit', () => provider.shutdown());
NodeTracerProvider does not read OTEL_SERVICE_NAME.
Name the service in the resource as shown, or every
trace arrives as unknown_service:node.
from opentelemetry.exporter.otlp.proto.http.trace_exporter import OTLPSpanExporter
from opentelemetry.sdk.resources import Resource
from opentelemetry.sdk.trace import TracerProvider
from opentelemetry.sdk.trace.export import BatchSpanProcessor
from opentelemetry.trace import set_tracer_provider
from pydantic_ai import Agent, InstrumentationSettings


def setup_opentelemetry():
    resource = Resource.create({"service.name": "my-llm-app"})

    tracer_provider = TracerProvider(resource=resource)
    tracer_provider.add_span_processor(
        BatchSpanProcessor(OTLPSpanExporter())
    )
    set_tracer_provider(tracer_provider)


setup_opentelemetry()

# use_aggregated_usage_attribute_names=False emits the standard
# gen_ai.* usage attributes instead of aggregated ones.
Agent.instrument_all(InstrumentationSettings(
    use_aggregated_usage_attribute_names=False,
))
Pydantic AI captures prompt and response content by
default. Pass include_content=False to
InstrumentationSettings to disable it.
from opentelemetry import _logs as otel_logs
from opentelemetry import trace as otel_trace
from opentelemetry.exporter.otlp.proto.http._log_exporter import OTLPLogExporter
from opentelemetry.exporter.otlp.proto.http.trace_exporter import OTLPSpanExporter
from opentelemetry.instrumentation.google_genai import GoogleGenAiSdkInstrumentor
from opentelemetry.sdk._logs import LoggerProvider
from opentelemetry.sdk._logs.export import BatchLogRecordProcessor
from opentelemetry.sdk.resources import Resource
from opentelemetry.sdk.trace import TracerProvider
from opentelemetry.sdk.trace.export import BatchSpanProcessor


def setup_opentelemetry():
    resource = Resource.create({"service.name": "my-llm-app"})

    tracer_provider = TracerProvider(resource=resource)
    tracer_provider.add_span_processor(BatchSpanProcessor(OTLPSpanExporter()))
    otel_trace.set_tracer_provider(tracer_provider)

    logger_provider = LoggerProvider(resource=resource)
    logger_provider.add_log_record_processor(
        BatchLogRecordProcessor(OTLPLogExporter())
    )
    otel_logs.set_logger_provider(logger_provider)


setup_opentelemetry()
GoogleGenAiSdkInstrumentor().instrument()
After this, all calls to the Google Gemini SDK are traced automatically.
import litellm

# LiteLLM builds its own tracer provider from the
# OTEL_EXPORTER_OTLP_* variables, so there is no SDK setup
# to write here.
litellm.callbacks = ["otel"]

response = litellm.completion(
    model="gpt-4o-mini",
    messages=[{"role": "user", "content": "Hello!"}],
)
Every call LiteLLM routes is traced, whichever provider
serves it. LiteLLM Proxy takes the same callback in
config.yaml:
litellm_settings:
  callbacks: ["otel"]
LiteLLM captures prompt and response content by default.
Set
OTEL_INSTRUMENTATION_GENAI_CAPTURE_MESSAGE_CONTENT=NO_CONTENT
to disable it.
- Python
- TypeScript
from langchain.agents import create_agent
from langchain_openai import ChatOpenAI
from opentelemetry.exporter.otlp.proto.http.trace_exporter import OTLPSpanExporter
from opentelemetry.instrumentation.langchain import LangchainInstrumentor
from opentelemetry.sdk.resources import Resource
from opentelemetry.sdk.trace import TracerProvider
from opentelemetry.sdk.trace.export import BatchSpanProcessor
from opentelemetry.trace import set_tracer_provider


def setup_opentelemetry():
    resource = Resource.create({"service.name": "my-llm-app"})

    tracer_provider = TracerProvider(resource=resource)
    tracer_provider.add_span_processor(
        BatchSpanProcessor(OTLPSpanExporter())
    )
    set_tracer_provider(tracer_provider)


setup_opentelemetry()

# Auto-instruments LangChain chains, LLM calls, tools,
# and retrievers. No manual spans required.
LangchainInstrumentor().instrument()

agent = create_agent(ChatOpenAI(model="gpt-4o-mini"), tools=[])
Build agents with from langchain.agents import create_agent.
langgraph.prebuilt.create_react_agent is deprecated in
LangGraph v1.
// instrumentation.js
const { LangChainInstrumentation } = require('@traceloop/instrumentation-langchain');
const { registerInstrumentations } = require('@opentelemetry/instrumentation');
const { OTLPTraceExporter } = require('@opentelemetry/exporter-trace-otlp-proto');
const { resourceFromAttributes } = require('@opentelemetry/resources');
const { BatchSpanProcessor } = require('@opentelemetry/sdk-trace-base');
const { NodeTracerProvider } = require('@opentelemetry/sdk-trace-node');
const { ATTR_SERVICE_NAME } = require('@opentelemetry/semantic-conventions');

const provider = new NodeTracerProvider({
  resource: resourceFromAttributes({ [ATTR_SERVICE_NAME]: 'my-llm-app' }),
  spanProcessors: [new BatchSpanProcessor(new OTLPTraceExporter())],
});
provider.register();

registerInstrumentations({ instrumentations: [new LangChainInstrumentation()] });

process.on('beforeExit', () => provider.shutdown());
Traceloop's OpenLLMetry SDK auto-instruments supported LLM SDKs with a single init call.
- Python
- TypeScript
from google import genai
from traceloop.sdk import Traceloop
from traceloop.sdk.decorators import workflow

# Auto-instruments Gemini, OpenAI, Anthropic, LangChain, and more.
Traceloop.init(app_name="my-llm-app")

client = genai.Client()


# Optional: group related LLM calls under a named workflow span.
@workflow(name="chat")
def chat(message: str) -> str:
    response = client.models.generate_content(
        model="gemini-flash-latest",
        contents=message,
    )
    return response.text
const traceloop = require('@traceloop/node-server-sdk');

traceloop.initialize({
  appName: 'my-llm-app',
  baseUrl: process.env.TRACELOOP_BASE_URL,
});

// Require your LLM SDK after initialize.
const OpenAI = require('openai');
Traceloop uses its own environment variables instead of
the OTEL_* ones. Point the SDK at your collector with
TRACELOOP_BASE_URL=http://otel-collector:4318; the SDK
appends /v1/traces. Content capture is on by default;
disable it with TRACELOOP_TRACE_CONTENT=false.
4. Set environment variables
- Via OTel Collector
- Direct to Oodle
export OTEL_EXPORTER_OTLP_ENDPOINT=http://otel-collector:4318
export OTEL_SEMCONV_STABILITY_OPT_IN=gen_ai_latest_experimental
export OTEL_INSTRUMENTATION_GENAI_CAPTURE_MESSAGE_CONTENT=span_and_event
The collector holds the Oodle credentials, so the application does not need them.
export OTEL_EXPORTER_OTLP_ENDPOINT=https://<OODLE_INSTANCE>-otlp.collector.oodle.ai
export OTEL_EXPORTER_OTLP_HEADERS="X-API-KEY=<OODLE_API_KEY>,X-OODLE-INSTANCE=<OODLE_INSTANCE>"
export OTEL_SEMCONV_STABILITY_OPT_IN=gen_ai_latest_experimental
export OTEL_INSTRUMENTATION_GENAI_CAPTURE_MESSAGE_CONTENT=span_and_event
In JavaScript, set
OTEL_INSTRUMENTATION_GENAI_CAPTURE_MESSAGE_CONTENT=true
instead. That instrumentation parses the setting as a
boolean, warns on any other value, and captures nothing.
Traceloop uses TRACELOOP_BASE_URL and
TRACELOOP_HEADERS instead.
LiteLLM also reads OTEL_SERVICE_NAME. It has no code
hook for the resource, so without that variable every
trace lands under the service name litellm.
Langfuse uses the same OTLP endpoint and headers as every other provider. Oodle does serve a Langfuse-compatible ingest API, but that path is for prompt management, not for tracing: sending spans through it leaves the Langfuse SDK owning the only tracer provider, which drops every non-Langfuse span your application produces.
| Variable | Description |
|---|---|
OTEL_EXPORTER_OTLP_ENDPOINT | OTLP endpoint: your collector, or the Oodle OTLP endpoint for the direct path |
OTEL_EXPORTER_OTLP_HEADERS | Oodle authentication, direct path only |
OTEL_SEMCONV_STABILITY_OPT_IN | Set to gen_ai_latest_experimental to enable GenAI semantic conventions (not needed for Pydantic AI). Required for LiteLLM: without it the span carries no gen_ai.operation.name, and the Agent Observability traces list, which filters on that attribute, shows nothing |
OTEL_INSTRUMENTATION_GENAI_CAPTURE_MESSAGE_CONTENT | Captures prompt/response content. Python reads a mode name, so use span_and_event; the JavaScript instrumentation parses a boolean, so use true there. Not needed for Pydantic AI, which captures content by default |
OTEL_INSTRUMENTATION_GENAI_CAPTURE_MESSAGE_CONTENT captures full prompt and response text. This may include sensitive data. Review your organization's data policies before you enable it in production. On the direct path there is no collector to redact it.
5. Configure the OpenTelemetry Collector
Skip this step if you send data directly to Oodle.
Route traces and logs from your application to Oodle
through an OpenTelemetry Collector. The collector exports
to Oodle's OTLP endpoint, which serves the standard OTLP
paths (/v1/traces, /v1/logs):
receivers:
  otlp:
    protocols:
      http:
        endpoint: "0.0.0.0:4318"

processors:
  batch:
    timeout: 5s
    send_batch_size: 512

exporters:
  otlphttp/oodle:
    endpoint: "https://<OODLE_INSTANCE>-otlp.collector.oodle.ai"
    headers:
      "X-OODLE-INSTANCE": "<OODLE_INSTANCE>"
      "X-API-KEY": "<OODLE_API_KEY>"

service:
  pipelines:
    traces:
      receivers: [otlp]
      processors: [batch]
      exporters: [otlphttp/oodle]
    logs:
      receivers: [otlp]
      processors: [batch]
      exporters: [otlphttp/oodle]
Replace <OODLE_INSTANCE> and <OODLE_API_KEY> with your
credentials from Settings → API Keys in the Oodle UI
(ap1, us1).
See the OpenTelemetry integration guide for full collector and SDK configuration options.
6. Verify in Oodle
Navigate to GenAI > Traces (ap1, us1). Click on a trace to see the Transcript, Trace waterfall, and Costs breakdown.
If no spans arrive:
- JavaScript, no spans at all: confirm the SDK
initialization runs before the LLM client is required,
and that
openaiis below version 7. - Python with OpenAI,
ModuleNotFoundError: installhttpx. - Langfuse, no spans: confirm
LANGFUSE_PUBLIC_KEYandLANGFUSE_SECRET_KEYare set. - Langfuse spans counted twice: the application must
not add its own OTLP span processor as well as
LangfuseSpanProcessor. 401responses: checkX-API-KEYandX-OODLE-INSTANCE.
Demo Applications
The oodle-onboarding repository includes ready-to-run demos:
- llmops-otel-demo — Google Gemini with OTel instrumentation
- pydantic-ai-demo — Pydantic AI multi-agent example with tool use and structured outputs
- traceloop-demo — Traceloop (OpenLLMetry) SDK auto-instrumenting Google Gemini
- openlit-demo — OpenLIT with agents (LangGraph), guardrails, VectorDB (ChromaDB RAG), and MCP tool tracing
git clone https://github.com/oodle-ai/oodle-onboarding.git
cd oodle-onboarding/llmops-otel-demo
cp .env.example .env
# Edit .env with your OODLE_INSTANCE, OODLE_API_KEY, and GEMINI_API_KEY
make up
make test-chat
Each demo includes an OTel Collector and Docker Compose configuration — everything needed to see LLM traces in Oodle in minutes.
Cost Tracking
Once model definitions are configured, Oodle shows cost data on every LLM trace. The cost is calculated as:
cost = (input_tokens / 1,000,000) × input_price
     + (output_tokens / 1,000,000) × output_price
For parent spans (agent invocations), Oodle aggregates token counts from child LLM spans and shows the total estimated cost. See the Model Definitions page for pricing configuration.
Support
If you need assistance or have any questions, please reach out to us through:
- Email at [email protected]