OpenAI Codex
OpenAI Codex has native OpenTelemetry support. Once enabled, Oodle collects metrics and event logs and turns them into use-case dashboards covering adoption, token consumption, tool behavior, and performance and reliability across your organization.
Getting Started
1. Enable Telemetry
The fastest way is to use the integration tile in the Oodle UI:
- Navigate to Settings → Integrations
- Open the AI Observability section
- Click the Codex Observability tile
- Select an API key and follow the steps shown
Alternatively, add the following to your Codex
configuration file (~/.codex/config.toml):
#:schema https://developers.openai.com/codex/config-schema.json

[otel]
environment = "production"
log_user_prompt = true

exporter = { otlp-http = {
  endpoint = "https://<LOGS_ENDPOINT>/ingest/otel/v1/logs",
  protocol = "binary",
  headers = {
    "X-API-KEY" = "<API_KEY>",
    "X-OODLE-INSTANCE" = "<INSTANCE_ID>",
  },
}}

metrics_exporter = { otlp-http = {
  endpoint = "https://<METRICS_ENDPOINT>/v2/otlp/metrics/<INSTANCE_ID>",
  protocol = "binary",
  headers = {
    "X-API-KEY" = "<API_KEY>",
    "X-OODLE-INSTANCE" = "<INSTANCE_ID>",
  },
}}
Replace <METRICS_ENDPOINT>, <API_KEY>, and
<INSTANCE_ID> with values from the integration tile.
The integration tile in the Oodle UI generates a
ready-to-copy config.toml with the correct
endpoints and API key pre-filled.
Alternative: Environment Variables
For quick testing you can export the standard OpenTelemetry variables directly in your shell:
export OTEL_EXPORTER_OTLP_PROTOCOL=http/protobuf
export OTEL_EXPORTER_OTLP_METRICS_ENDPOINT=https://<METRICS_ENDPOINT>/v2/otlp/metrics/<INSTANCE_ID>
export OTEL_EXPORTER_OTLP_LOGS_ENDPOINT=https://<LOGS_ENDPOINT>/ingest/otel/v1/logs
export OTEL_EXPORTER_OTLP_HEADERS="X-API-KEY=<API_KEY>, X-OODLE-INSTANCE=<INSTANCE_ID>"
export OTEL_LOG_USER_PROMPTS=1
export OTEL_METRIC_EXPORT_INTERVAL=10000
export OTEL_LOGS_EXPORT_INTERVAL=5000
2. Roll Out to Your Team
Commit the config.toml above to your dotfiles
repository or place it in each developer's
~/.codex/ directory via your configuration
management tool.
3. Verify Data
Once telemetry starts flowing, navigate to AI Cost Management → Codex in the Oodle sidebar.
Dashboards
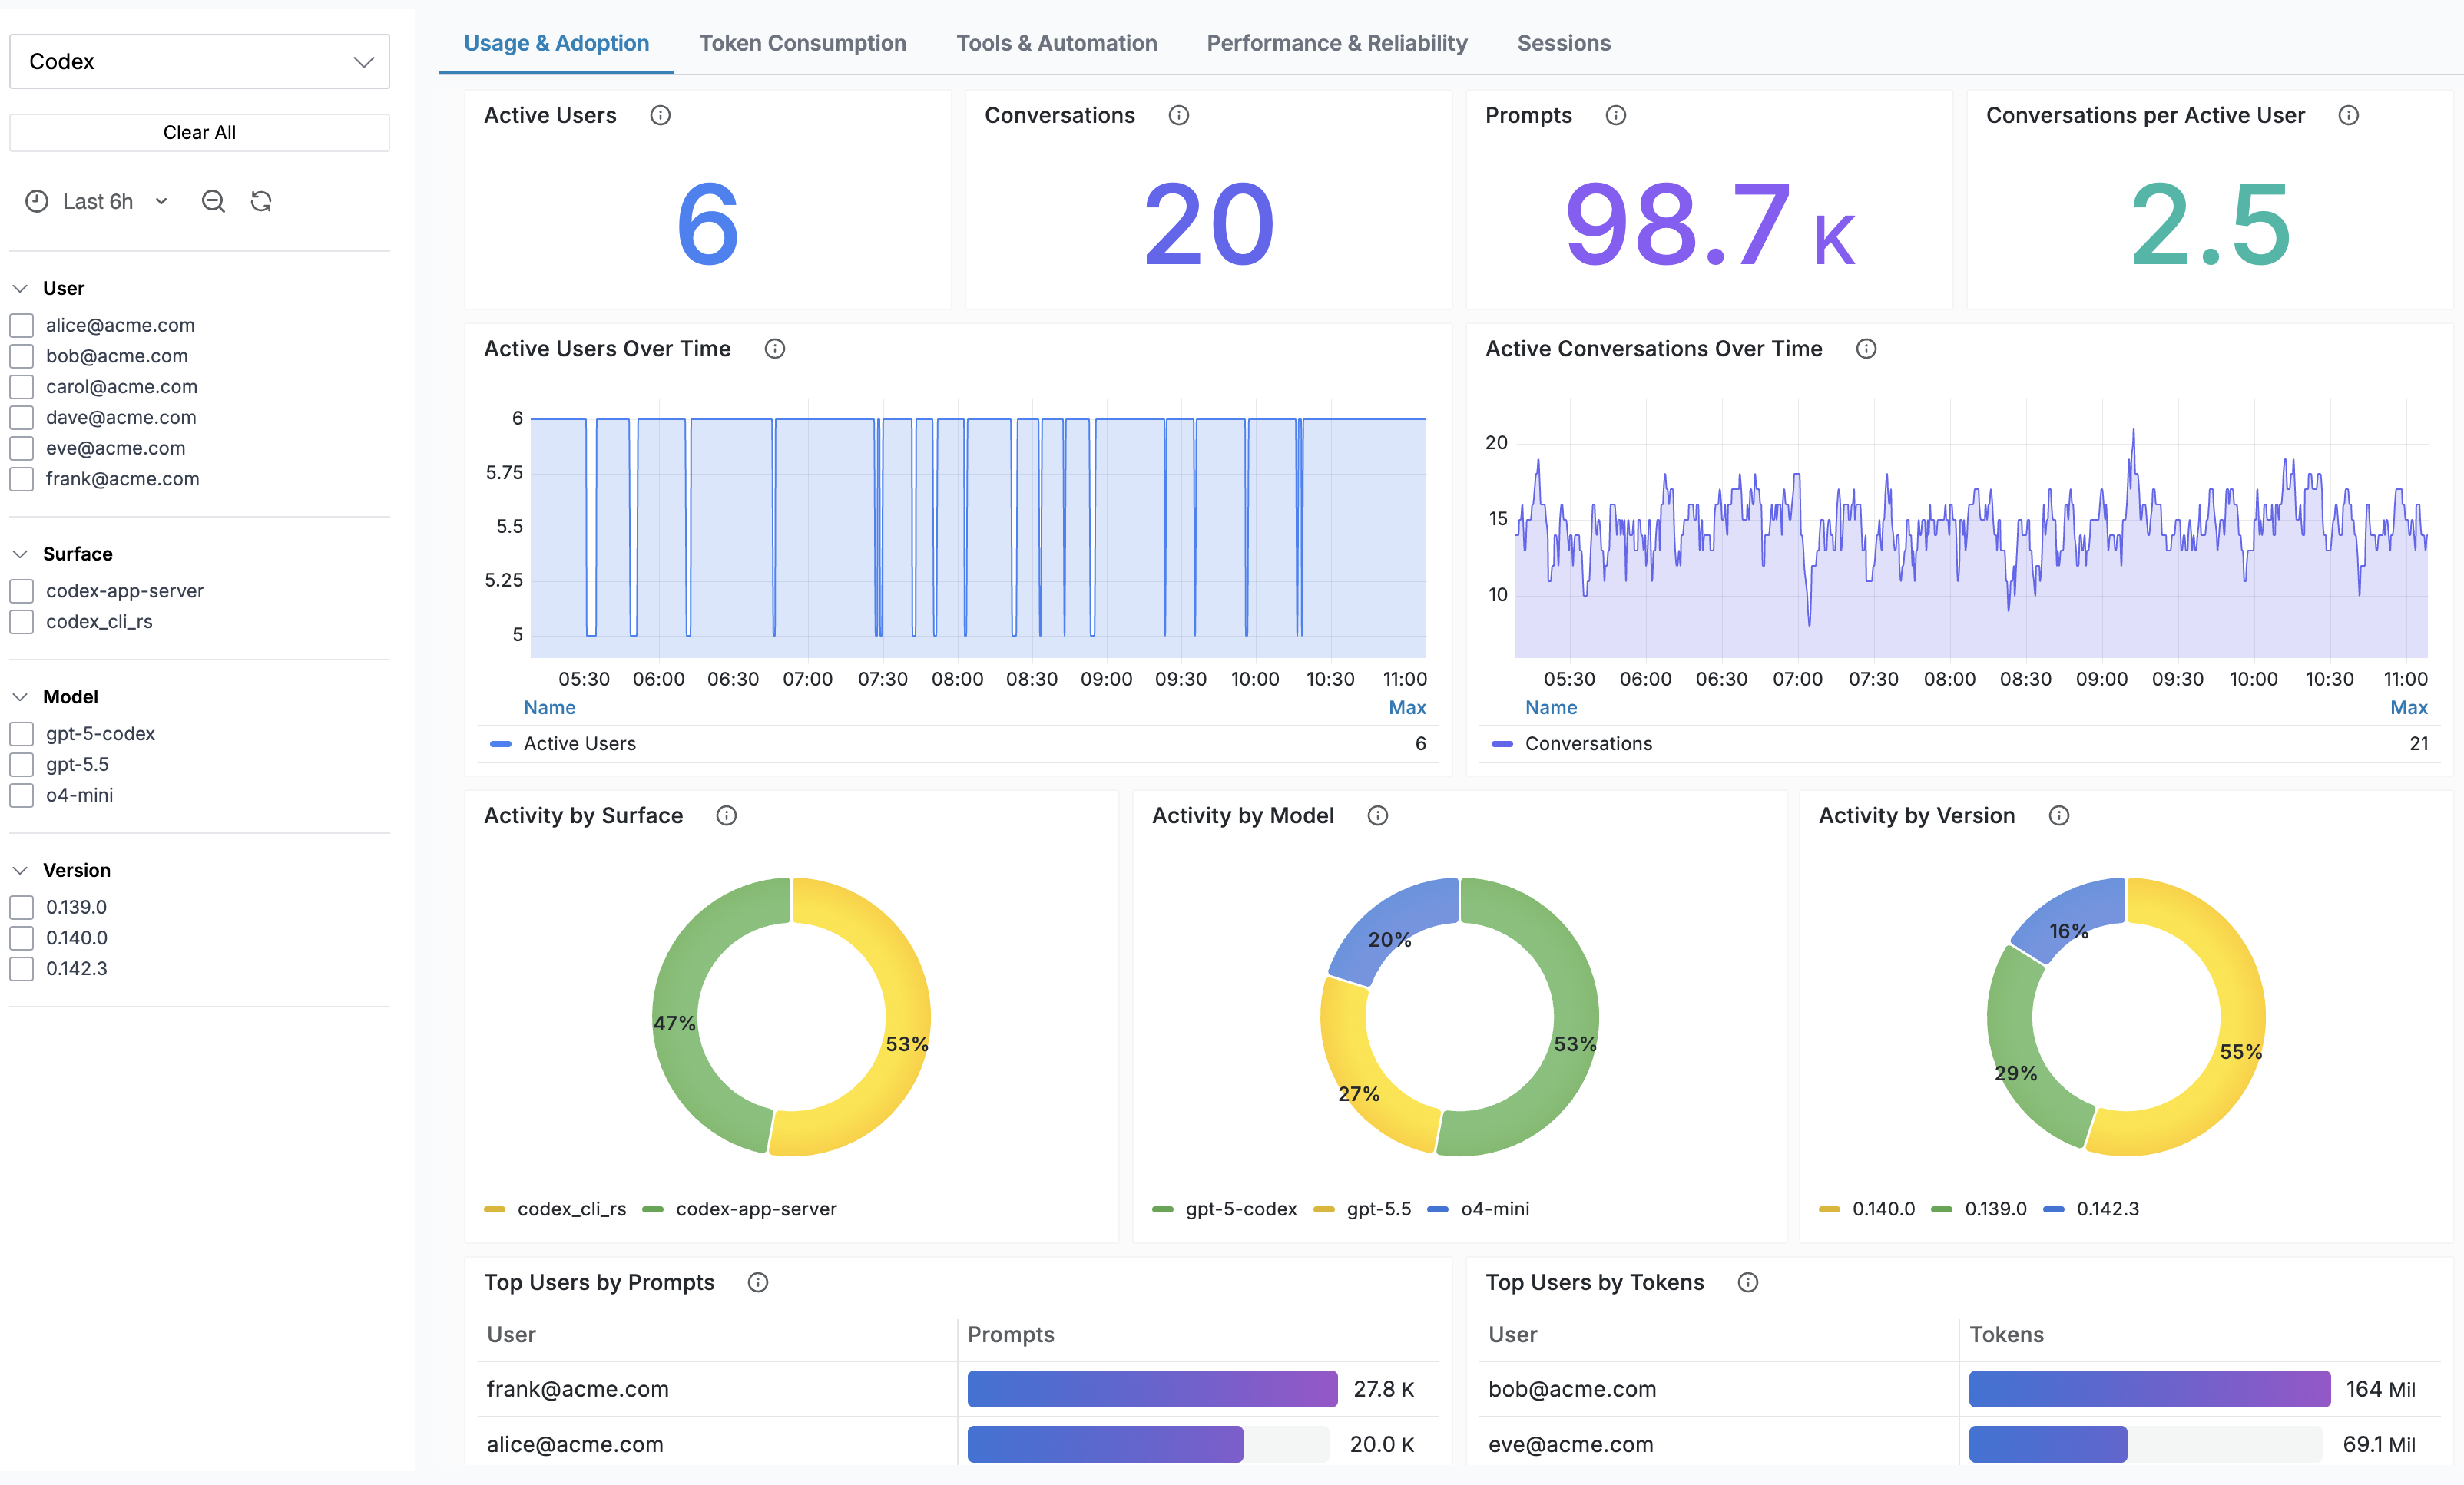
The Codex analysis page is organized around the questions engineering leadership asks of a coding agent. Each tab embeds a dashboard that leads with headline numbers, followed by trends and ranked breakdowns.
Usage and Adoption
Is the team using it?
| Panel | Description |
|---|---|
| Active Users | Distinct engineers who ran Codex |
| Conversations | Distinct Codex conversations, plus conversations per active user |
| Prompts | User prompts submitted |
| Activity Trends | Active users and conversations over time |
| Surface / Model / Version Mix | Where activity runs: the IDE/app backend vs the terminal CLI, model share, and version adoption |
| Top Users | Engineers ranked by prompts and tokens |
Token Consumption
Token volume is the primary driver of Codex spend, so this tab is the budget view.
| Panel | Description |
|---|---|
| Total Tokens | Aggregate token usage, the headline consumption number |
| Tokens per Active User / per Conversation | Unit consumption for capacity and seat modeling |
| Cached Input Rate | Share of input context served from cache, with health thresholds. Higher is cheaper |
| Token Breakdown | Usage by token type (input, output, cached, reasoning), model, surface, and version |
| Top Users and Sessions | Highest-consumption engineers and conversations |
| Prompt Economics | Average prompt size and total tokens consumed per prompt |
Use the Token Type dashboard filter to isolate a category (input, output, cached_input, reasoning_output).
Tools and Automation
Is the agent working well?
| Panel | Description |
|---|---|
| Tool Calls | Invocation volume and distinct tools used |
| Tool Success Rate | Share of tool calls that succeeded, with health thresholds |
| Avg Tool Duration | Mean execution time, overall and per tool |
| Per-tool Trends and Leaderboards | Calls, failures, and latency ranked by tool |
| MCP Servers | External integration usage grouped by MCP server |
Performance and Reliability
Codex exports rich latency telemetry, so this tab answers how fast and stable the agent feels.
| Panel | Description |
|---|---|
| Avg Time to First Token | How long users wait before Codex starts responding, with health thresholds |
| Avg Turn Duration | End-to-end latency per turn |
| WebSocket Success Rate | API transport health, with health thresholds |
| Latency Trends | Time to first token / first message and turn duration over time |
| Startup Latency | Prewarm and shell snapshot times from launch to a usable session |
| Per-model Latency | Time to first token and turn duration ranked by model |
This tab is built on Codex's native metrics, which carry model, originator, and version dimensions; use its dashboard filters to slice by those.
Sessions
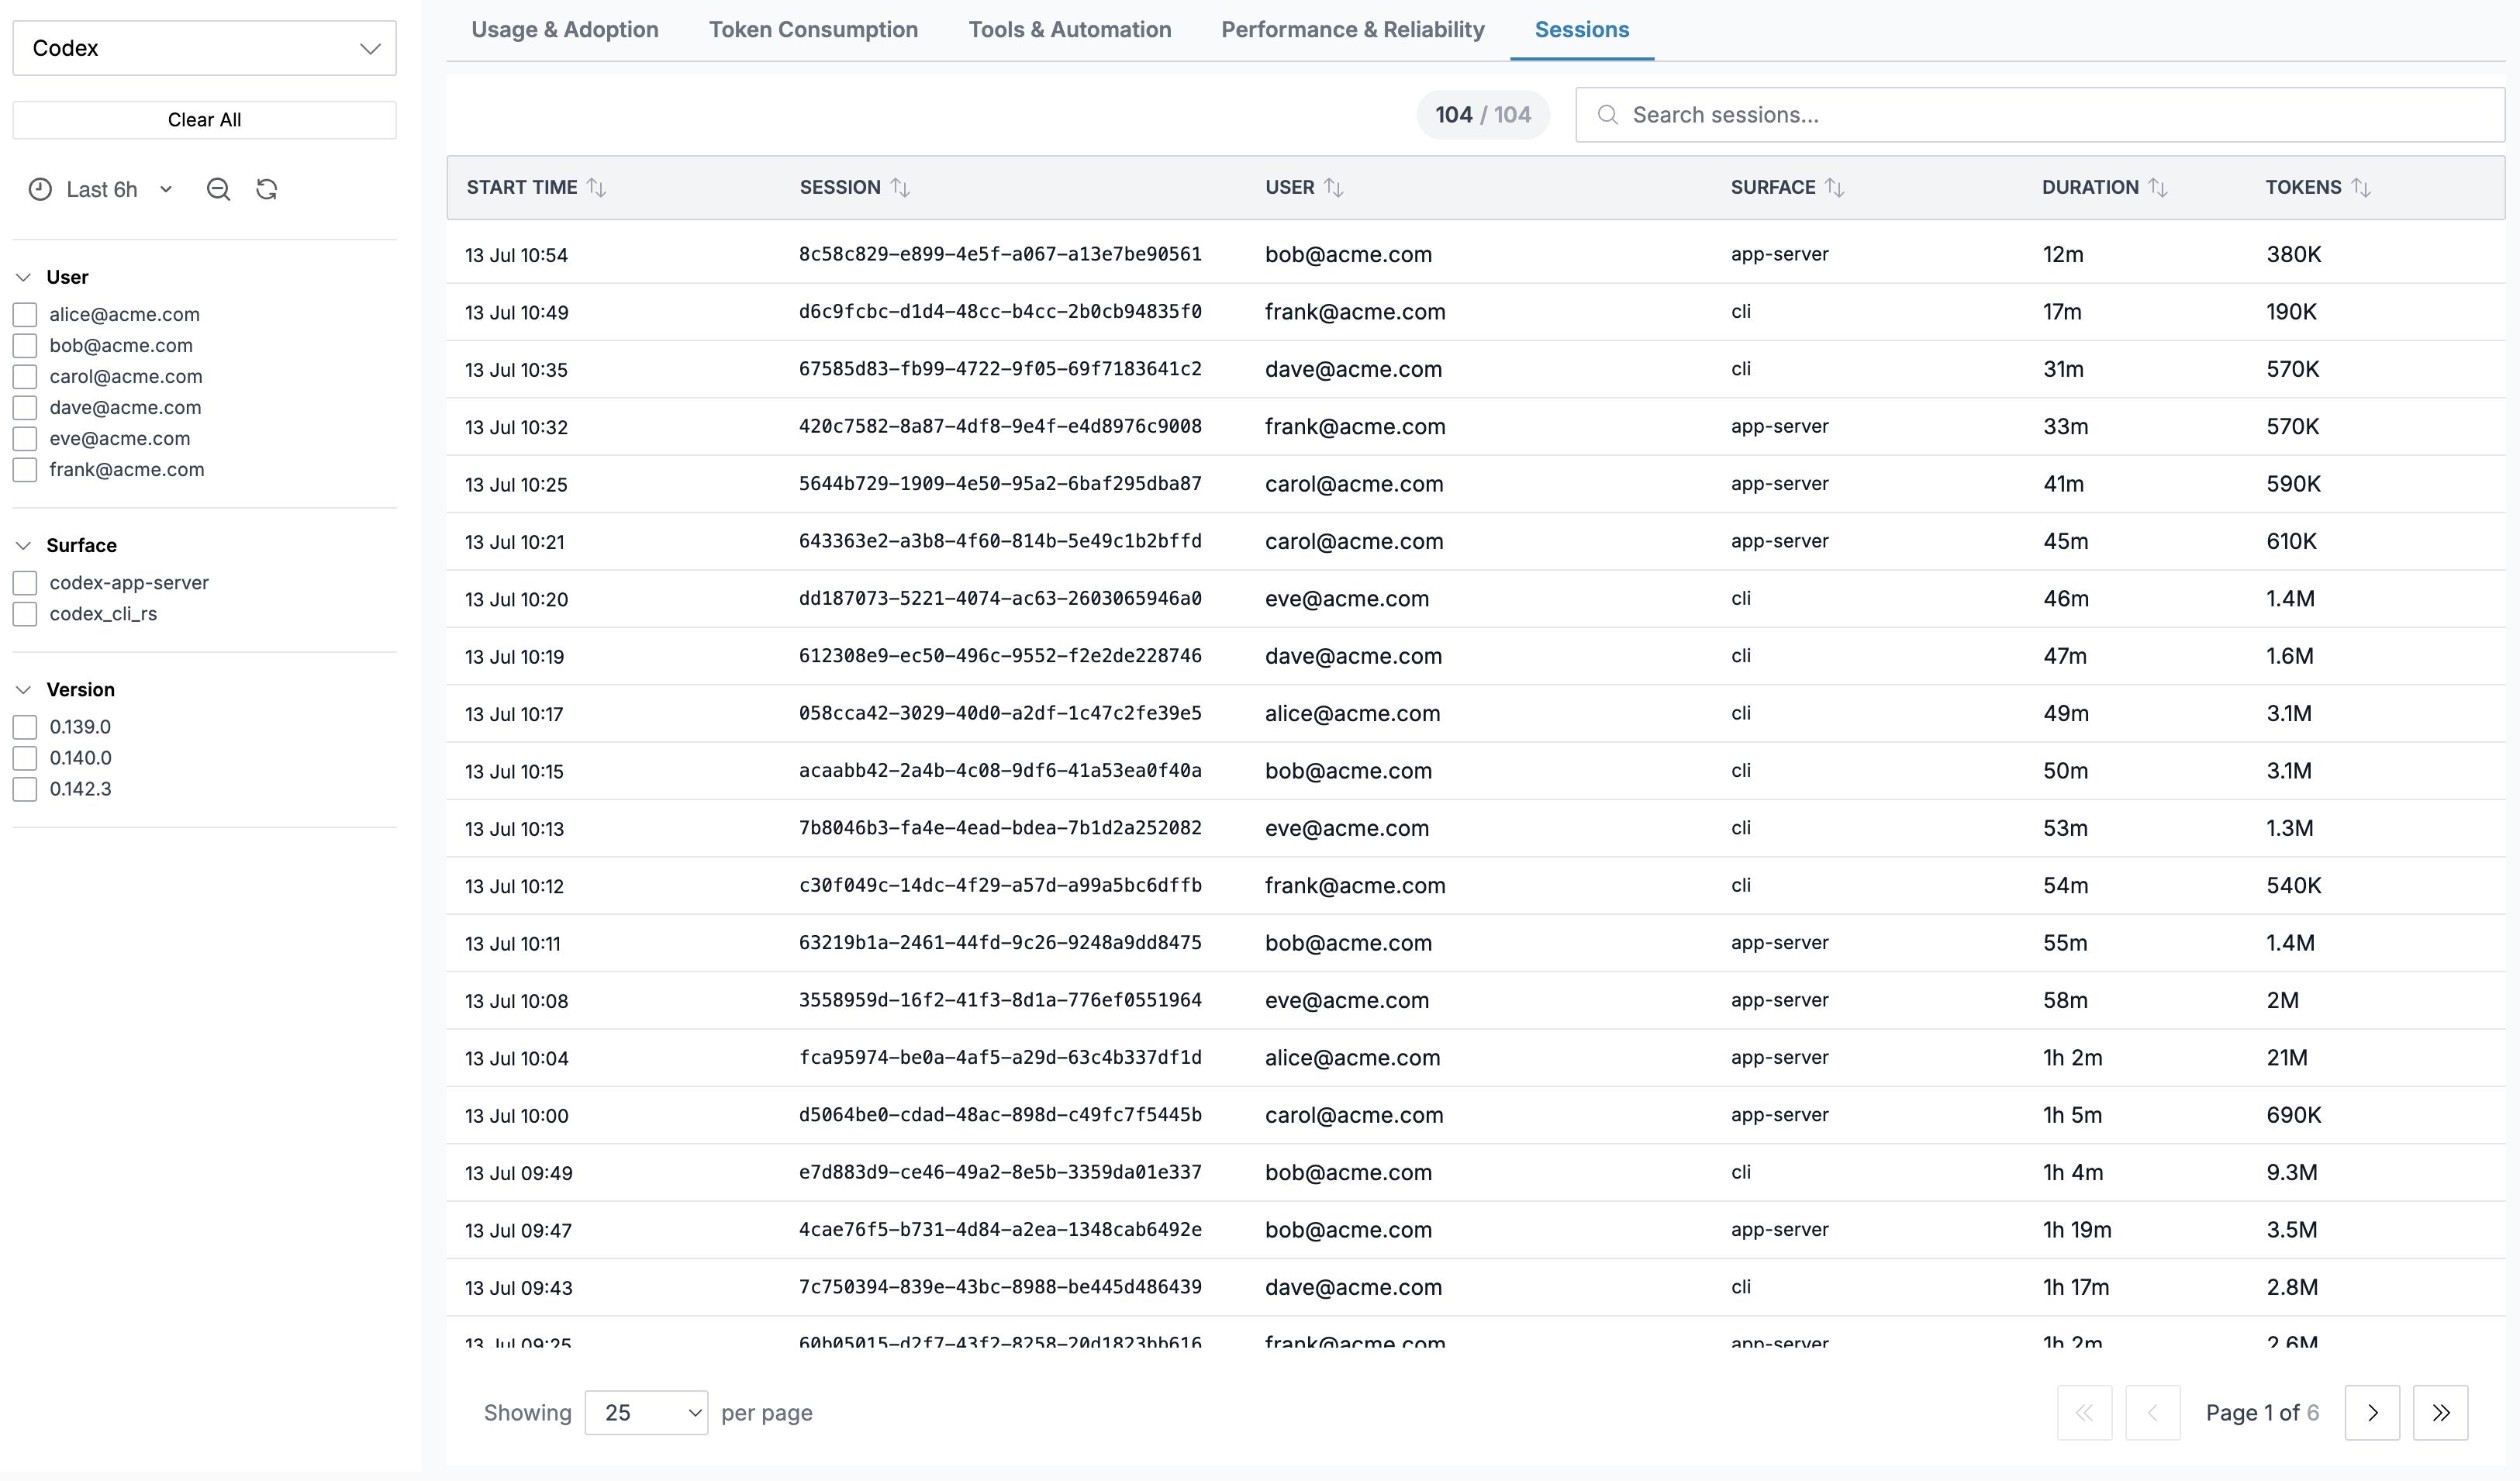
The Sessions tab shows individual Codex sessions:
| Column | Description |
|---|---|
| Start Time | When the session began |
| Session | Codex conversation ID |
| User | Email of the developer |
| Surface | Where Codex ran: app-server (IDE/extension) or cli (terminal) |
| Duration | Wall-clock duration |
| Tokens | Total tokens (input + output + cached) |
Click any row to open a Session Detail drawer showing a turn-by-turn timeline of every event.
Session Detail Drawer
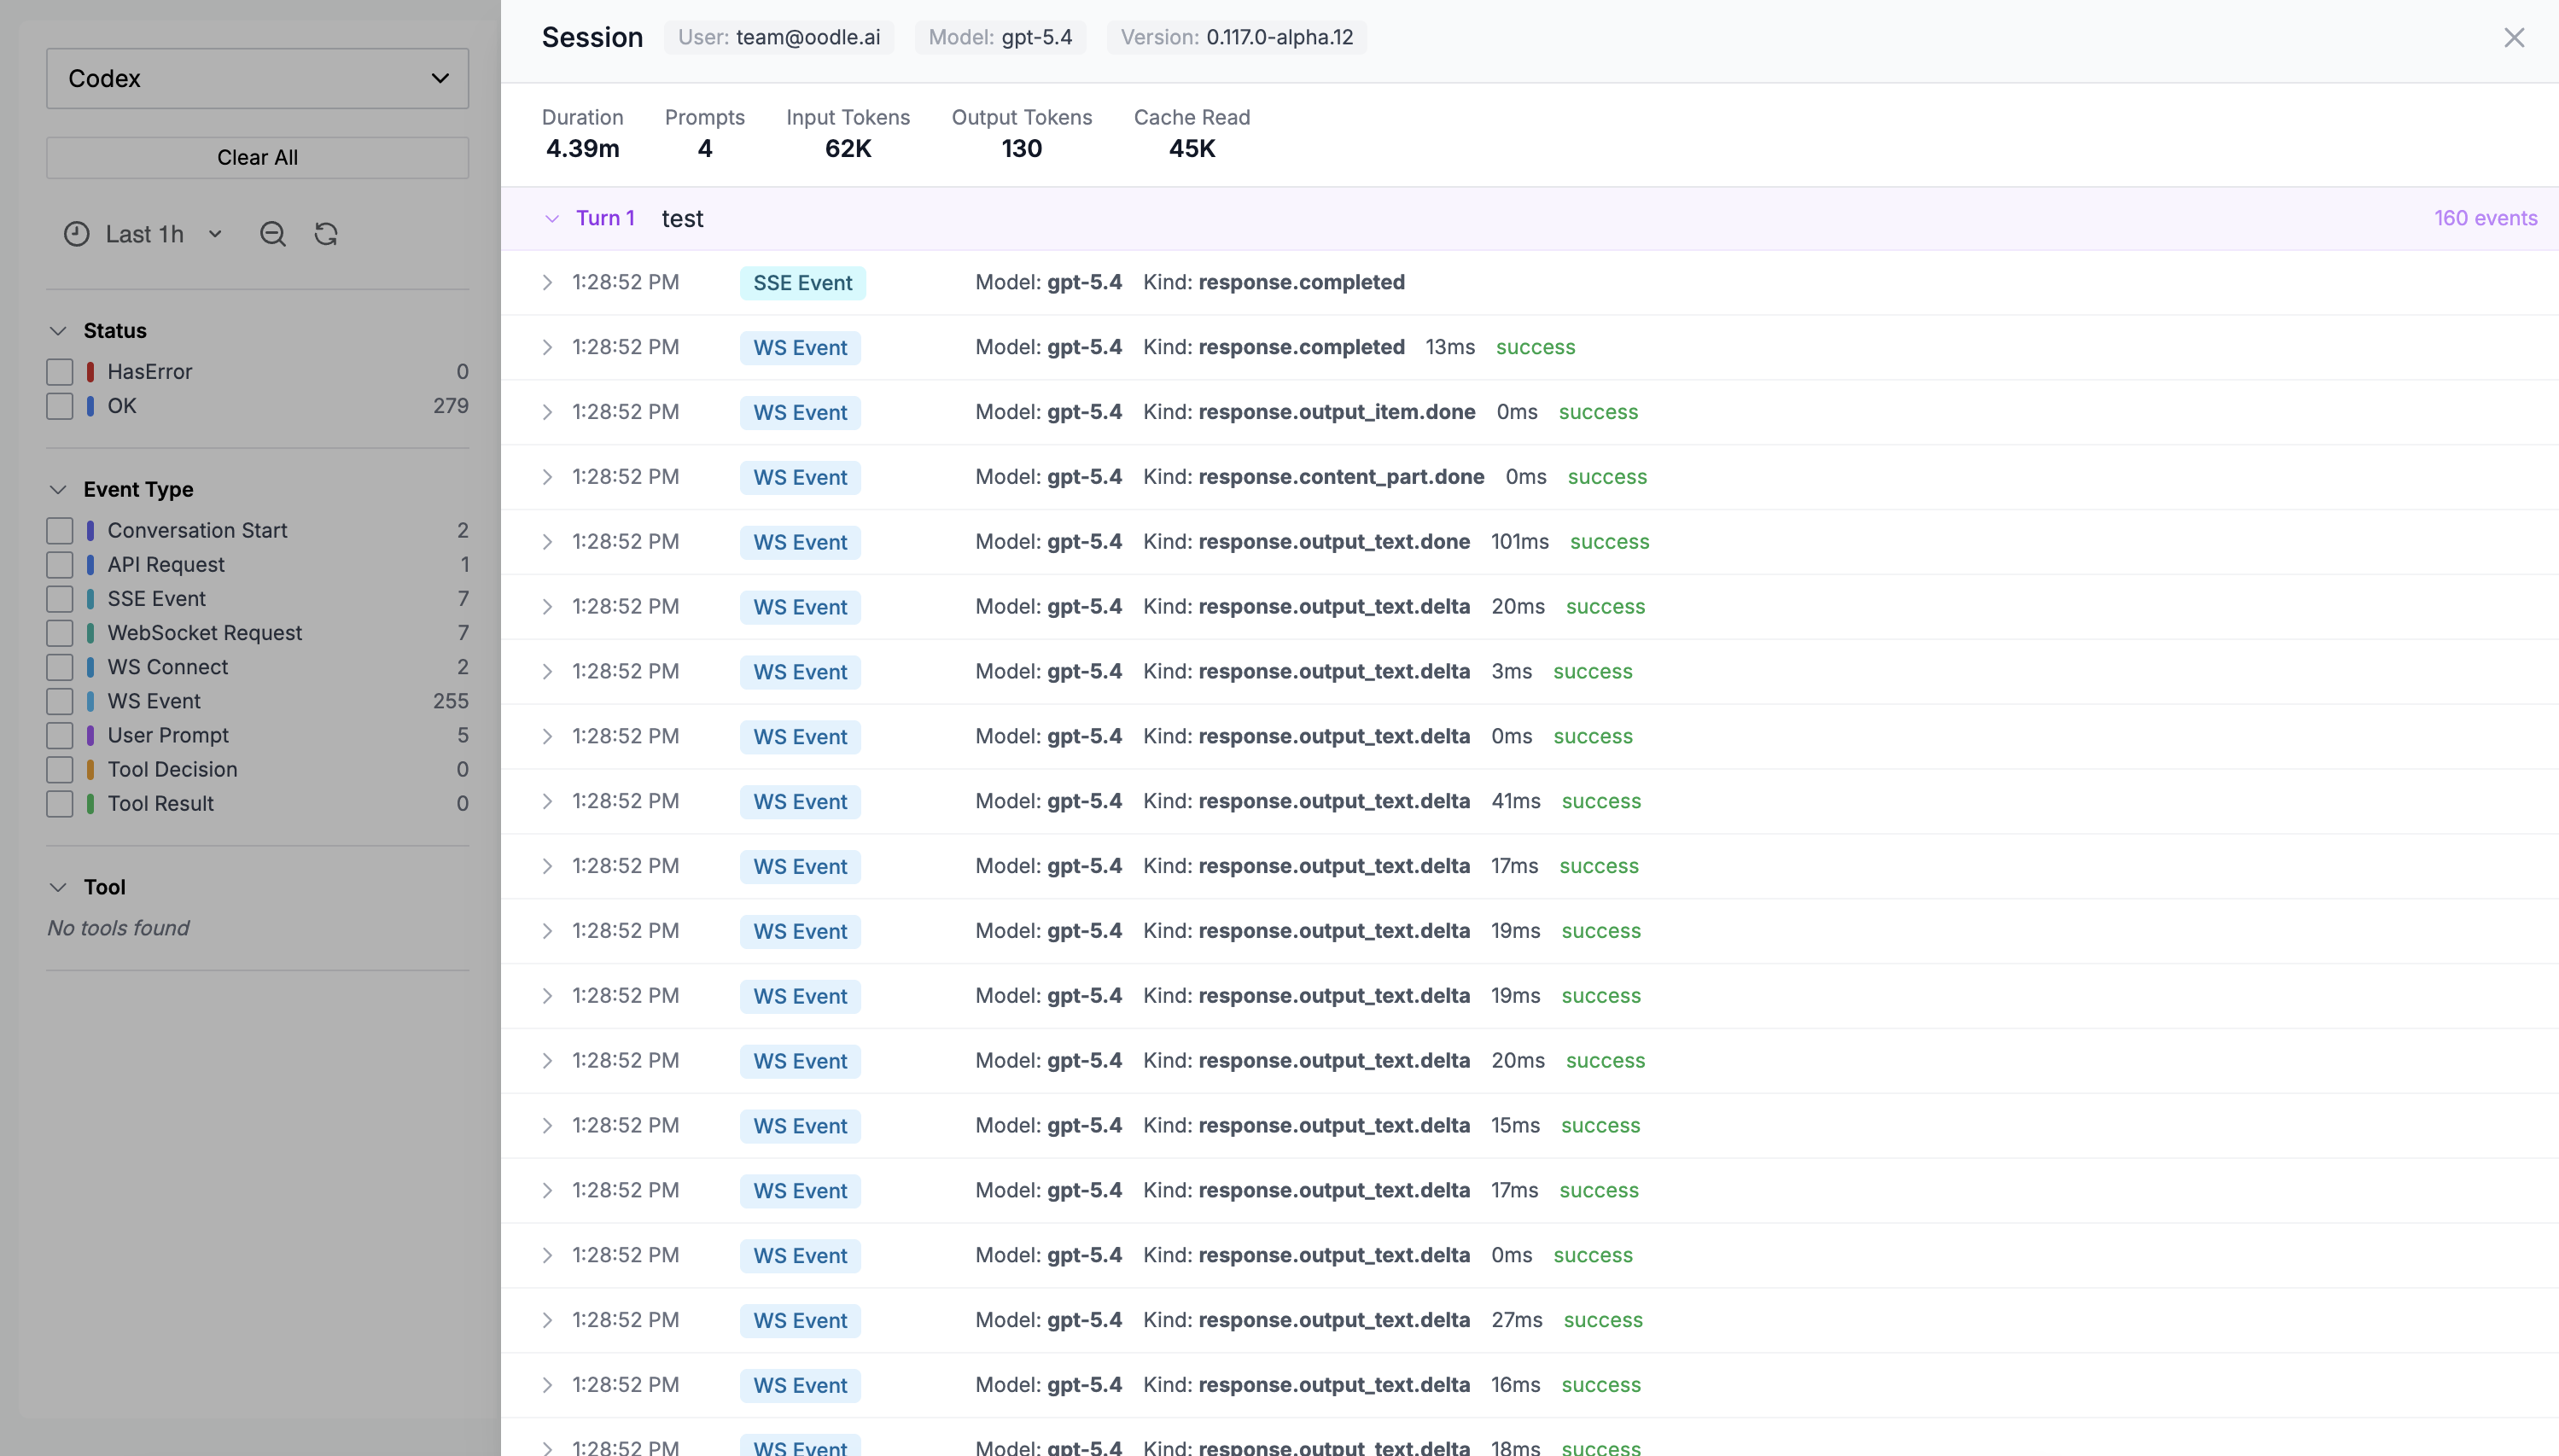
The drawer displays:
- Session metadata: user, model, app version
- Aggregated stats: tokens, tool calls, errors, duration (only populated fields are shown)
- Turn-by-turn timeline: each turn is collapsible and shows individual events (SSE events, WebSocket events, tool calls). Every event row is expandable to reveal the full raw JSON payload.
What Gets Collected
Metrics
Codex exports the following as OpenTelemetry metrics (delta temporality):
| Metric | Extra Labels | Description |
|---|---|---|
codex_turn_token_usage | token_type | Token count by type (input, output, cached, reasoning, total) |
codex_thread_started | none | Conversations started |
codex_turn_tool_call | none | Tool invocations per turn |
codex_websocket_request | success | WebSocket API requests |
codex_turn_e2e_duration_ms | none | End-to-end turn latency |
codex_turn_ttft_duration_ms | none | Time to first token |
codex_turn_ttfm_duration_ms | none | Time to first message |
codex_websocket_event_duration_ms | none | WebSocket event processing time |
codex_startup_prewarm_duration_ms | none | Startup prewarm latency |
codex_shell_snapshot_duration_ms | none | Shell snapshot capture latency |
codex_turn_network_proxy | none | Turns routed through the network proxy |
All native metrics carry model, originator, and
app_version. These power the Performance and
Reliability dashboard.
Oodle also derives session-level metrics from the
event logs below: oodle_logs_codex_token_usage
(tokens keyed by conversation, user, model, surface,
version, and token type), oodle_logs_codex_tool_count
and oodle_logs_codex_tool_duration_ms (per-tool
activity with MCP server and success dimensions), and
oodle_logs_codex_prompt_length_bytes (prompt sizes).
These power the Usage and Adoption, Token Consumption,
and Tools and Automation dashboards plus the Sessions
tab, and they honor the sidebar User and Surface
filters.
Events (Logs)
Events are exported via the OpenTelemetry logs
protocol. Each event has an
attributes.event.name field:
| Event Type | Key Attributes |
|---|---|
codex.conversation_starts | Conversation ID, model, user email |
codex.sse_event | Model, event kind, token counts, duration |
codex.websocket_event | Model, event kind, duration, success |
codex.websocket_request | Model, duration, success |
codex.websocket_connect | Model, duration |
codex.user_prompt | Prompt text, prompt length |
codex.tool_decision | Tool name, decision, source |
codex.tool_result | Tool name, success, duration, error |
Events are grouped by conversation.id to reconstruct
the turn-by-turn timeline on the Sessions tab.
Further Reading
Support
If you need assistance or have any questions, please reach out to us through:
- Email at [email protected]