Grafana
To make migration from Grafana to Oodle easier, we support importing your existing Grafana Dashboards, Alerts, and Datasources into Oodle automatically.
Import Grafana Dashboards, Alerts, and Datasources

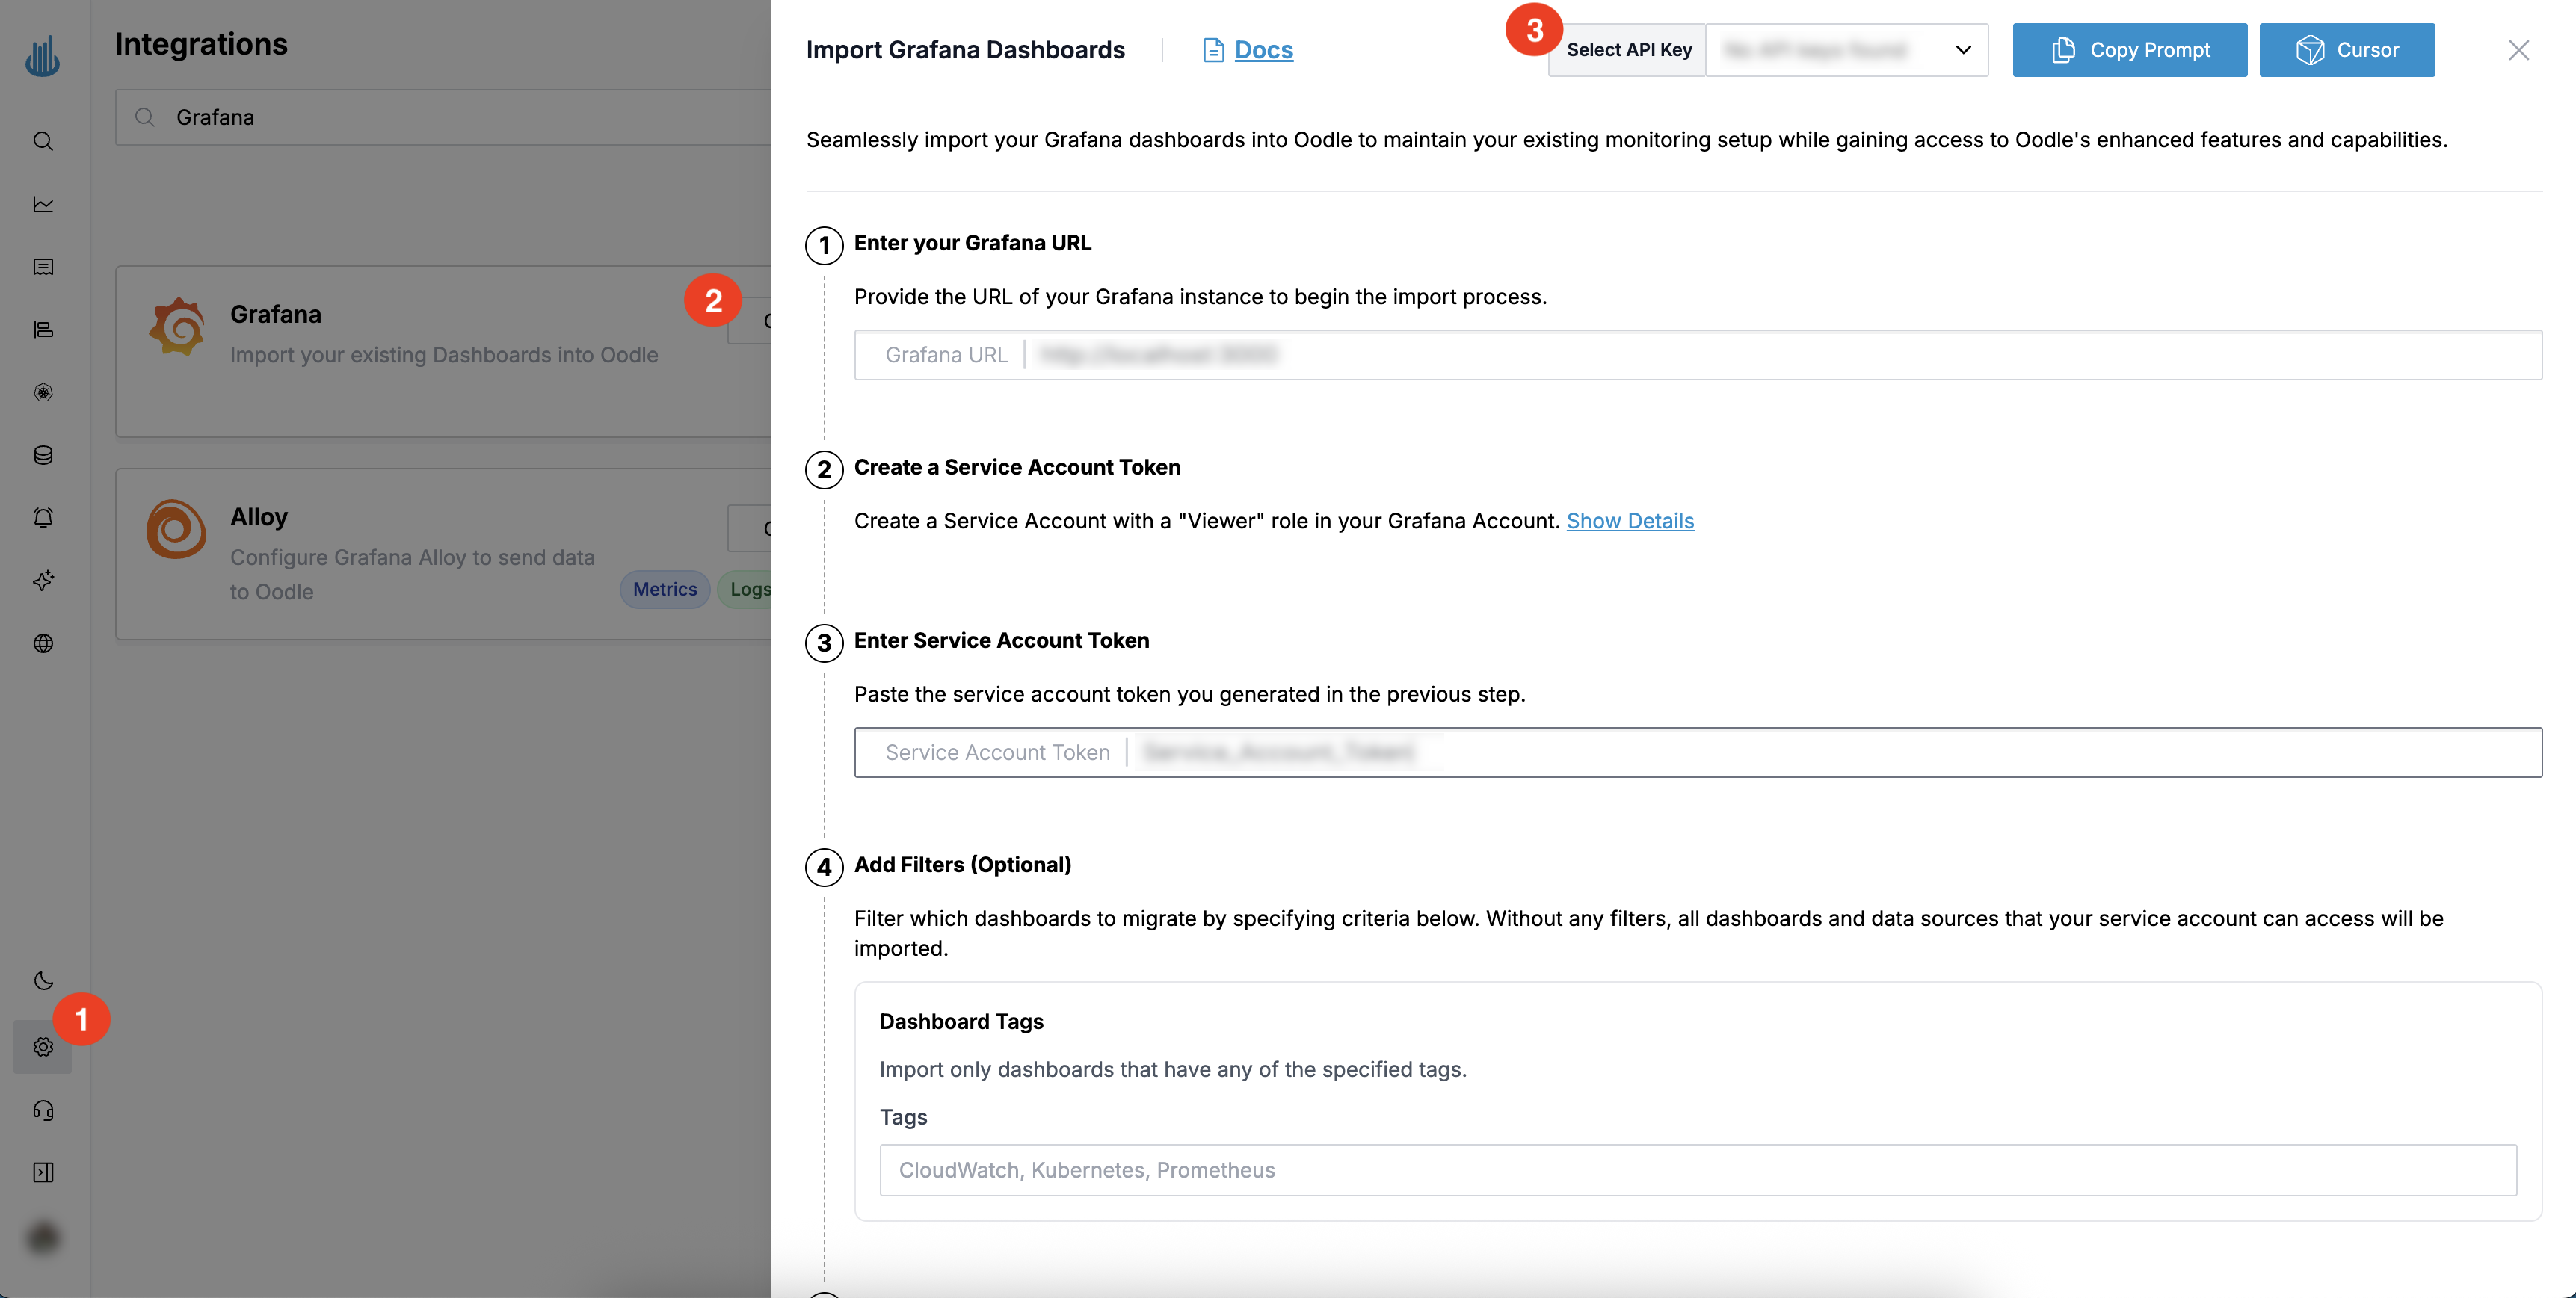
You can find the Grafana import steps by doing the following:
- Login to the Oodle UI, then navigate to Settings page
- Click on the Grafana tile
- Choose an appropriate API key from the list on top of the drawer
You will be required to provide your Grafana instance URL and a Service Account Token with an Admin role to read your Dashboards, Datasources, and Alerts.
Please refer to the Grafana documentation on how to create a Service Account Token with the Admin role.
Once you have provided the required information, click on Import to start the
import process. Oodle will import your existing Dashboards, Alerts, and
Datasources into your Oodle account and will provide a report on the import
status. The status of the tile will change to Imported once this process is
complete.
Dashboards
Your Grafana dashboards will be imported with their panels, queries, and folder structure preserved. You can view and manage imported dashboards from the Dashboards tab after import.
Alerts
Alert rules configured in Grafana will be imported and can be managed from the Alerts tab. Review the imported alerts to ensure they are configured correctly for your Oodle environment.
Datasources
Datasource configurations will be imported and mapped to equivalent Oodle datasources where possible. You can review and manage imported datasources from the Data Sources tab.
Other Migration Options
Looking to migrate from other platforms? Check out these guides:
- Alertmanager Alerts - Import alert rules and notification routes from Prometheus/Alertmanager
Support
If you need assistance or have any questions, please reach out to us through:
- Email at [email protected]