AWS CloudWatch
Oodle supports ingesting Amazon CloudWatch metrics and logs.
Setup
-
Open
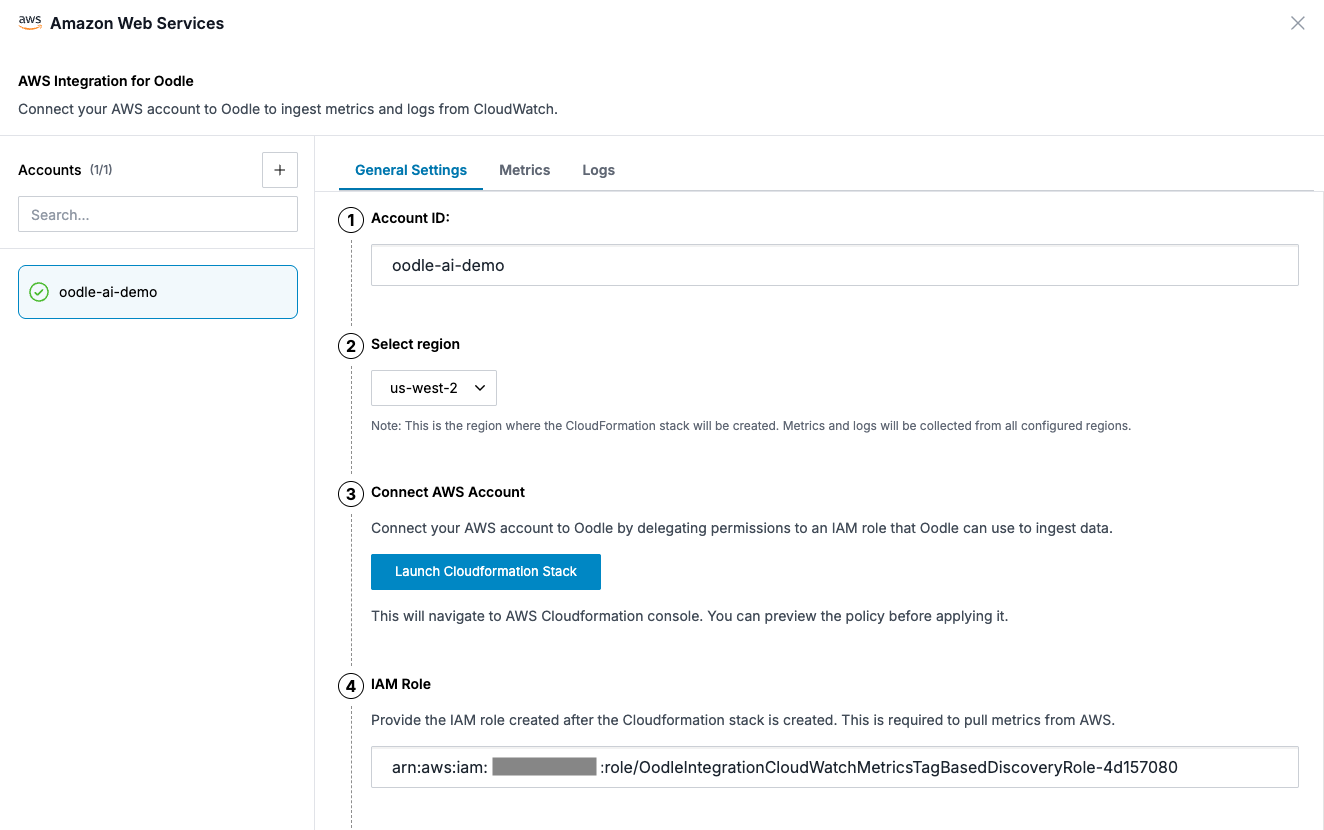
Settings->Integrationspage in Oodle UI. -
Choose
Amazon Web Servicesintegration tile. -
Select the appropriate API key from the dropdown at the top of the drawer

-
Add your AWS account by entering AWS account ID and launching the Cloudformation Stack. The Cloudformation stack creates an IAM role to provide Oodle access to your AWS account
-
Configure metrics to be collected in the Metrics tab. You can filter for specific AWS services and also via tags to filter within a AWS service.
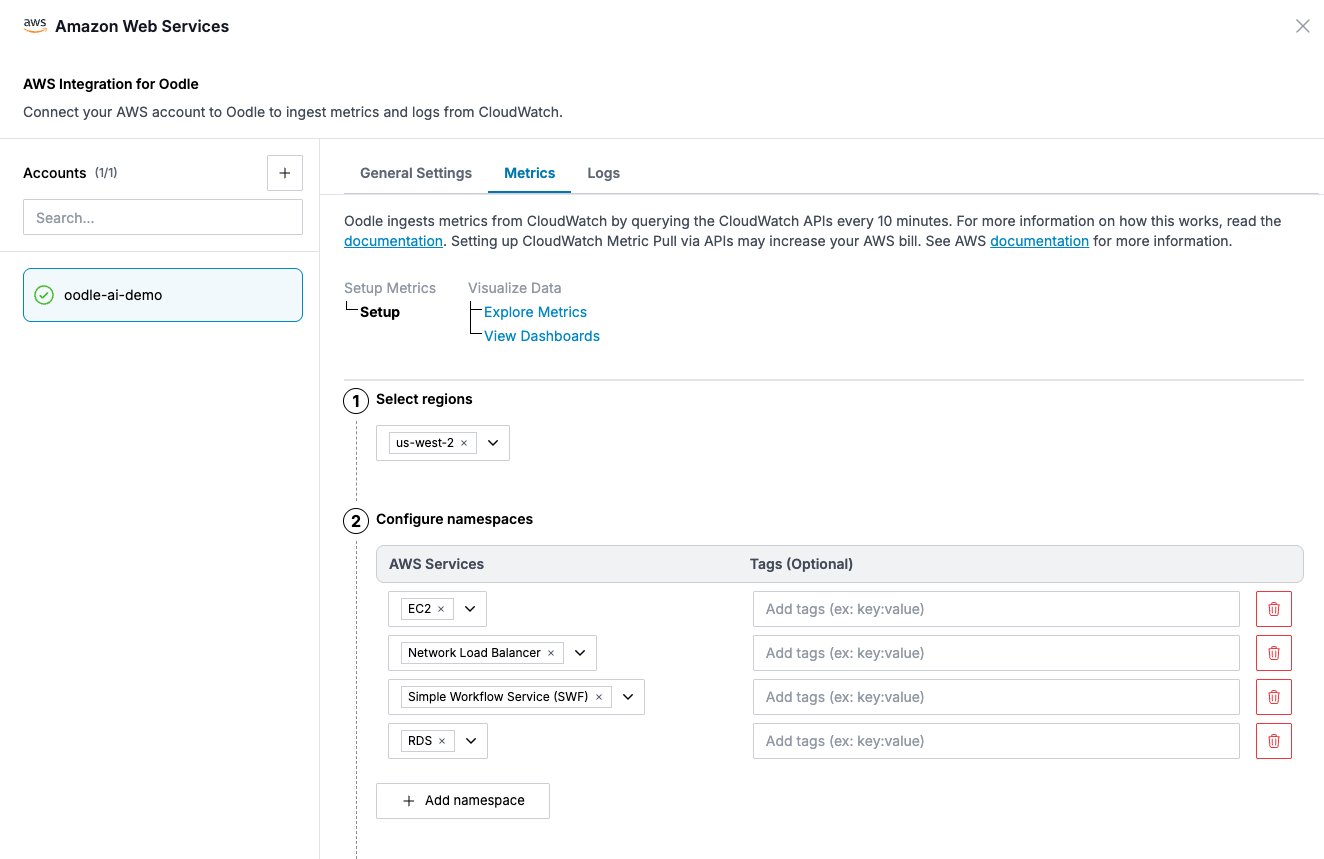
Oodle pre-configures dashboards for your selected services.
-
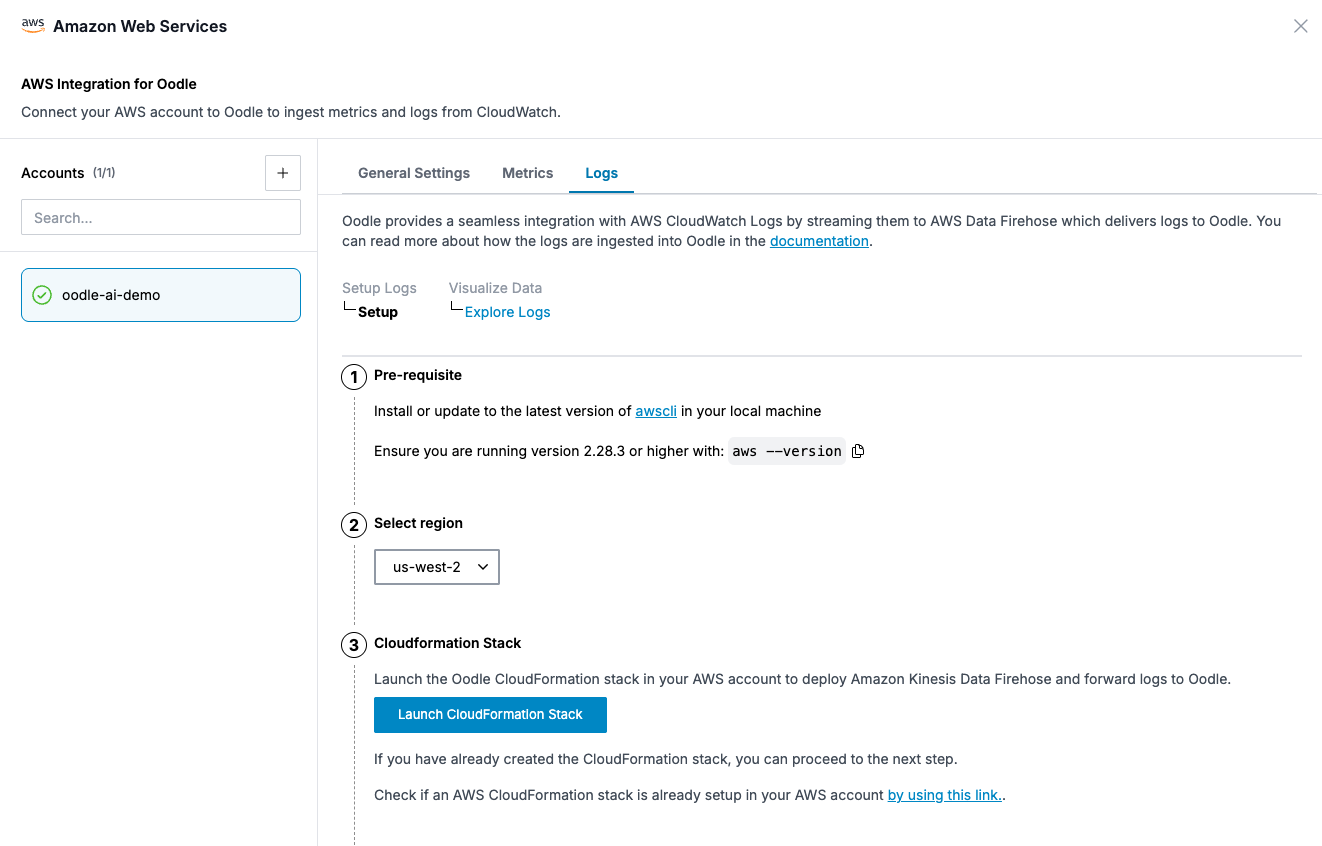
Configure CloudWatch logs to be collected in the Logs tab by following the instructions.
Visualize CloudWatch metrics from API Integration
After setting up the data source, you can visualize your CloudWatch metrics in Oodle. Under your AWS account - open the Metrics tab, go to Explore Metrics
and choose your newly added CloudWatch data source. You should now be able to query and visualize your metrics.
Metrics Streaming Integration
CloudWatch Metric Streams allows you to continually stream CloudWatch metrics to Oodle, with near-real-time delivery and low latency (3-5 minutes). This streaming integration is powered by Amazon CloudWatch Metric Streams and Amazon Kinesis Data Firehose.
Set up Metrics Streaming
-
We'll set up CloudWatch streaming and Amazon Kinesis Firehose using a CloudFormation template. Download the template from this link
-
Each AWS service has its own namespace and set of metrics. Here are some common AWS services and their namespaces:
- AWS/EC2: EC2 instance metrics like CPUUtilization, NetworkIn/Out, DiskReadOps/WriteOps
- AWS/RDS: Database metrics including DatabaseConnections, ReadIOPS, WriteIOPS, CPUUtilization
- AWS/ECS: Container metrics like CPUUtilization, MemoryUtilization, NetworkRxBytes/TxBytes
- AWS/DynamoDB: Database metrics including ConsumedReadCapacityUnits, ConsumedWriteCapacityUnits
- AWS/ApplicationELB: Load balancer metrics including RequestCount, TargetResponseTime, HTTPCode_Target_2XX_Count
You can identify the namespaces you want to monitor using one of these methods:
a. List all namespaces in your AWS account using the AWS CLI:
aws cloudwatch list-metrics --output json | jq -r '.Metrics[].Namespace' | sort -ub. View specific namespaces by opening your All Metrics page in CloudWatch to see a list of all available namespaces for the services you are using
Choose the namespaces based on the AWS services you want to monitor. The corresponding metrics for those namespaces will be streamed to Oodle.
For more details on available metrics for each service, see Viewing available metrics in the AWS CloudWatch documentation.
-
Once you have identified the namespaces, modify the template downloaded in step 1 to specify which CloudWatch namespaces you want to monitor by adding them to the
MetricsStream.Properties.IncludeFiltersarray. Example:
MetricStream:
    Type: AWS::CloudWatch::MetricStream
    Properties:
      .
      .
      .
      IncludeFilters:
        - Namespace: AWS/GlobalAccelerator
        - Namespace: AWS/NetworkELB
        - Namespace: AWS/ECS
        - Namespace: AWS/DynamoDB
        - Namespace: ECS/ContainerInsights
        - Namespace: AWS/ElastiCache
        - Namespace: AWS/ES
This example will stream metrics from Global Accelerator, Network Load Balancer, Amazon ECS, DynamoDB, ECS Container Insights, ElastiCache, and Elasticsearch Service to Oodle.
-
To run the template, you will need two parameters:
- OodleHttpEndpoint - The URL to send metrics to
- OodleApiKey - The API key for authentication
Navigate to the integrations page in your Oodle account and click the "View API Key" button in the top right to find the instance name and API key. You can use the following URL for OodleHttpEndpoint:
https://{OODLE_INSTANCE}.collector.oodle.ai/v1/aws/${OODLE_INSTANCE}/metrics -
Deploy the CloudFormation template in your AWS account using the AWS Console, AWS CLI, or AWS SDK. Use the parameters from the previous step. For detailed instructions on creating a CloudFormation stack using the AWS Console, see Creating a stack on the AWS CloudFormation console.
Note: To add additional namespaces for monitoring later, you can modify the template directly through the AWS Console using Infrastructure Composer. For detailed instructions, see Working with AWS CloudFormation Templates.
Visualize CloudWatch Metrics from Metric Streaming
After setting up metric streaming, you can visualize your CloudWatch metrics in Oodle:
- Go to
Explore Metrics - Choose Oodle data source
- Query and visualize your metrics
CloudWatch metrics are translated to Oodle metric names following this template:
amazonaws_com_{namespace}_{metricName}_{aggregation}
Note: Forward slashes (/) in the namespace are converted to underscores (_)
For example, the CloudWatch metric:
- Namespace:
AWS/ECS(becomesAWS_ECS) - Metric Name:
CPUUtilization
Gets translated to these Oodle metrics:
amazonaws_com_AWS_ECS_CPUUtilization_sum- Sum aggregationamazonaws_com_AWS_ECS_CPUUtilization_count- Count aggregationamazonaws_com_AWS_ECS_CPUUtilization_quantile{quantile="0"}- Minimum valueamazonaws_com_AWS_ECS_CPUUtilization_quantile{quantile="1"}- Maximum value
Billing Considerations for Metric Streaming
While Oodle does not charge extra for metric streaming, AWS pricing is based on metric updates and associated services. Each metric update includes four default statistics (Minimum, Maximum, Sample Count, and Sum). You will also incur Amazon Kinesis Data Firehose charges for data ingestion. For detailed pricing information, please refer to the "Metric streams" section under the Metrics tab on the CloudWatch pricing page.
Alerting on CloudWatch Metrics
Oodle supports alerting on AWS CloudWatch metrics only when using the metric stream integration method.
To set up alerts on your CloudWatch metrics:
- Ensure you have configured the metric stream integration as described above
- Navigate to the Alerts section in Oodle
- Create a new alert using your streamed CloudWatch metrics
The alert will use the translated metric names described in the previous section. For example, to alert on average ECS CPU utilization, you would use the query amazonaws_com_AWS_ECS_CPUUtilization_sum/amazonaws_com_AWS_ECS_CPUUtilization_count .
Support
If you need assistance or have any questions, please reach out to us through:
- Email at [email protected]