Open Telemetry
Oodle supports metrics ingestion via Open Telemetry.
Zero-Code Instrumentation
For applications that don't have OpenTelemetry instrumentation built-in, you can use zero-code instrumentation to automatically capture telemetry data without modifying your application code.
Supported Languages
- Java - Use the OpenTelemetry Java agent for automatic instrumentation
- Python - Use the
opentelemetry-instrumentCLI for automatic instrumentation
Otel Collector Configuration
In the Oodle UI, navigate to the Settings page and click on Connect in the
Open Telemetry tile and copy the provided configuration snippet.
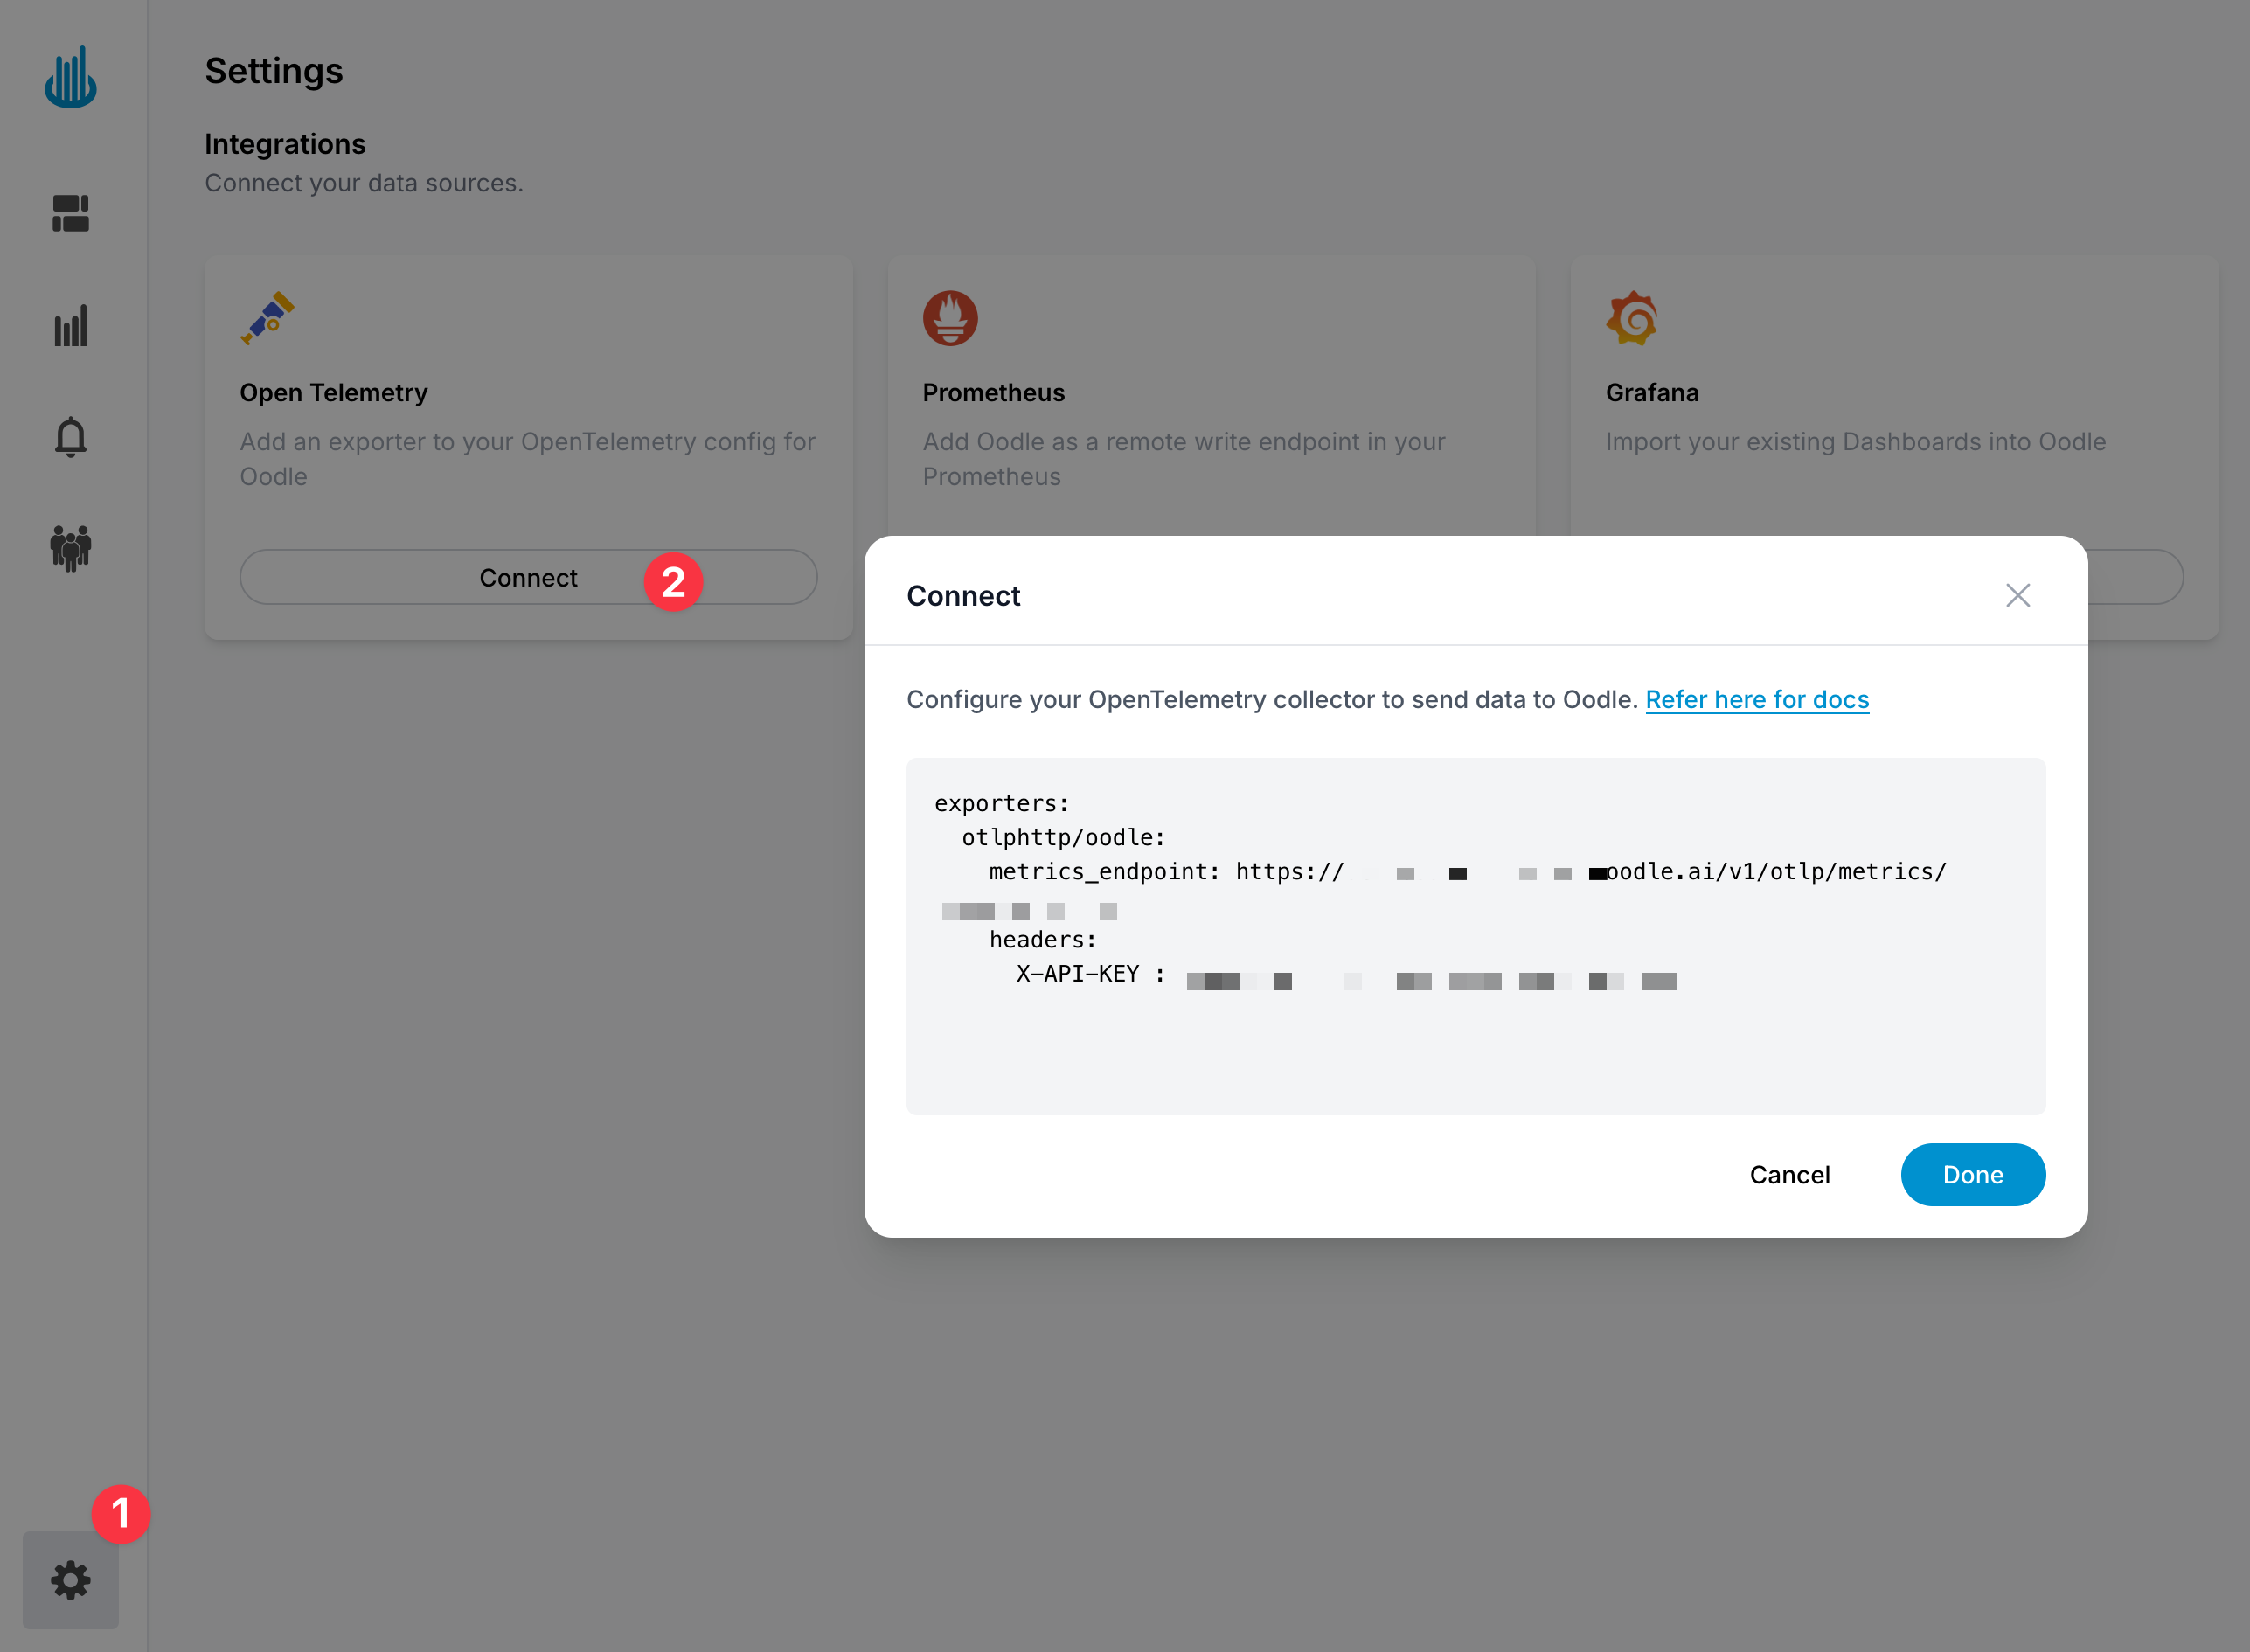
Oodle can ingest Open Telemetry metrics using the
otlphttp exporter.
Add the otlphttp exporter from above in your Open Telemetry collector
configuration by adding an entry in the exporters section, and then adding
the exporter to the service.pipelines.metrics.exporters list.
receivers:
  otlp:
    protocols:
      http:

processors:
  batch:

exporters:
  otlphttp/oodle:
    endpoint: "https://<OTLP_ENDPOINT>"
    headers:
      X-OODLE-INSTANCE: "<OODLE_INSTANCE>"
      X-API-KEY: "<API_KEY>"

service:
  pipelines:
    metrics:
      receivers: [otlp]
      processors: [batch]
      exporters: [otlphttp/oodle]
    logs:
      receivers: [otlp]
      processors: [batch]
      exporters: [otlphttp/oodle]
    traces:
      receivers: [otlp]
      processors: [batch]
      exporters: [otlphttp/oodle]
Steps
You can find the Open Telemetry config changes by following these steps:
- Login to the Oodle UI, then navigate to Settings page
- Click on the Open Telemetry tile
- Choose an appropriate API key from the list on top of the drawer
- Ensure that you have selected the Metrics feature in Step 1.
Follow the steps in the drawer to complete the OpenTelemetry setup
Otel To Prometheus Translation
Ingested Open Telemetry metrics are converted to Prometheus format.
Metric Name Normalization
Metric names are normalized by removing the
characters that Prometheus does not support
with underscore (_) and dropping the redundant, leading and trailing
underscores. For example, system.cpu.time becomes system_cpu_time.
We also ensure that metric name does not start with a digit by prefixing it with an underscore if necessary.
Attributes
Resource and metric attributes are converted to Prometheus labels with special handling for following resource attributes:
service.nameis mapped tojoblabel.service.instance.idis mapped toinstancelabel.
Temporality
We currently do not support delta temporality for Sum, Histogram and Exponential Histogram metric types.
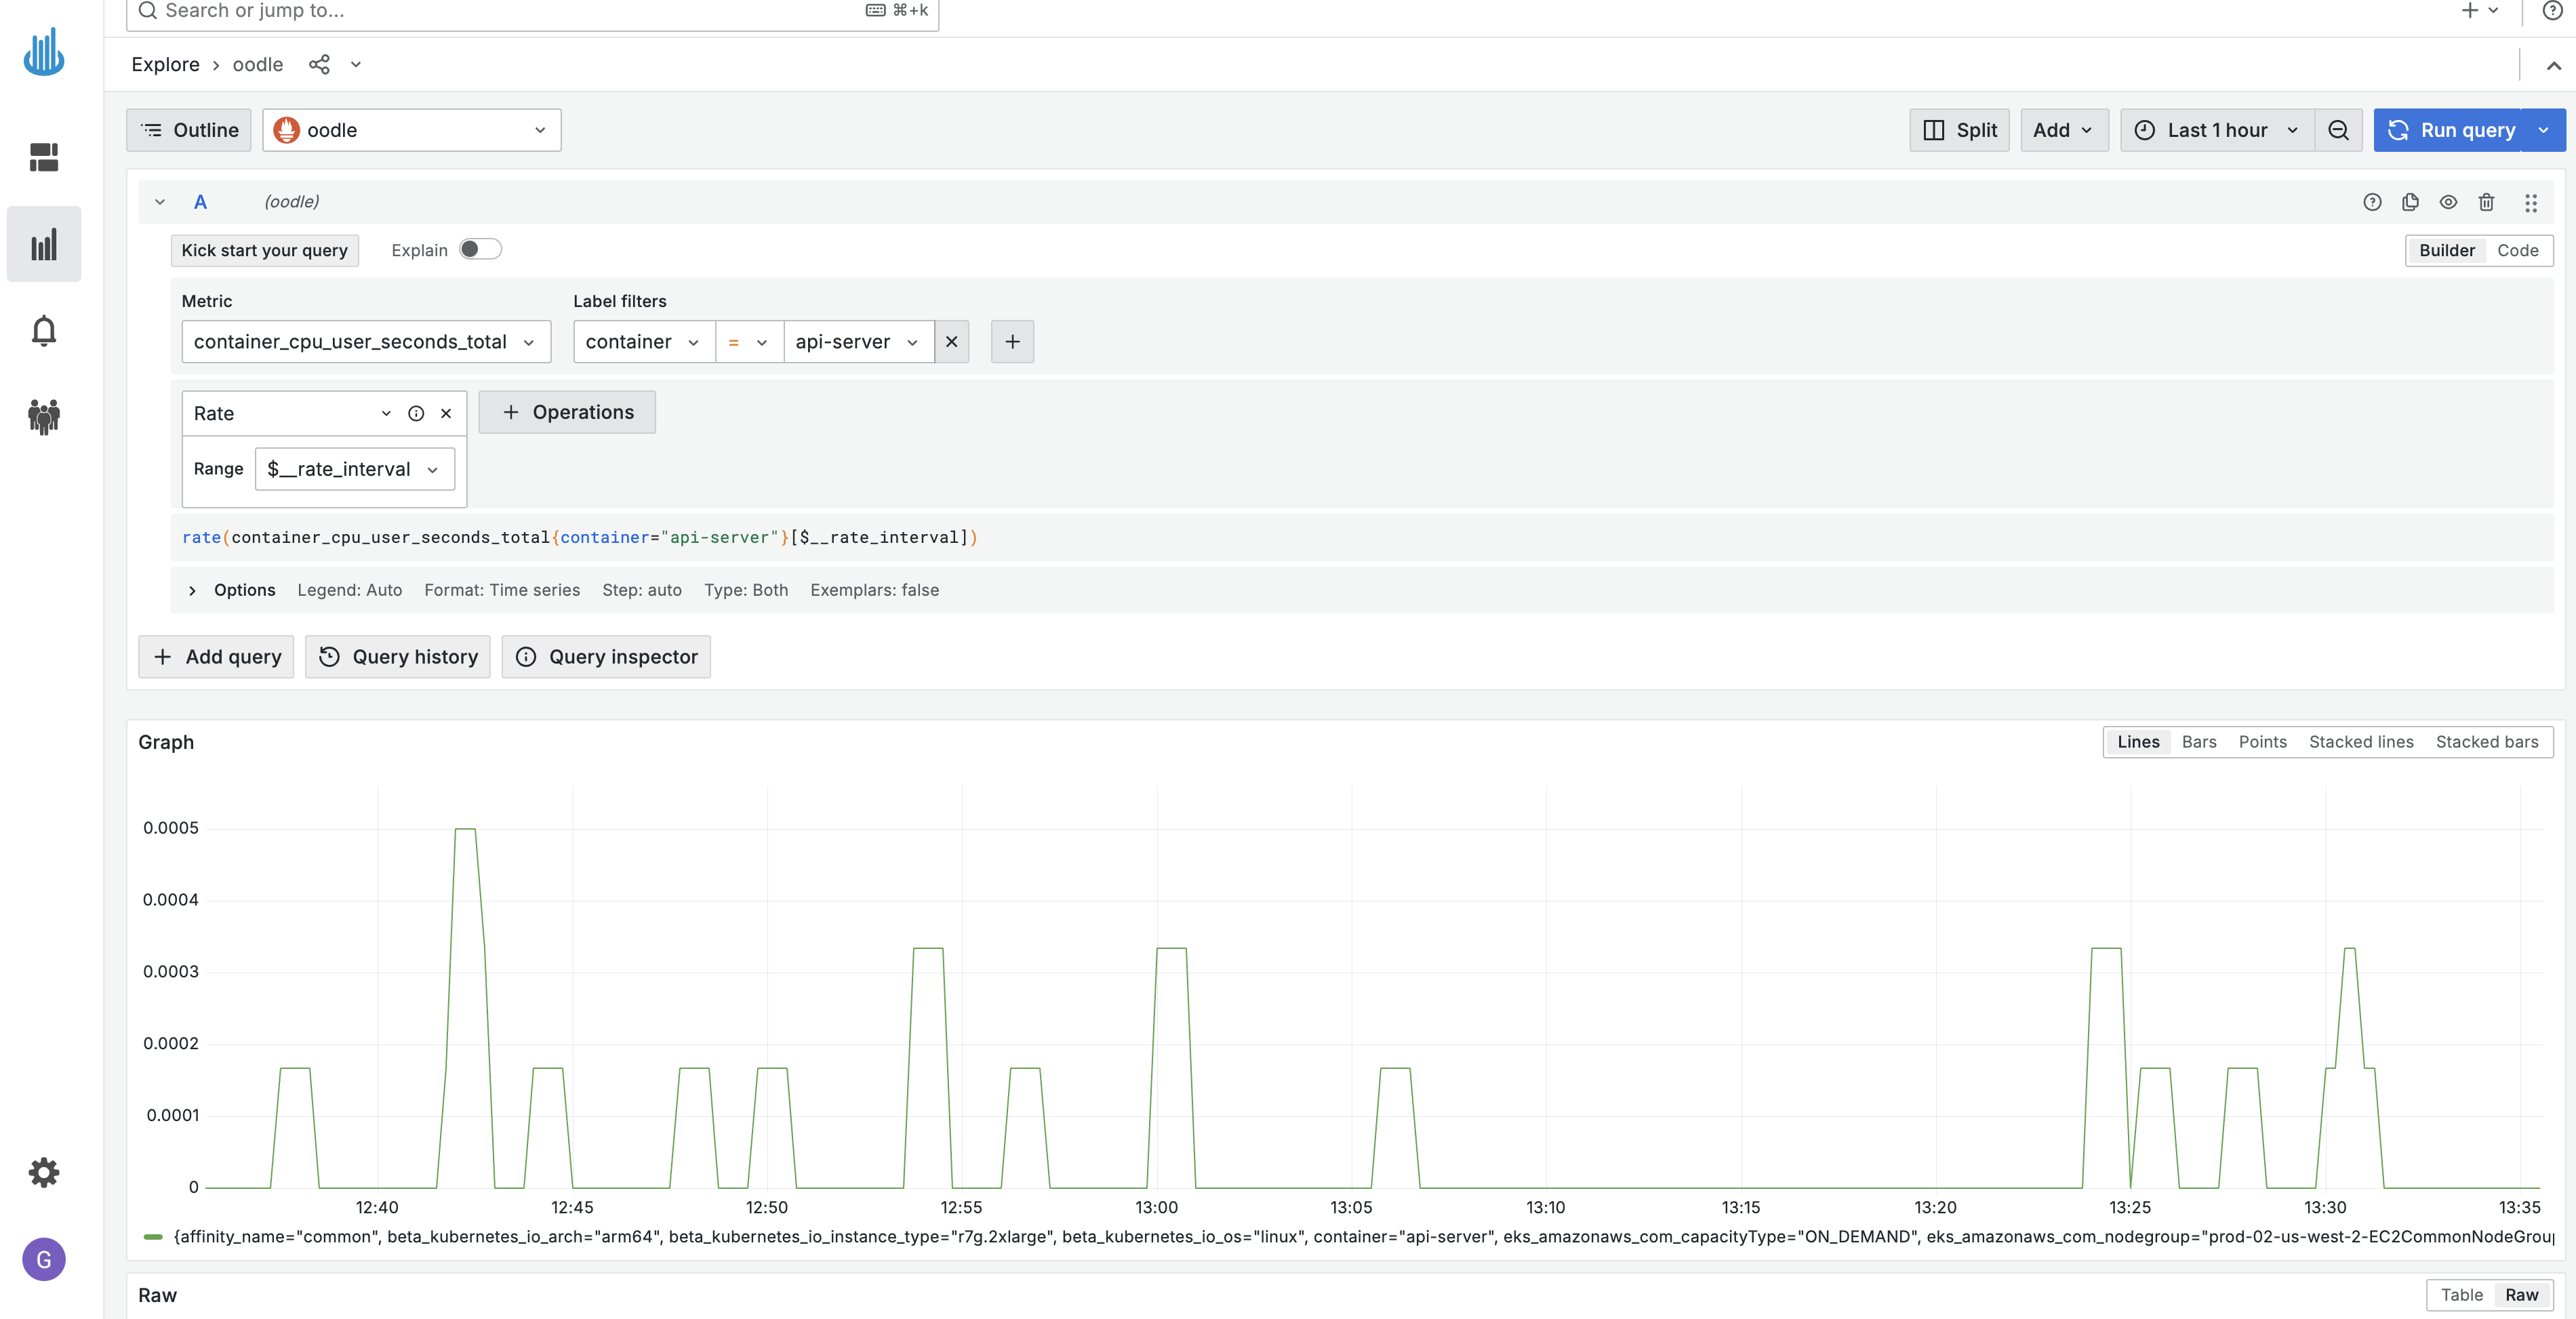
Visualize Metrics
You can visualize metrics in Oodle using the Explore Metrics tab. It supports
Grafana Builder and Code Editor to build PromQL queries. Please refer to
PromQL Query docs
to learn more about PromQL.
Support
If you need assistance or have any questions, please reach out to us through:
- Email at [email protected]