AI Agent Observability
Oodle's AI Agent Observability gives engineering teams visibility into how AI coding agents like Claude Code are used across the organization. Track token usage, costs, session activity, tool calls, and more — all in one place.
Why Monitor AI Agents?
AI coding agents are powerful but opaque. Without observability you cannot answer questions like:
- How much are we spending on AI-assisted coding?
- Which models are being used, and by whom?
- How many sessions run per day or week?
- Are tool calls succeeding, or are agents hitting errors?
- What prompts are developers sending to the agent?
Oodle collects telemetry exported by Claude Code via OpenTelemetry and surfaces it through a dedicated analysis page with pre-built dashboards and a session-level event timeline.
Supported Agents
| Agent | Metrics | Events / Logs |
|---|---|---|
| Claude Code | Token usage, cost, sessions, active time, lines of code, commits, PRs | User prompts, API requests, tool results, tool decisions |
Getting Started
1. Enable Telemetry in Claude Code
Claude Code ships with built-in OpenTelemetry support. You need to set a few environment variables so it exports metrics and events to Oodle.
The fastest way is to use the integration tile in the Oodle UI:
- Navigate to Settings → Integrations
- Open the AI Agent Observability pill
- Click the Claude Code Observability tile
- Select an API key and follow the steps shown
The tile gives you a ready-to-copy set of environment variables. For reference, the key variables are:
# Enable telemetry
export CLAUDE_CODE_ENABLE_TELEMETRY=1

# Configure exporters
export OTEL_METRICS_EXPORTER=otlp
export OTEL_LOGS_EXPORTER=otlp

# OTLP endpoint and auth
export OTEL_EXPORTER_OTLP_PROTOCOL=http/protobuf
export OTEL_EXPORTER_OTLP_ENDPOINT=https://<OTLP_ENDPOINT>
export OTEL_EXPORTER_OTLP_HEADERS="X-API-KEY=<API_KEY>, X-OODLE-INSTANCE=<INSTANCE_ID>"
export OTEL_EXPORTER_OTLP_METRICS_TEMPORALITY_PREFERENCE=delta

# Enable detailed event logging
export OTEL_LOG_USER_PROMPTS=1
export OTEL_LOG_TOOL_DETAILS=1
Replace <OTLP_ENDPOINT>, <API_KEY>, and
<INSTANCE_ID> with values from the integration tile.
For faster feedback during initial setup, lower the export intervals:
export OTEL_METRIC_EXPORT_INTERVAL=10000
export OTEL_LOGS_EXPORT_INTERVAL=5000
2. Roll Out to Your Team
To distribute settings across all users, add them to
the managed settings file
(~/.claude/settings.json):
{
  "env": {
    "CLAUDE_CODE_ENABLE_TELEMETRY": "1",
    "OTEL_METRICS_EXPORTER": "otlp",
    "OTEL_LOGS_EXPORTER": "otlp",
    "OTEL_EXPORTER_OTLP_ENDPOINT": "https://<OTLP_ENDPOINT>",
    "OTEL_EXPORTER_OTLP_HEADERS": "X-API-KEY=<API_KEY>, X-OODLE-INSTANCE=<INSTANCE_ID>",
    "OTEL_EXPORTER_OTLP_METRICS_TEMPORALITY_PREFERENCE": "delta",
    "OTEL_LOG_USER_PROMPTS": "1",
    "OTEL_LOG_TOOL_DETAILS": "1"
  }
}
3. Open the Claude Analysis Page
Once telemetry starts flowing (metrics export every
60 s, events every 5 s by default), navigate to
Claude Analysis in the Oodle sidebar — or go
directly to /claude-analysis.
Claude Analysis Page
The Claude Analysis page has two tabs: Charts and Sessions.
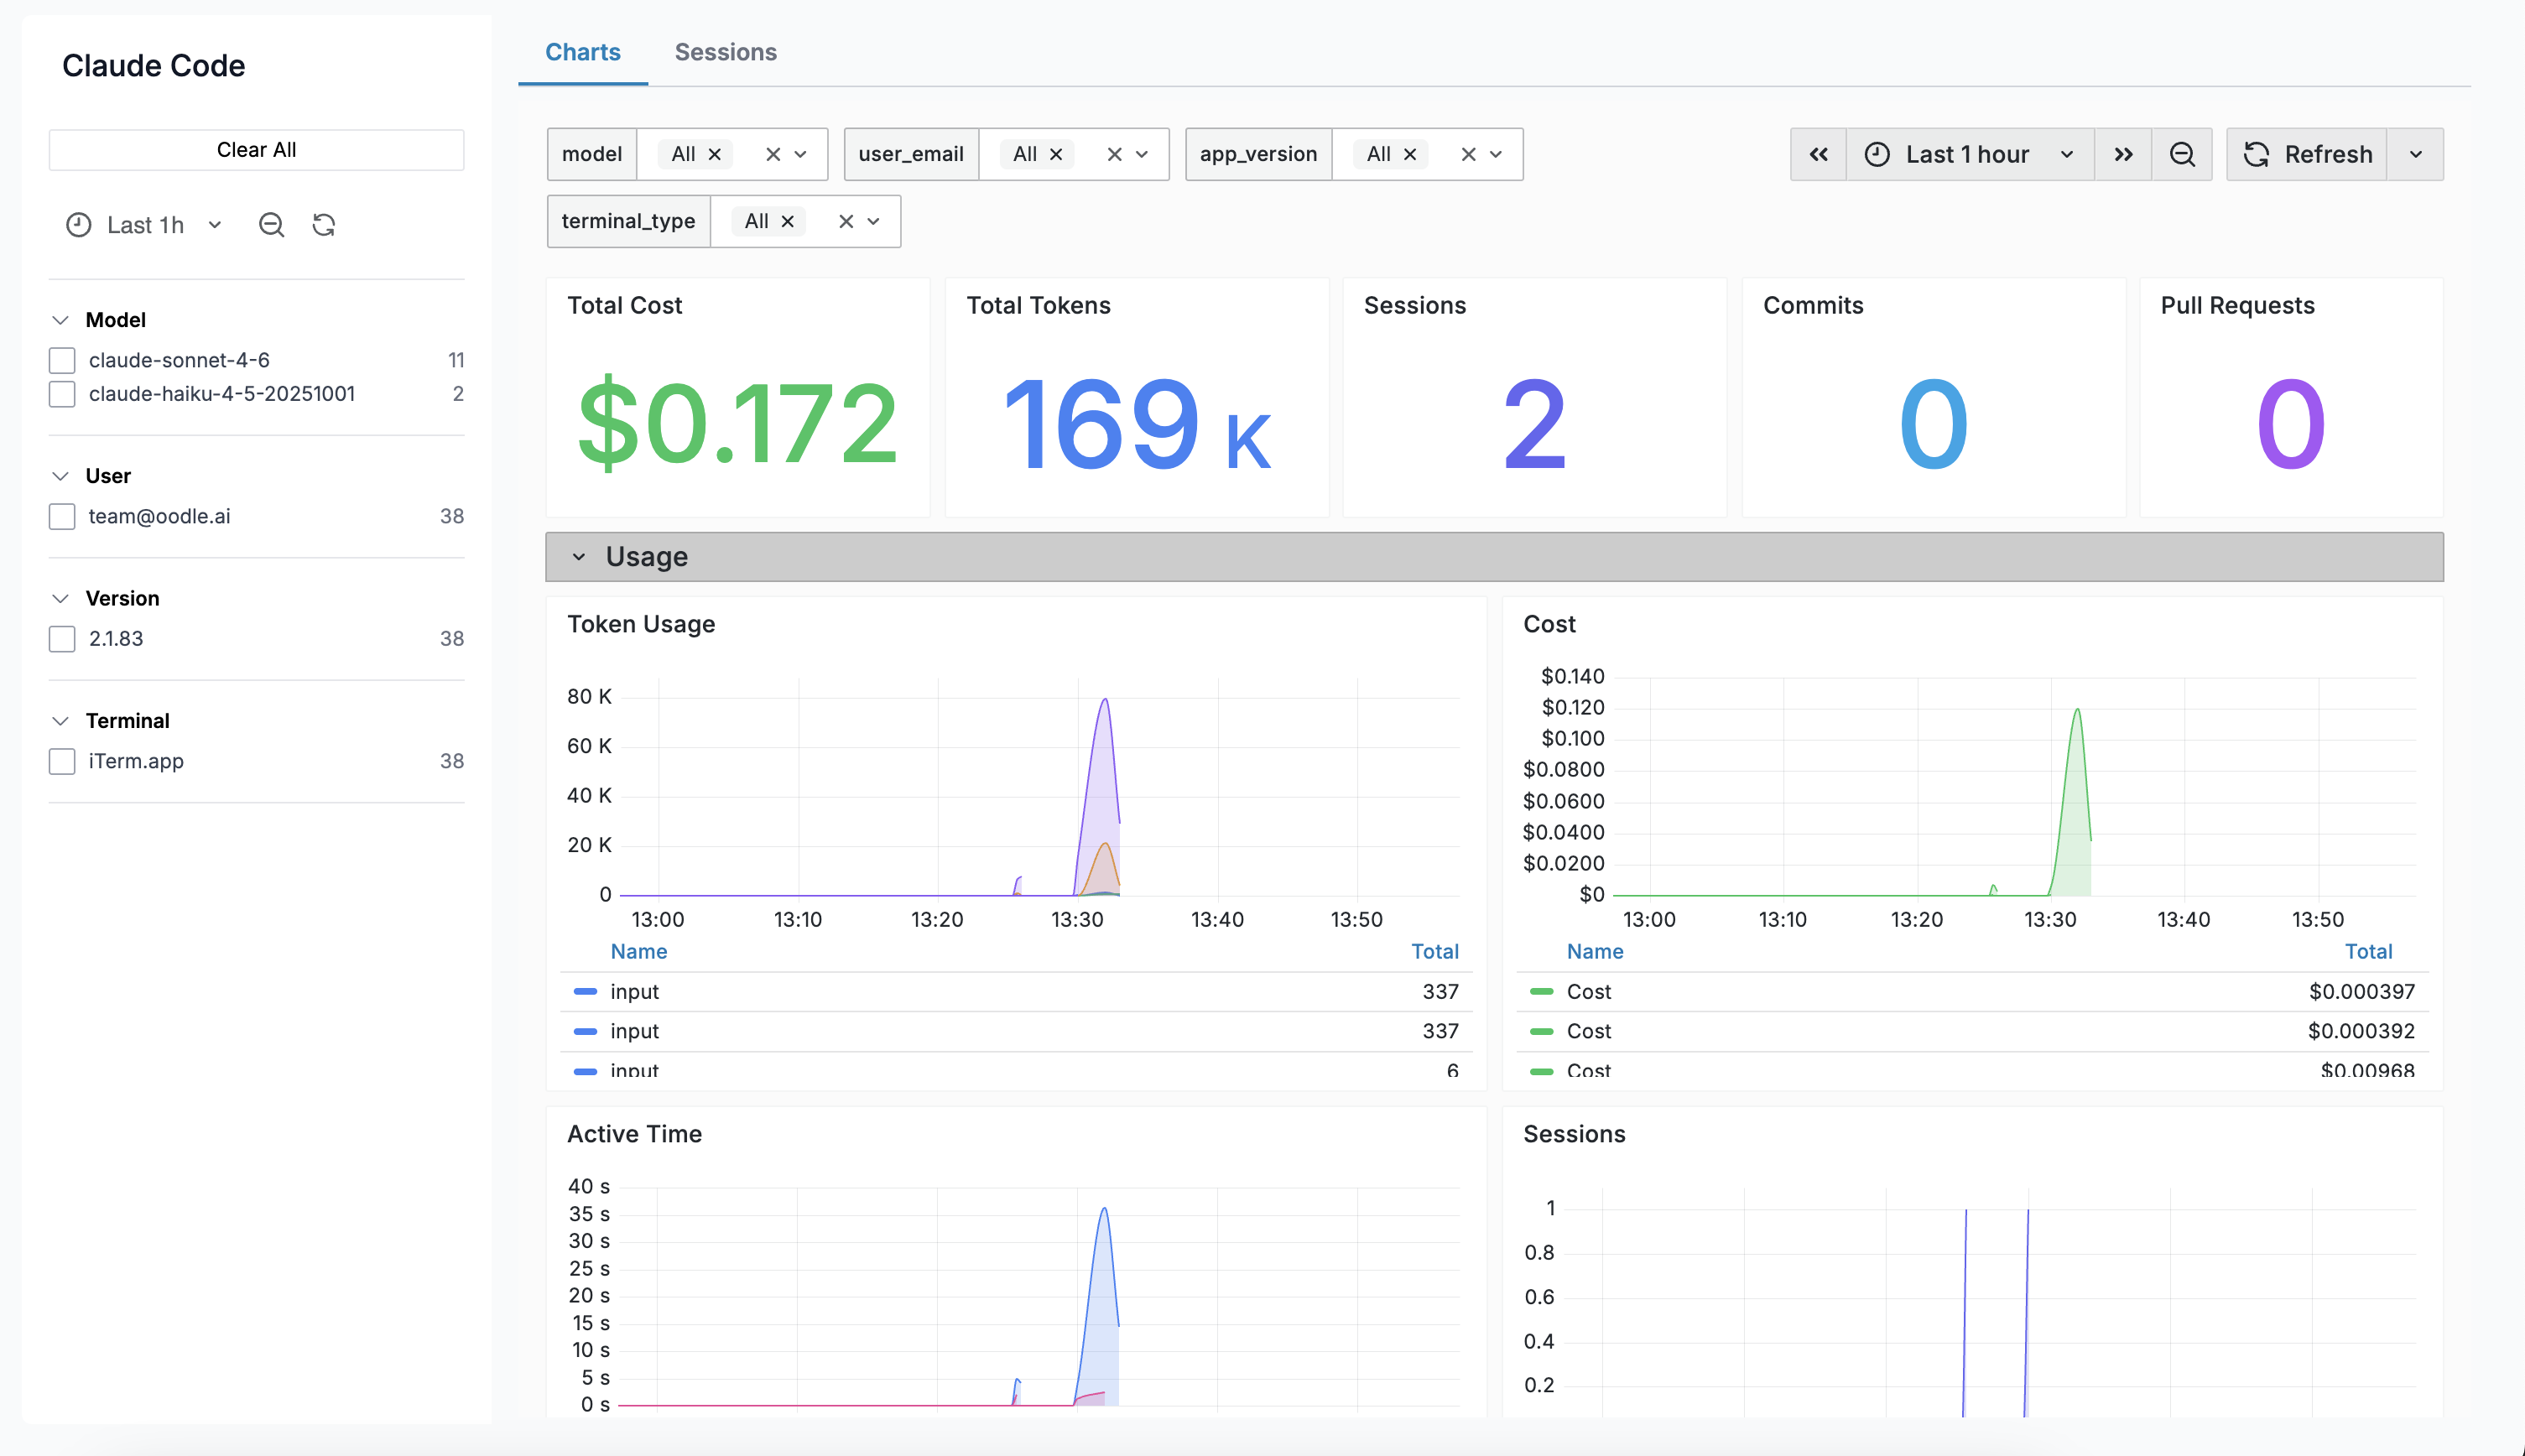
Charts Tab
The Charts tab embeds a Grafana dashboard with pre-built panels covering:
| Panel | Description |
|---|---|
| Total Cost | Aggregate estimated cost over the selected range |
| Total Tokens | Sum of input + output tokens |
| Sessions | Number of CLI sessions started |
| Commits | Commits created via Claude Code |
| Pull Requests | PRs created via Claude Code |
| Token Usage | Time series of input vs output tokens |
| Cost Over Time | Time series of estimated cost by model |
| Active Time | User interaction and CLI processing time |
| Lines of Code | Lines added vs removed |
| Tool Calls | Tool invocations over time |
| API Requests | API calls by model |
| Decisions | Tool accept / reject decisions |
Sessions Tab
The Sessions tab shows a table of individual Claude Code sessions with key stats at a glance:
| Column | Description |
|---|---|
| Start Time | When the session began |
| User | Email of the developer |
| Model | Primary model used |
| Prompts | Number of user prompts in the session |
| Duration | Wall-clock duration of the session |
| Cost | Total estimated cost |
| Tools | Number of tool calls made |
| Tokens | Total tokens (input + output) |
| Errors | Count of errors in the session |
Sessions
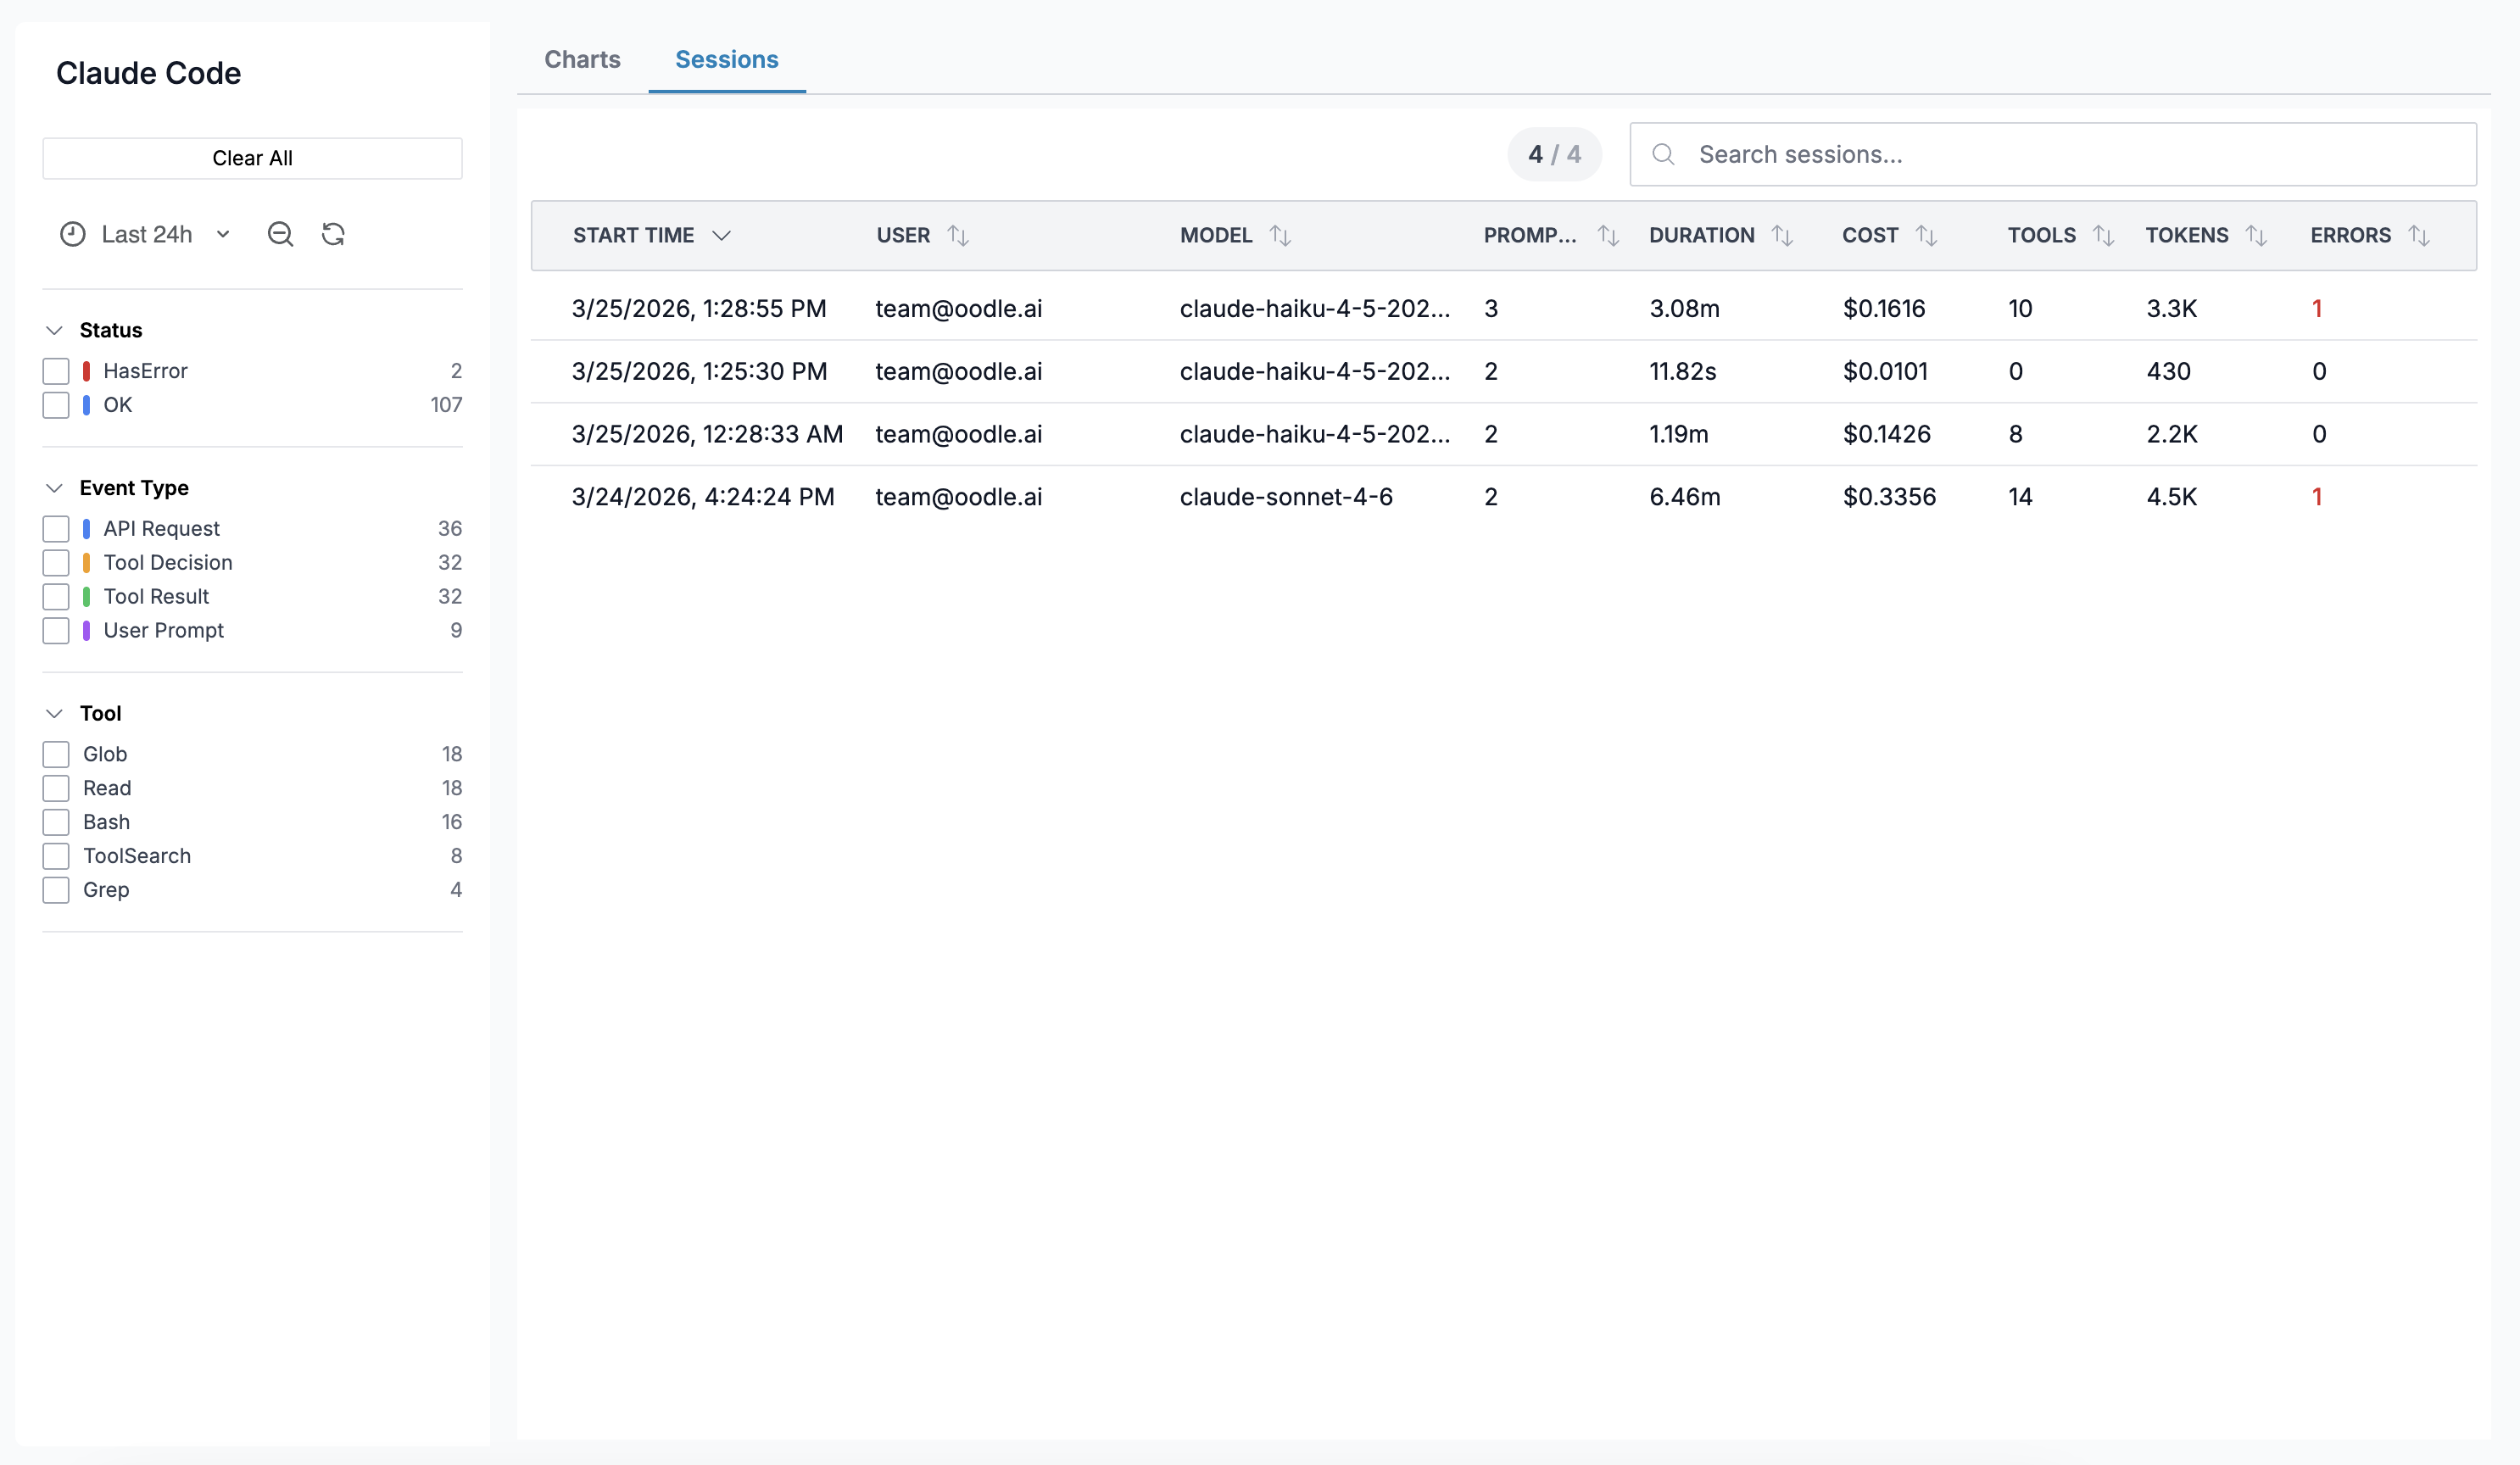
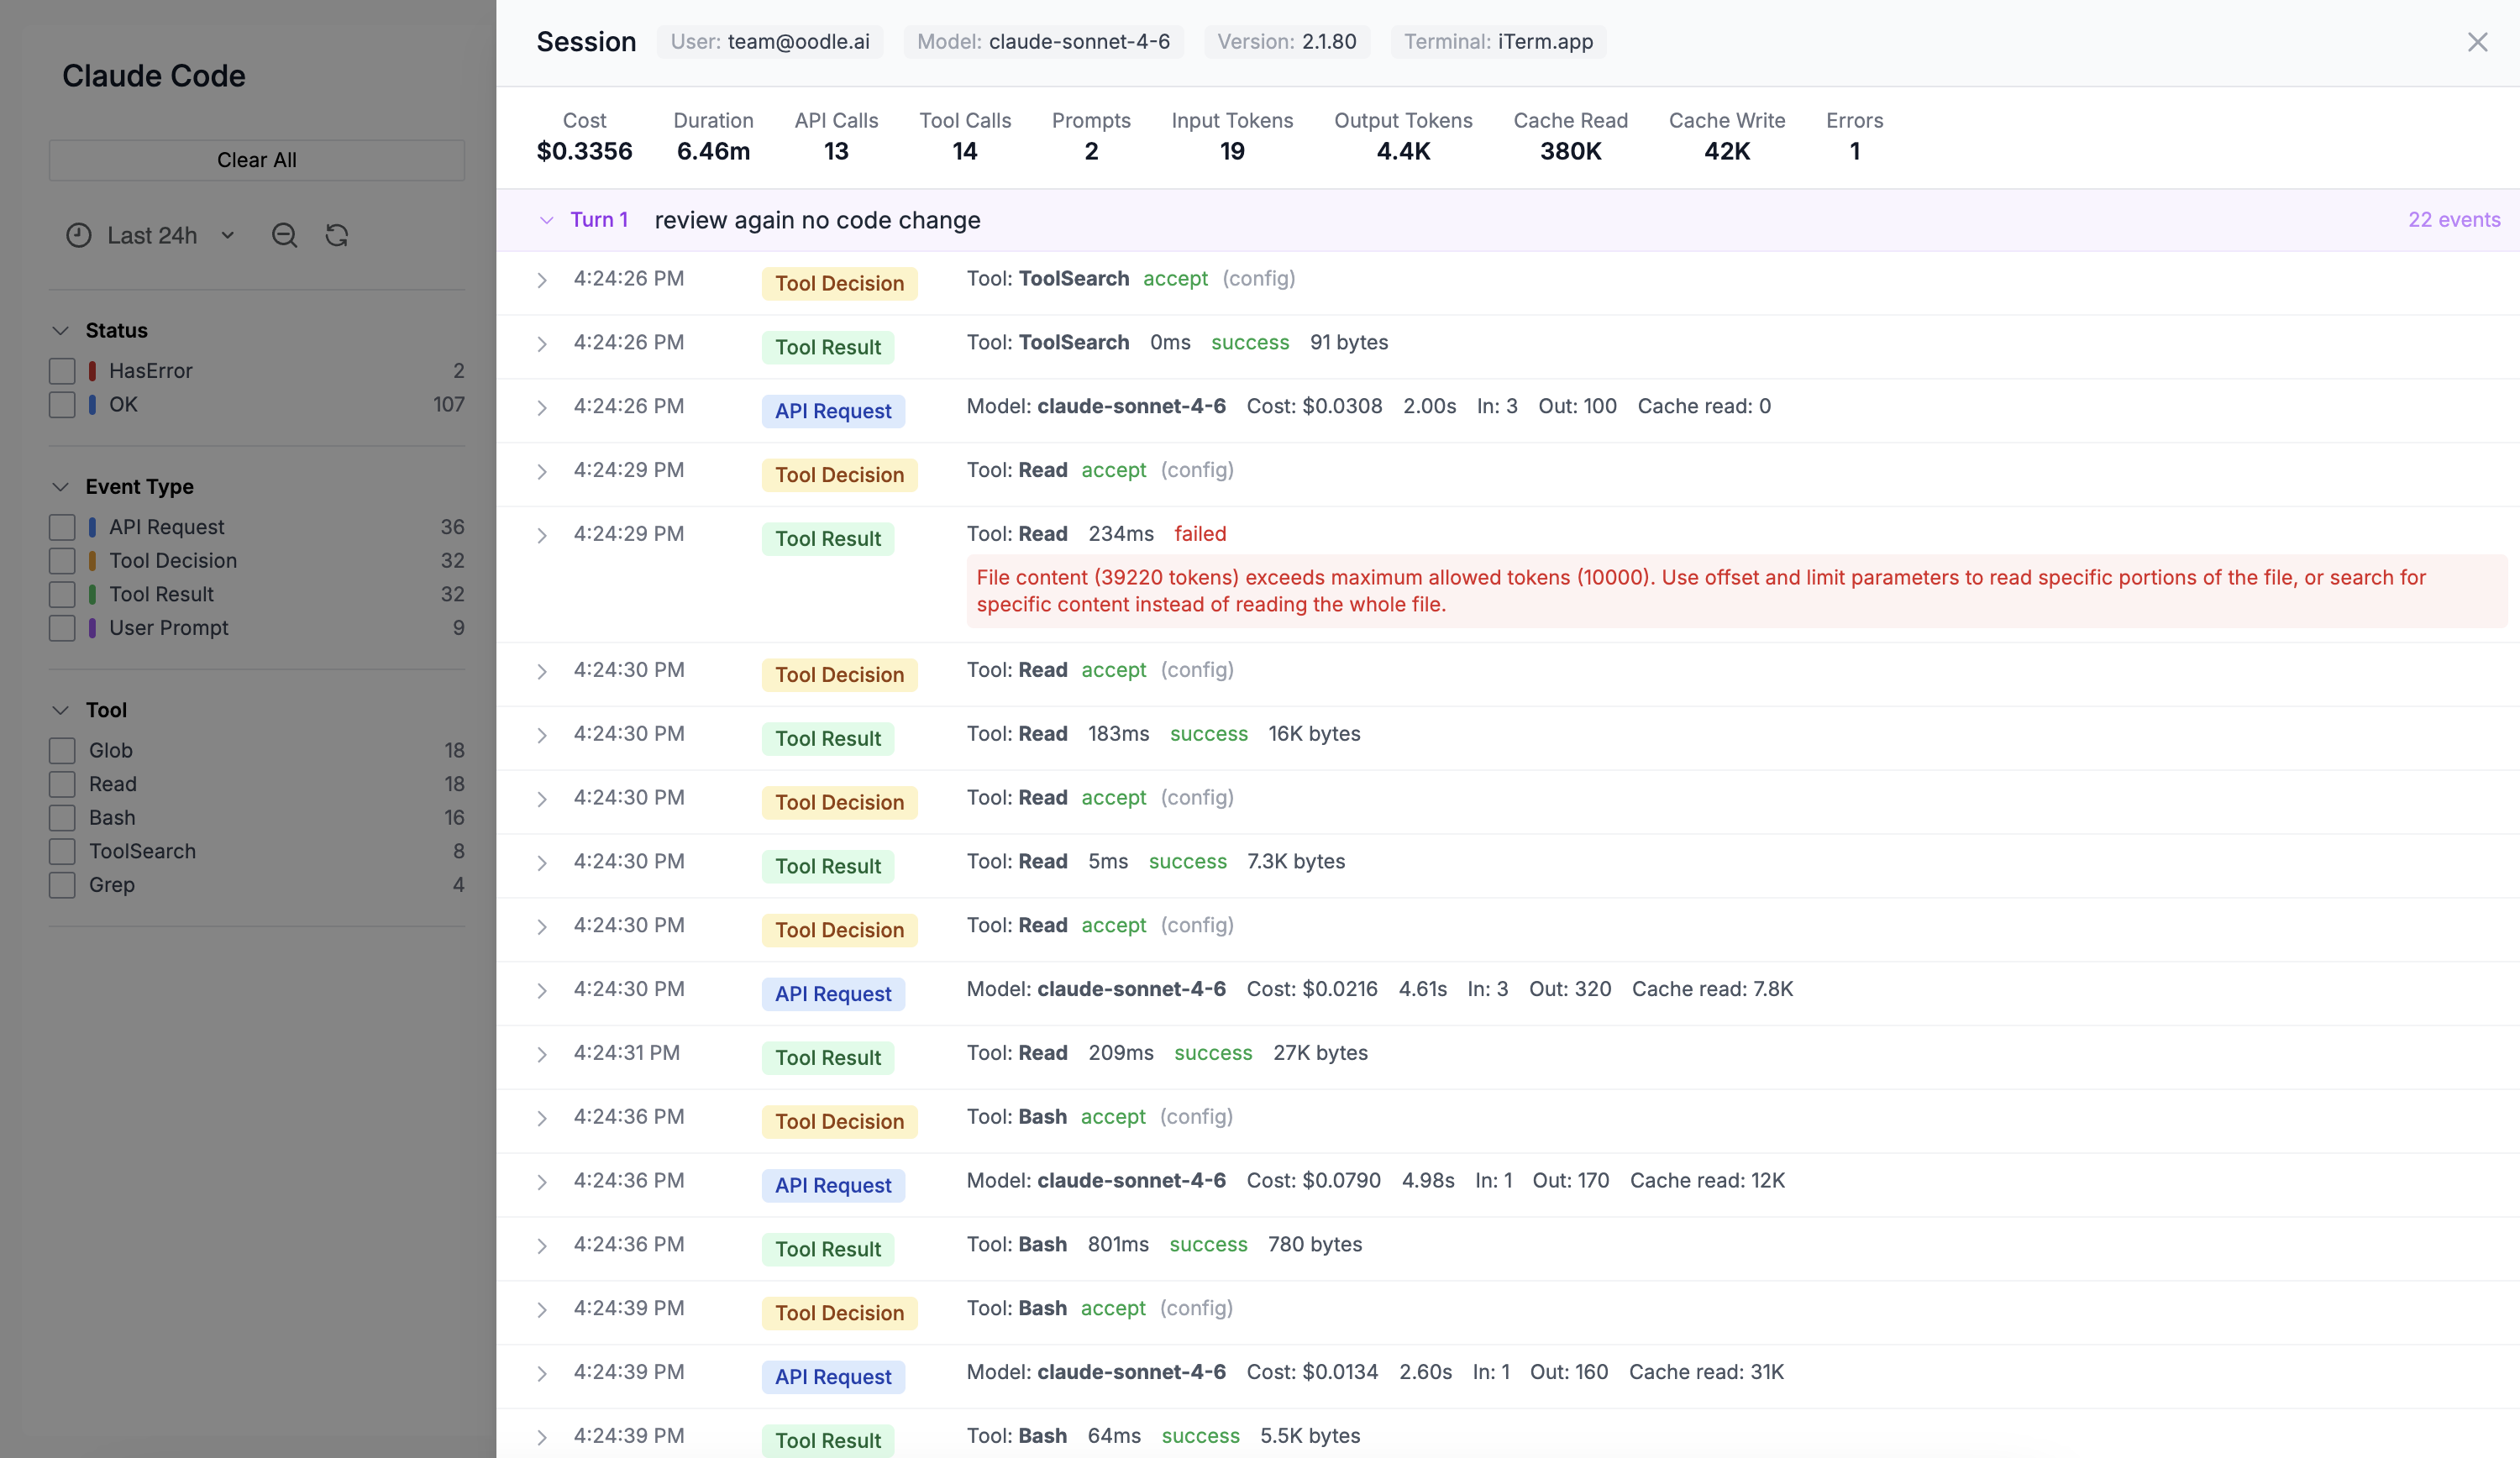
Click any row to open a Session Detail drawer showing a turn-by-turn timeline of every event in the session.
Session Detail Drawer
The drawer displays:
- Session metadata — session ID, user, model, start time, app version, terminal type
- Aggregated stats — total cost, tokens, tool calls, errors, duration
- Turn-by-turn timeline — each turn is collapsible and shows the user prompt followed by individual events (API requests, tool calls, decisions). Every event row is expandable to reveal the full raw JSON payload.
Sidebar Filters
A sidebar on the left lets you filter data by:
- Time Range — Grafana-style time range picker
- Event Type — filter events by type (sessions tab only)
- Status — OK or HasError (sessions tab only)
- Model — filter by LLM model
- User — filter by developer email
- App Version — filter by Claude Code version
- Terminal — filter by terminal type
What Gets Collected
Metrics
Claude Code exports the following as OpenTelemetry metrics (delta temporality):
| Metric | Labels | Description |
|---|---|---|
claude_code_token_usage | type, model | Token count by type (input, output, cache_read, cache_creation) |
claude_code_cost_usage | model | Estimated cost in USD |
claude_code_session_count | — | Sessions started |
claude_code_active_time | type | User and CLI active time |
claude_code_lines_of_code | type | Lines added / removed |
claude_code_num_commits | — | Commits created |
claude_code_num_pull_requests | — | Pull requests created |
claude_code_tool_call_count | tool_name | Tool invocations |
claude_code_api_request_count | model | API calls by model |
claude_code_decision | type | Accept / reject decisions |
Events (Logs)
Events are exported via the OpenTelemetry logs
protocol. Each event has a log.attributes.event_type
field:
| Event Type | Key Attributes |
|---|---|
claude_code.user_prompt | Prompt text (opt-in), character count |
claude_code.api_request | Model, cost, input/output tokens, cache tokens, duration |
claude_code.tool_result | Tool name, success, duration |
claude_code.tool_use_decision | Decision (accept/reject), source |
Events are grouped by session_id on the Sessions tab
to reconstruct the turn-by-turn timeline.
Best Practices
- Start with a single user to verify telemetry is flowing before rolling out org-wide.
- Use the managed settings file for consistent configuration across your team.
- Enable
OTEL_LOG_USER_PROMPTSto get full prompt text in the event timeline — useful for understanding usage patterns. - Set up alerts on
claude_code_cost_usageto catch unexpected spending spikes. - Use sidebar filters to drill down by user or model when investigating specific sessions.
Further Reading
Support
If you need assistance or have any questions, please reach out to us through:
- Email at [email protected]