Kubernetes Monitoring
Oodle provides built-in Kubernetes monitoring that gives you full visibility into cluster health, resource utilization, pod status, and workload performance — all without writing PromQL.
Overview Tab
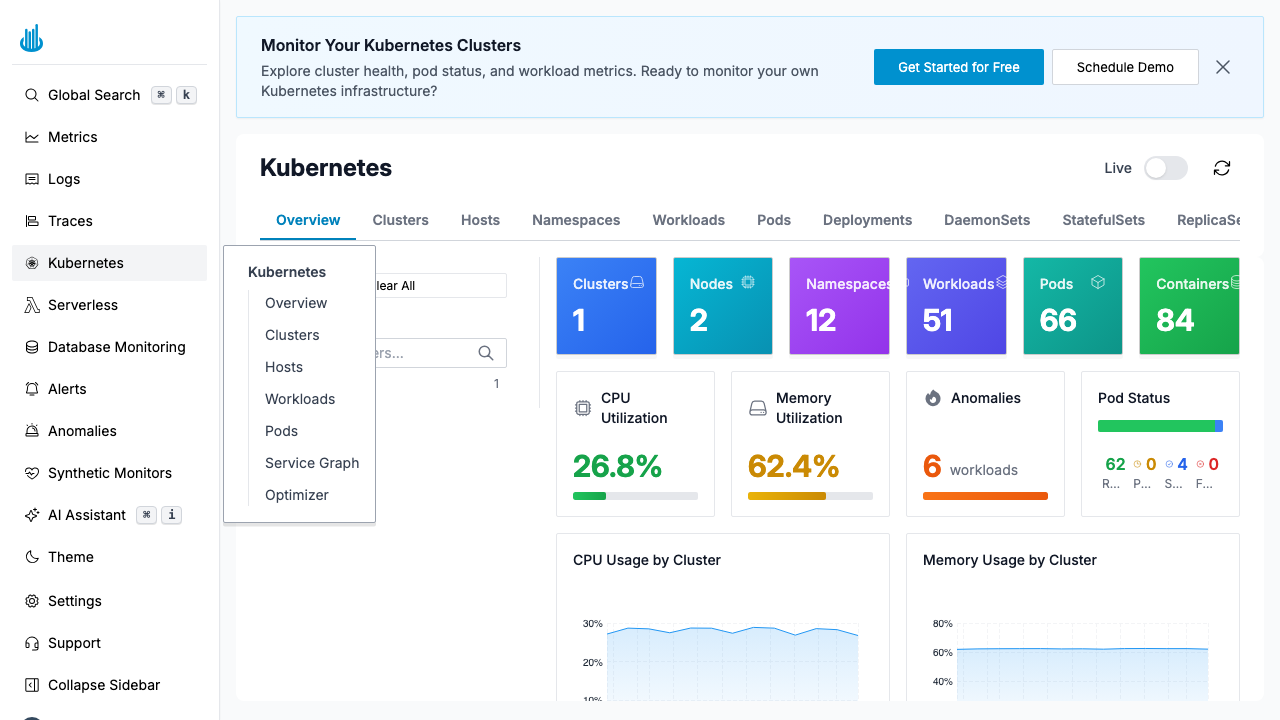
The Overview tab is the landing page for Kubernetes monitoring. It displays high-level summary cards and charts:
Summary Cards
| Card | Description |
|---|---|
| Clusters | Total number of monitored clusters |
| Nodes | Total number of cluster nodes |
| Namespaces | Number of active namespaces |
| Workloads | Total workload count (Deployments, DaemonSets, etc.) |
| Pods | Total pod count across all clusters |
| Containers | Total running containers |
Health Metrics
- CPU Utilization — Cluster-wide CPU usage percentage with a progress bar.
- Memory Utilization — Cluster-wide memory usage percentage.
- Anomalies — Number of workloads with detected anomalies.
- Pod Status — Breakdown of pods by state (Running, Pending, Succeeded, Failed).
Charts
- CPU Usage by Cluster — Time-series chart of CPU usage per cluster.
- Memory Usage by Cluster — Time-series chart of memory usage per cluster.
Navigation Tabs
The Kubernetes page is organized into tabs accessible from the top navigation bar:
| Tab | Description |
|---|---|
| Overview | High-level cluster health dashboard |
| Clusters | Per-cluster resource table |
| Hosts | Node-level resource details |
| Namespaces | Namespace-level resource breakdown |
| Workloads | Workload list with status and resource usage |
| Pods | Pod-level details, status, and resource usage |
| Deployments | Deployment-specific view |
| DaemonSets | DaemonSet-specific view |
| StatefulSets | StatefulSet-specific view |
| ReplicaSets | ReplicaSet-specific view |
| Jobs | Job execution status |
| CronJobs | Cron job schedules and status |
| Optimizer | Resource optimization recommendations |
Filters
The left-hand filter panel lets you narrow the view:
- Cluster — Select one or more clusters.
- Namespace — Filter by namespace.
- Workload — Filter by workload name.
Filters persist across tabs, so you can switch between Overview, Pods, and Workloads while keeping the same scope.
Live Mode and Refresh
Toggle the Live switch in the toolbar to enable auto-refresh (every 30 seconds). You can also click the Refresh button for a one-time data reload.
Best Practices
- Start with Overview to get the big picture, then drill into specific tabs for details.
- Use filters to scope down to a specific cluster or namespace when investigating issues.
- Monitor the Anomalies card — It highlights workloads with unusual behavior detected by Oodle's anomaly detection.
- Check the Optimizer tab regularly for cost-saving recommendations.
Support
If you need assistance or have any questions, please reach out to us through:
- Email at [email protected]